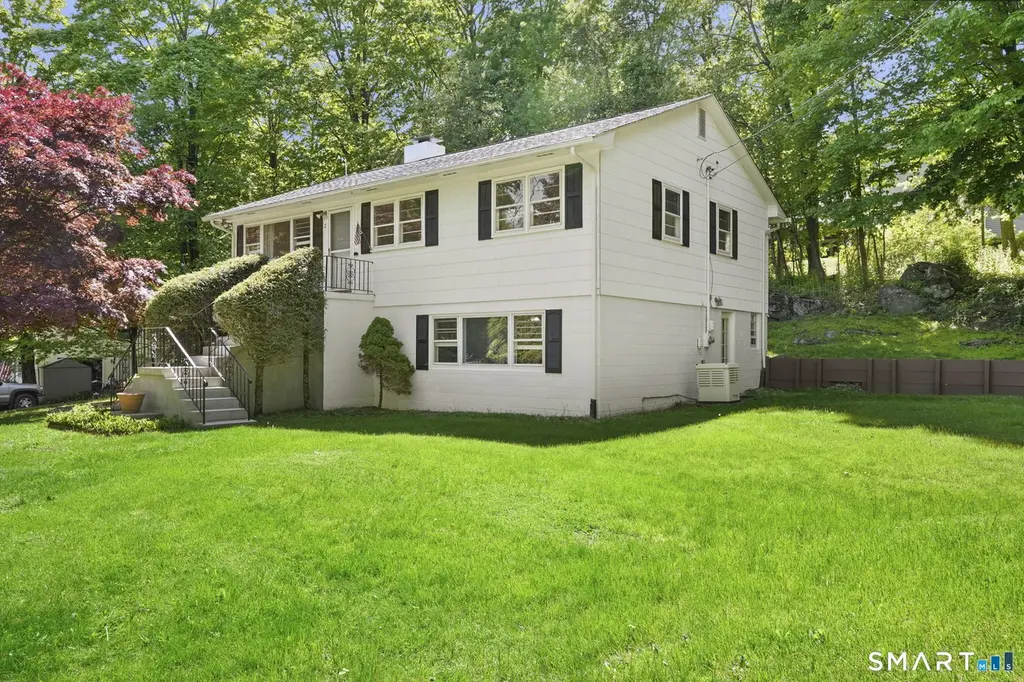
2 Laurel Hill Rd S · Inglenook, CT
Flood risk 1/10 · Minimal
- FEMA flood zone
- X (unshaded)
- Chance of flooding over 30 yrs
- 0.0%
- Est. flood insurance / yr
- $473 – $860
Fire risk 3/10 · Minor
- Est. fire insurance / yr
- $829 – $1,539
Heat risk 4/10 · Minor
- Hot days now (above 97°F)
- 7 days/yr
- Hot days in 30 yrs
- 15 days/yr
Wind risk 4/10 · Minor
- Chance of severe wind over 30 yrs
- 19.0%
Air-quality risk 3/10 · Minor
- Unhealthy air days now
- 2 days/yr
- Unhealthy air days in 30 yrs
- 3 days/yr
Risk factors via First Street. Map © Google.
Why this score? — see what drove the F grade
The composite is a weighted blend of 9 inputs, each scored 0–100. Each bar is that input's sub-score; the figure is the points it added to the 100-point composite (weight × sub-score).
- Appreciation +10.0/10.0
- ARV discount +7.5/15.0
- Schools +5.6/10.0
- Cash flow +4.1/30.0
- Rent growth +2.5/5.0
- Livability +2.5/5.0
- Condition / age +2.5/5.0
- 1% rule +0.0/10.0
- DSCR +0.0/10.0
$499,900
🖨 Deal sheet 📄 Offer letter ✓ Due diligence
Listing remarks
Incredibly charming Ranch set on a peaceful and private . 53-acre lot in quaint Sherman, offering the perfect blend of small-town charm, natural beauty, and incredibly low taxes. Tucked away in a serene setting, this well-maintained home provides both privacy and convenience, just minutes from marinas, Candlewood Lake, and Squantz Pond for year-round recreation and enjoyment. The main level features a bright and inviting Living Room with brand new carpeting and a cozy wood-burning fireplace, creating the perfect space to relax and unwind. The spacious Eat-In Kitchen offers white cabinetry, plenty of room for dining, and direct access to the oversized back deck, ideal for entertaining, outdo
Key facts
- In law apartment
- Private lot
- Oversized back deck
Tags
Property features AI
Exterior
- Parking: Under-house garage (1 garage)
- Utilities: Private well water; Septic system; Propane hot water; Oil heating (fuel tank in basement)
- Home design: Single-family home
- Construction: Built with frame construction; White exterior; Shingle and asbestos siding; Block foundation; Asphalt shingle roof
- Exterior features: Deck; Level lot
Interior
- Kitchen: Cooktop; Wall oven; Microwave; Refrigerator
- Bedrooms: 3 bedrooms
- Bathrooms: 2 full bathrooms
- Heating & cooling: Hot air heating fueled by oil; Tankless propane hot water
- Interior features: 7 total rooms; Full, fully finished basement; Attic with pull-down stairs; One fireplace; Central air
- Laundry & utility: Washer and dryer; Laundry on lower level
Neighborhood map
What this means for you Summary
Snapshot
- This is a 3-bed/2.0-bath single-family listed at $500k.
Deal economics
- At list price, monthly cash flow is $-1k ($-16k/yr) — negative.
- To cash-flow at today's rent, offer at most $258k (48.3% below list).
- To meet the 1% rule (rent ≥ 1% of price), the offer needs to be $220k (56.0% below list).
- Recommended offer: $220k (56.0% below list) — sets the bar for 1% rule.
Location & tenants
- Location reads: area grade F — affects rentability + tenant quality, not the cash-flow math above.
- Sherman School District (rural): math 55% / reading 60% proficiency, ranked #87 of 192 in CT (top 45%) — acceptable for families but not a draw, mixed tenant base, ~2y average lease; only 5% free/reduced lunch — higher-income household profile.
- Zoned schools: Sherman School (math 57% / reading 67%, grade B, #137 of 553 statewide, top 28%, 264 students, 2% FRL) — zoned schools at 2% FRL track the district average.
- Market conditions: 43 active listings in the ZIP; 1 comparable units currently listed for rent nearby; 1,151 units permitted in Western Connecticut Planning Region in 2024 (714 in 5+ unit buildings).
Forward outlook
- In year one you build about $53k of equity ($3k loan paydown + $50k appreciation (10.0% local appreciation)).
- By year 2, paydown + projected appreciation supports a ~$86k cash-out refi (75% LTV) — recoverable capital for the next deal without selling this one.
Negotiation context
- It's been on market 36 days — a 3% lower offer ($485k) is reasonable based on typical stale-listing flexibility.
- 9 sale attempts since 31y ago with the ask held roughly flat each time — persistent listings suggest the price (not the market) is what's stuck; bring a comps-based counter.
- Current owner paid $260k; list at $500k implies a 92% gain — meaningful room to come down on a strong offer.
Questions for the listing agent
- What do current leases actually rent for vs. the listed asking? Can we see a recent rent roll and the last 12 months of T-12 income?
- It's been on market 36 days. Have you received any prior offers? Is the seller open to a 56% concession, seller financing, or rate buy-down credit?
- Built in 1966 — when were the roof, HVAC, electrical panel, plumbing, and water heater last replaced?
- Is there a deadline driving the sale (1031 exchange, divorce, estate, relocation)? That informs how much negotiation room exists.
- The area grade is low — what's the realistic commute time and amenity access for the typical tenant pool here? Any planned neighborhood developments (good or bad) we should know about?
- What's the average days-on-market for RENTAL listings here right now (not sales)? A rising rental-DOM trend means longer vacancies and softer asking-rent achievability than the comps imply.
- What's the recent tenant-quality profile in this submarket — average credit score on applications, eviction rate, late-payment / NSF rate, and stable-employment percentage? A property-management company in the area should have these aggregated.
- How much new for-sale + rental construction is in the pipeline within 1–3 miles? Heavy new supply typically softens prices + rents 12–24 months out; constrained supply supports both.
Investment metrics
- 1% rule
- 0.44% ✗
- Cap rate
- 3.01%
- Cash-on-cash
- -11.73%
- DSCR
- 0.48
- GRM
- 18.9
CMA / ARV
- ARV (on-the-fly)
- $329,280
- Comps found
- 3
Show comp detail 3 sales within ~0.75 mi
| Address | Dist | Beds/Ba | Sqft | Sold | Price | $/sf | Match |
|---|---|---|---|---|---|---|---|
| 16 Fair Ln | 0.24mi | 2/1.0 (-1) | 1,120 (0%) | 11mo | $309,900 | $277 | 71 |
| 14 Cherry Dr | 0.43mi | 2/1.0 (-1) | 1,066 (-5%) | 6mo | $320,000 | $300 | 58 |
| 7 Pleasant View Rd | 0.53mi | 2/2.0 (-1) | 1,260 (+12%) | 14mo | $370,000 | $294 | 38 |
Match score weights: distance 35% · size 25% · config 20% · recency 20%. Top-matched comps best support the ARV.
Projected returns pro-forma
10.0% appreciation · 3.0% rent growth · sell at horizon
- IRR
- 16.1%
- Equity multiple
- 2.32×
- Total profit
- $184,966
- Equity at exit
- $450,350
- IRR
- 15.4%
- Equity multiple
- 5.38×
- Total profit
- $612,837
- Equity at exit
- $971,196
Cash invested: $139,972 (down + closing). Projections, not guarantees.
Landlord ↔ Tenant lean methodology
- Overall (STATE)
- 27 Tenant-Leaning
- State Connecticut
- 27 Tenant-Leaning · D+7
- County
- — inherits STATE
- City
- — inherits STATE
ZIP-level market 06784
- Home prices YoY
- 5.1%
- Active inventory
- 43
- Price-to-rent
- 18.9×
Monthly cashflow live
- Estimated rent
- $2,200 medium interval (Pro) →
- Mortgage (P&I)
- −$2,622
- Tax from tax record
- −$276 /mo · $3,311/yr
- Insurance
- −$208
- HOA
- −$0
- Vacancy / Maint / Mgmt
- −$462
- Net cashflow
- $-1,368
Break-even live
UW: 25.0% down · 7.5% · 30yr · 1.5% tax · 5.0% vac · 8.0% maint · 8.0% mgmt
Financing live
Cash to close
- Down payment
- $124,975
- Closing costs
- $14,997
- Reserves months
- —
- Total cash needed
- —
Loan-product check · same deal, 3 products live
Conventional
25% down · 7.5% · 30yr
- Down + closing
- —
- Monthly P&I
- —
- Monthly cashflow
- —
- DSCR
- —
- Eligible?
- —
Personal DTI + credit; lowest rate.
DSCR
20% down · 8.5% · 30yr
- Down + closing
- —
- Monthly P&I
- —
- Monthly cashflow
- —
- DSCR
- —
- Eligible?
- —
No personal income docs; deal must DSCR.
Hard money
10% down · 12.0% · 12mo
- Down + closing
- —
- Monthly P&I
- —
- Monthly cashflow
- —
- DSCR
- —
- Eligible?
- —
Short-term bridge; refi at stabilization.
Rent comps 1 comps
| Address | Beds | Baths | Sqft | Rent | $/sqft | DOM | Units | Dist |
|---|---|---|---|---|---|---|---|---|
| 18 Inglenook Rd New Fairfield, CT | 2.0 | 1.0 | 832 | $2,200 | $2.64 | 23d | 1 | 1.24mi |
Listing history 34 events
-
2026-06-19days on market $499,900 Active 36 DOM
-
2026-06-18days on market $499,900 Active 35 DOM
-
2026-06-17days on market $499,900 Active 34 DOM
-
2026-06-16days on market $499,900 Active 33 DOM
-
2026-06-15days on market $499,900 Active 32 DOM
-
2026-06-14days on market $499,900 Active 30 DOM
-
2026-06-13days on market $499,900 Active 29 DOM
-
2026-06-10days on market $499,900 Active 27 DOM
-
2026-06-09days on market $499,900 Active 26 DOM
-
2026-06-08days on market $499,900 Active 25 DOM
-
2026-06-07days on market $499,900 Active 24 DOM
-
2026-06-02days on market $499,900 Active 19 DOM
-
2026-06-01days on market $499,900 Active 18 DOM
-
2026-05-31days on market $499,900 Active 17 DOM
-
2026-05-30days on market $499,900 Active 16 DOM
-
2026-05-14$499,900 Active
-
2019-07-09historical
-
2019-04-04$299,000 Active
-
2019-03-06historical
-
2019-03-06status Active
-
2019-03-02historical
-
2018-10-06$299,000 Active
-
2012-11-13soldstatus $260,000
-
2012-11-09soldstatus $260,000
-
2012-01-04$269,000
-
2012-01-01historical
-
2011-07-03$299,000
-
1999-07-01soldstatus $164,000
-
1999-02-06$168,000
-
1997-10-29historical
-
1997-05-01$179,000
-
1995-10-26soldstatus $148,000
-
1995-03-08$153,900
-
1992-08-27soldstatus $133,000
ⓘ Source: listings_history table (triggers on properties + properties_extension) + one-shot
backfill from property_details.listing_events for pre-trigger history.
Tax reassessment forecast CT · Partial reset (capped growth)
- Current annual tax
- $3,311 · $276/mo
- Projected year-2 tax
- $7,004 · $584/mo
- Expected delta
- +$3,693/yr (+$308/mo · 111.6%)
ⓘ Screening estimate from a state-policy table — verify with the county assessor before closing.
Climate risk First Street
- Flood 1/10 Low FEMA zone X (unshaded) · 0% chance over 30 yrs
- Wildfire 3/10 Moderate
- Heat 4/10 Moderate 7 d/yr ≥97°F today · 15 d/yr by 30 yrs out
- Wind 4/10 Moderate 19% chance of damaging wind over 30 yrs
- Air quality 3/10 Moderate 2 unhealthy d/yr today · 3 by 30 yrs out
Nearby sold comps map
Loading sold comps map…
Walkable amenities ~0.75 mi
Loading nearby amenities…
Taxation est. · year 1
- Rental income
- $26,400
- − Mortgage interest
- −$28,002
- − Property taxes
- −$3,311
- − Insurance
- −$2,500
- − Repairs & maintenance
- −$2,112
- − Management
- −$2,112
- − Depreciation
- −$14,543
- Taxable loss
- −$26,179
- Est. tax savings @ 24.0%
- +$6,283
- After-tax cash flow
- $-10,130/yr
For passive investors: Depreciation is non-cash, so a rental often shows a tax loss while cash-flowing — sheltering income. Rental losses are passive: they offset passive income freely, and up to $25,000/yr can offset ordinary (W-2) income if you actively participate and your MAGI is under $100k (phasing out to $0 by $150k); unused losses carry forward. On sale, claimed depreciation is recaptured at up to 25%, and gains may owe capital-gains tax (a 1031 exchange can defer both). Figures are a year-1 estimate at your 24.0% rate — not tax advice; consult a CPA.
Schools (NCES district)
- District
- Sherman School District
- NCES district ID
- 0904080
- Math proficiency
- 55% ▬ 0.00%
- Reading proficiency
- 60% ▼ -5.00%
- Median HH income
- $105,552
- Composite
- 56.01/100
- National rank
- #2563
- State rank
- #87 of 192 in CT
Livability — Inglenook
No livability data for this city. (Only ~50 U.S. cities are tracked.)
Census & demographics
- Population (ZIP)
- 3,525
Population outlook (Western Connecticut County) Hauer SSP2
- By 2040
- 685,031
Race, ethnicity, and origin ACS 2023
- Neighborhood character
- Predominantly White (84%)
- Race & ethnicity
- White 84% Two or more races 8% Hispanic / Latino 7%
- Hispanic origin (detail)
- Mexican 1% Puerto Rican 3% Cuban 1%
- Common ancestry
- Romanian 5% Slovak 4% Italian 3%
- Foreign-born
- 8% · Canada, China, Dominican Republic
- Languages at home
- 92% English-only · Spanish 4% Other Indo-European 4%
Political lean MEDSL · Western Connecticut
- 2024 margin
- D (+19.1) · D 58.8% · R 39.7% · Other 1.6%
- All cycles
- 2024: D+19.1
Not yet ingested
- Civics
- —
Market trends
- HPI YoY
- ▲ 13.90%
- Current HPI
- 284.0569
- Rent YoY
- —
- Metro
- —
- State GDP YoY
- ▲ 1.06%
- F500 in state
- 38
Industry mix (Fortune 500 HQ in CT)
| Industry | F500 HQs | Revenue |
|---|---|---|
| Industrial Machinery | 4 | $38B |
|
||
| Insurance | 3 | $71B |
|
||
| Financial Services | 2 | $25B |
|
||
| Transportation / Logistics | 2 | $18B |
|
||
| Healthcare | 1 | $247B |
|
||
| Telecommunications | 1 | $55B |
|
||
Price history
+275.9% since first listed19 events — show timeline
- 2026-05-14 Listed $499,900 Smart MLS
- 2019-07-09 Listing Removed — Smart MLS
- 2019-04-04 Listed $299,000 Smart MLS
- 2019-03-06 Listing Removed — Smart MLS
- 2019-03-06 Relisted — Smart MLS
- 2019-03-02 Listing Removed — Smart MLS
- 2018-10-06 Listed $299,000 Smart MLS
- 2012-11-13 Sold (Public Records) $260,000 Public Records
- 2012-11-09 Sold (MLS) $260,000 Smart MLS
- 2012-01-04 Listed $269,000 Smart MLS
- 2012-01-01 Listing Removed — Smart MLS
- 2011-07-03 Listed $299,000 Smart MLS
- 1999-07-01 Sold (MLS) $164,000 Smart MLS
- 1999-02-06 Listed $168,000 Smart MLS
- 1997-10-29 Listing Removed — Smart MLS
- 1997-05-01 Listed $179,000 Smart MLS
- 1995-10-26 Sold (MLS) $148,000 Smart MLS
- 1995-03-08 Listed $153,900 Smart MLS
- 1992-08-27 Sold (Public Records) $133,000 Public Records
Property tax history
-0.5%/yrLatest (2023): $3,311 · -2.0% YoY. Source: county tax records.
Cash-flow waterfall
monthlySold comps — $/sqft
last 12 mo · ≤1 miLoading sold comps…