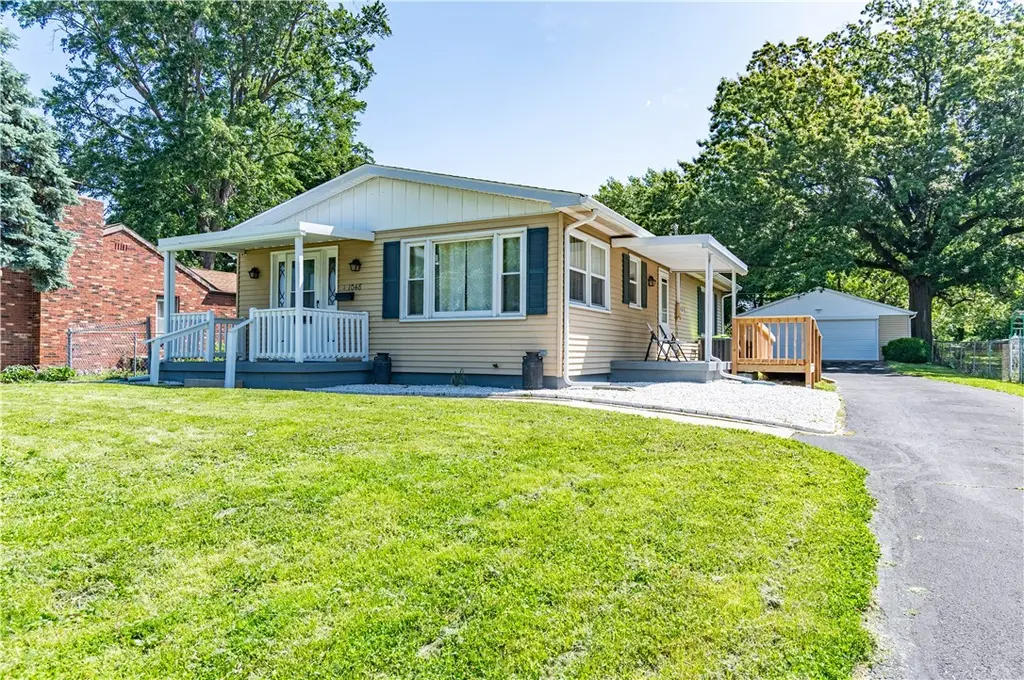
1048 N 35th St · Decatur, IL
Flood risk 1/10 · Minimal
- FEMA flood zone
- X (unshaded)
- Chance of flooding over 30 yrs
- 0.0%
- Est. flood insurance / yr
- $473 – $860
Fire risk 1/10 · Minimal
- Est. fire insurance / yr
- $804 – $1,492
Heat risk 3/10 · Minor
- Hot days now (above 106°F)
- 7 days/yr
- Hot days in 30 yrs
- 18 days/yr
Wind risk 2/10 · Minimal
- Chance of severe wind over 30 yrs
- 2.0%
Air-quality risk 2/10 · Minimal
- Unhealthy air days now
- 1 days/yr
- Unhealthy air days in 30 yrs
- 1 days/yr
Risk factors via First Street. Map © Google.
Why this score? — see what drove the C+ grade
The composite is a weighted blend of 9 inputs, each scored 0–100. Each bar is that input's sub-score; the figure is the points it added to the 100-point composite (weight × sub-score).
- Cash flow +27.8/30.0
- DSCR +9.8/10.0
- 1% rule +8.0/10.0
- ARV discount +7.5/15.0
- Livability +3.0/5.0
- Rent growth +2.5/5.0
- Condition / age +2.5/5.0
- Schools +0.4/10.0
- Appreciation +0.0/10.0
$89,900
🖨 Deal sheet (PDF) 📄 Offer letter ✓ Due diligence
Listing remarks MLS
If you are looking for comfortable living on the east side, check out this house in a quiet neighborhood. A front porch along with a side porch and a back patio offer various options for grilling, entertaining or just enjoying an outside venue. The office can easily be converted into a 3rd bedroom; also two full bathrooms! The appliances stay and it is move-in ready! Check out the updates . .. and make this house a must see. Priced below appraised value!
Key facts
- 9,405 sq ft lot
- 2 garage spots
- Built 1978
Property features AI
Exterior
- Parking: Detached 2-car garage
- Utilities: Public water; Public sewer
- Home design: Single-family residence; One story
- Construction: Aluminum siding; Shingle roof; Built with crawl space foundation
- Exterior features: Asphalt road access; Lot approximately 0.22 acres; R-1 zoning
Interior
- Kitchen: Cooktop; Oven; Range hood
- Bedrooms: Total of 5 rooms (includes bedrooms and living spaces)
- Bathrooms: Two half bathrooms
- Heating & cooling: Natural gas heating with forced air; Central air conditioning
- Interior features: Cooktop; Gas water heater; Oven; Range hood; Crawl space basement
- Laundry & utility: Laundry on the main level
Neighborhood map
What this means for you Summary
Snapshot
- This is a 3-bed/2.0-bath single-family listed at $90k.
Deal economics
- At list price, monthly cash flow is $275 ($3k/yr) — positive.
- The deal already cash-flows at list — no discount required.
- Meets the 1% rule at list price ($1k rent vs $90k).
- Recommended offer: $89k (1.5% below list) — sets the bar for market timing.
- Cap rate 10.0% vs local median 7.0% in Decatur — top-decile yield for the area; either an underpriced asset or a hidden risk that comps aren't pricing in. Stress-test before assuming the spread holds.
Location & tenants
- Location reads 59/100 on livability (#1,076 in IL) — a working-class tenant base; expect higher turnover. Strengths: cost of living A+, housing A+; Watch: crime F, amenities F, commute F.
- Decatur SD 61 (urban): math 3% / reading 6% proficiency, ranked #605 of 620 in IL (top 98%) — low school quality limits family demand, transient renter base, plan for 1-2y turnover; 73% free/reduced lunch — lower-income household profile, screen leases tightly.
- Zoned schools: Stephen Decatur Middle School (math 0% / reading 5%, grade F, #658 of 665 statewide, top 99%, 459 students, 0% FRL) — zoned schools average 0% FRL vs 73% district-wide (73 pts lower); this property's tenant base skews higher-income than the district average.
- Market conditions: 193 active listings in the ZIP; 6 comparable units currently listed for rent nearby; rentals lingering (median 46d on market — plan ~5-8 weeks vacancy on turnover, expect pricing pressure); 50% of comp listings sitting > 30 days — soft ceiling on asking rent; 63 units permitted in Macon County in 2024 (0 in 5+ unit buildings).
Forward outlook
- Local home prices are declining (-3.0%/yr); year-one equity from $622 of loan paydown is wiped out by about $3k of value loss. Plan a longer hold.
- Macon County population projected at -24% by 2050 — secular population decline; favor cash flow + early exit over multi-decade hold.
- At projected returns (-3.0% appreciation + 3.0% rent growth), your $25k cash investment doubles in ~9 years — after that, you're playing with house money.
Negotiation context
- It's been on market 18 days — a 2% lower offer ($89k) is reasonable based on typical stale-listing flexibility.
- 3 sale attempts since 7y ago with the ask held roughly flat each time — persistent listings suggest the price (not the market) is what's stuck; bring a comps-based counter.
- Current owner paid $50k; list at $90k implies a 80% gain — meaningful room to come down on a strong offer.
Questions for the listing agent
- Built in 1978 — when were the roof, HVAC, electrical panel, plumbing, and water heater last replaced?
- Is there a deadline driving the sale (1031 exchange, divorce, estate, relocation)? That informs how much negotiation room exists.
- Schools are F-rated, which usually means shorter tenancies and higher turnover. Who's the typical renter profile here, and what's been the actual vacancy rate?
- Crime grade is F in this area — have there been break-ins, vandalism, or insurance claims at this property in the last 3 years? What carrier currently insures it and at what premium?
- What's the average days-on-market for RENTAL listings here right now (not sales)? A rising rental-DOM trend means longer vacancies and softer asking-rent achievability than the comps imply.
- What's the recent tenant-quality profile in this submarket — average credit score on applications, eviction rate, late-payment / NSF rate, and stable-employment percentage? A property-management company in the area should have these aggregated.
- How much new for-sale + rental construction is in the pipeline within 1–3 miles? Heavy new supply typically softens prices + rents 12–24 months out; constrained supply supports both.
Investment metrics
- 1% rule
- 1.30% ✓
- Cap rate
- 9.97%
- Cash-on-cash
- 13.13%
- DSCR
- 1.58
- GRM
- 6.4
CMA / ARV
- ARV (on-the-fly)
- $45,408
- Comps found
- 5
Show comp detail 5 sales within ~0.75 mi
| Address | Dist | Beds/Ba | Sqft | Sold | Price | $/sf | Match |
|---|---|---|---|---|---|---|---|
| 3948 E Grand Ave | 0.57mi | 3/1.0 | 1,006 (-5%) | 4mo | $87,900 | $87 | 59 |
| 464 N 33rd St | 0.44mi | 2/1.0 (-1) | 981 (-7%) | 2mo | $103,000 | $105 | 57 |
| 1790 N 34th St | 0.62mi | 3/1.0 | 1,040 (-2%) | 13mo | $45,000 | $43 | 53 |
| 333 N 35th St | 0.53mi | 3/1.0 | 1,120 (+6%) | 13mo | $45,000 | $40 | 50 |
| 1724 33rd St | 0.72mi | 3/1.0 | 1,064 (+1%) | 14mo | $7,500 | $7 | 50 |
Match score weights: distance 35% · size 25% · config 20% · recency 20%. Top-matched comps best support the ARV.
Projected returns pro-forma
-3.0% appreciation · 3.0% rent growth · sell at horizon
- IRR
- 3.1%
- Equity multiple
- 1.12×
- Total profit
- $3,006
- Equity at exit
- $13,404
- IRR
- 12.7%
- Equity multiple
- 2.01×
- Total profit
- $25,339
- Equity at exit
- $7,773
Cash invested: $25,172 (down + closing). Projections, not guarantees.
Landlord ↔ Tenant lean methodology
- Overall (STATE)
- 43 Moderately Tenant-Leaning
- State Illinois
- 43 Moderately Tenant-Leaning · D+7
- County
- — inherits STATE
- City
- — inherits STATE
ZIP-level market 62521
- Home prices YoY
- -9.0%
- Active inventory
- 193
- Price-to-rent
- 6.4×
Monthly cashflow live
- Estimated rent
- $1,168 high interval (Pro) →
- Mortgage (P&I)
- −$471
- Tax from tax record
- −$138 /mo · $1,658/yr
- Insurance
- −$37
- HOA
- −$0
- Vacancy / Maint / Mgmt
- −$245
- Net cashflow
- $275
Break-even live
Sensitivity live
| Price | -10% $326 | -5% $301 | +0% $275 | +5% $250 | +10% $225 |
|---|---|---|---|---|---|
| Rent | -10% $183 | -5% $229 | +0% $275 | +5% $322 | +10% $368 |
| Rate | -1.0pp $321 | -0.5pp $298 | base $275 | +0.5pp $252 | +1.0pp $228 |
UW: 25.0% down · 7.5% · 30yr · 1.5% tax · 5.0% vac · 8.0% maint · 8.0% mgmt
Financing live
Cash to close
- Down payment
- $22,475
- Closing costs
- $2,697
- Reserves months
- —
- Total cash needed
- —
Loan-product check · same deal, 3 products live
Conventional
25% down · 7.5% · 30yr
- Down + closing
- —
- Monthly P&I
- —
- Monthly cashflow
- —
- DSCR
- —
- Eligible?
- —
Personal DTI + credit; lowest rate.
DSCR
20% down · 8.5% · 30yr
- Down + closing
- —
- Monthly P&I
- —
- Monthly cashflow
- —
- DSCR
- —
- Eligible?
- —
No personal income docs; deal must DSCR.
Hard money
10% down · 12.0% · 12mo
- Down + closing
- —
- Monthly P&I
- —
- Monthly cashflow
- —
- DSCR
- —
- Eligible?
- —
Short-term bridge; refi at stabilization.
Rent comps 6 comps
| Address | Beds | Baths | Sqft | Rent | $/sqft | DOM | Units | Dist |
|---|---|---|---|---|---|---|---|---|
| 1635 N 28th St Decatur, IL | 3.0 | 1.0 | 1200 | $1,200 | $1.00 | 46d | 1 | 0.90mi |
| 2448 E Wood St Decatur, IL | 3.0 | 1.0 | 800 | $995 | $1.24 | 15d | 1 | 1.09mi |
| 2618 E Garfield Ave Decatur, IL | 2.0 | 1.5 | 1170 | $650 | $0.56 | 15d | 1 | 1.13mi |
| 4318 E Cantrell St Decatur, IL | 2.0 | 1.0 | 850 | $1,500 | $1.76 | 23d | 1 | 1.38mi |
| 2135 E Prairie St Decatur, IL | 2.0 | 1.0 | 1127 | $1,100 | $0.98 | 46d | 1 | 1.43mi |
| 2032 E North St Decatur, IL | 2.0 | 1.0 | 754 | $900 | $1.19 | 46d | 1 | 1.44mi |
Listing history 14 events
-
2026-06-09status $89,900 Pending 18 DOM
-
2026-06-08days on market $89,900 Active Under Contract 18 DOM
-
2026-06-07days on market $89,900 Active Under Contract 17 DOM
-
2026-06-05days on market $89,900 Active Under Contract 14 DOM
-
2026-06-02days on market $89,900 Active Under Contract 12 DOM
-
2026-06-01days on market $89,900 Active Under Contract 11 DOM
-
2026-05-31days on market $89,900 Active Under Contract 10 DOM
-
2026-05-30days on market $89,900 Active Under Contract 9 DOM
-
2026-05-21$89,900 Active
-
2019-12-26soldstatus $50,000
-
2019-12-23soldstatus $50,000 458-char remark
Show marketing remark (458 chars)
If you are looking for comfortable living on the east side, check out this house in a quiet neighborhood. A front porch along with a side porch and a back patio offer various options for grilling, entertaining or just enjoying an outside venue. The office can easily be converted into a 3rd bedroom; also two full bathrooms! The appliances stay and it is move-in ready! Check out the updates . .. and make this house a must see. Priced below appraised value!
-
2019-08-09
Show marketing remark (458 chars)
If you are looking for comfortable living on the east side, check out this house in a quiet neighborhood. A front porch along with a side porch and a back patio offer various options for grilling, entertaining or just enjoying an outside venue. The office can easily be converted into a 3rd bedroom; also two full bathrooms! The appliances stay and it is move-in ready! Check out the updates . .. and make this house a must see. Priced below appraised value!
-
2019-08-09$60,000 458-char remark
Show marketing remark (458 chars)
If you are looking for comfortable living on the east side, check out this house in a quiet neighborhood. A front porch along with a side porch and a back patio offer various options for grilling, entertaining or just enjoying an outside venue. The office can easily be converted into a 3rd bedroom; also two full bathrooms! The appliances stay and it is move-in ready! Check out the updates . .. and make this house a must see. Priced below appraised value!
-
2007-01-08soldstatus $55,000
ⓘ Source: listings_history table (triggers on properties + properties_extension) + one-shot
backfill from property_details.listing_events for pre-trigger history.
Tax reassessment forecast IL · Partial reset (capped growth)
- Current annual tax
- $1,658 · $138/mo
- Projected year-2 tax
- $1,849 · $154/mo
- Expected delta
- +$191/yr (+$16/mo · 11.5%)
ⓘ Screening estimate from a state-policy table — verify with the county assessor before closing.
Climate risk First Street
- Flood 1/10 Low FEMA zone X (unshaded) · 0% chance over 30 yrs
- Wildfire 1/10 Low
- Heat 3/10 Moderate 7 d/yr ≥106°F today · 18 d/yr by 30 yrs out
- Wind 2/10 Low 2% chance of damaging wind over 30 yrs
- Air quality 2/10 Low 1 unhealthy d/yr today · 1 by 30 yrs out
Nearby sold comps map
Loading sold comps map…
Walkable amenities ~0.75 mi
Loading nearby amenities…
Taxation est. · year 1
- Rental income
- $14,012
- − Mortgage interest
- −$5,036
- − Property taxes
- −$1,658
- − Insurance
- −$450
- − Repairs & maintenance
- −$1,121
- − Management
- −$1,121
- − Depreciation
- −$2,615
- Taxable income
- $2,012
- Est. tax owed @ 24.0%
- −$483
- After-tax cash flow
- $2,822/yr
For passive investors: Depreciation is non-cash, so a rental often shows a tax loss while cash-flowing — sheltering income. Rental losses are passive: they offset passive income freely, and up to $25,000/yr can offset ordinary (W-2) income if you actively participate and your MAGI is under $100k (phasing out to $0 by $150k); unused losses carry forward. On sale, claimed depreciation is recaptured at up to 25%, and gains may owe capital-gains tax (a 1031 exchange can defer both). Figures are a year-1 estimate at your 24.0% rate — not tax advice; consult a CPA.
Schools (NCES district)
- District
- Decatur SD 61
- NCES district ID
- 1711850
- Math proficiency
- 3% ▼ -4.00%
- Reading proficiency
- 6% ▼ -6.00%
- Median HH income
- $38,864
- Composite
- 3.99/100
- National rank
- #10059
- State rank
- #605 of 620 in IL
Livability — Decatur
- Score
- 59/100
- State rank
- #1076
- US rank
- #20533
Category grades
Schools grade is shown separately in the Schools card above.
Census & demographics
- Census place
- Decatur, IL
- County
- Macon County · 78,333 people
- City population
- 78,333
- Metro
- Decatur, IL
- Population (ZIP)
- 32,665
- Household income
- $66,337
- Rent vs Own
- Severe rent burden
- 640.0
Population outlook (Macon County) Hauer SSP2
- Today (2025)
- 99,568 people
- By 2030
- 94,973 · -4.6%
- By 2040
- 85,250 · -14.4%
- By 2050
- 75,920 · -23.8%
- By 2075
- 55,962 · -43.8%
- By 2100
- 36,468 · -63.4%
Race, ethnicity, and origin ACS 2023
- Neighborhood character
- Predominantly White (75%)
- Race & ethnicity
- White 75% Black 17% Two or more races 5% Hispanic / Latino 3%
- Common ancestry
- Slovak 3% Romanian 2% Lithuanian 2%
- Foreign-born
- 3% · Canada
- Languages at home
- 96% English-only · Spanish 2% Russian/Polish/Slavic 1% Other Indo-European 0%
Political lean MEDSL · Macon
- 2024 margin
- R (+18.9) · D 39.8% · R 58.7% · Other 1.4%
- 2008→2024 swing
- -20.0pp toward R · 2008: 1.1pp · 2024: -18.9pp
- All cycles
- 2024: R+18.9 2020: R+17.7 2016: R+18.1 2012: R+5.2 2008: D+1.1
Not yet ingested
- Civics
- —
Market trends
- HPI YoY
- ▼ -17.96%
- Current HPI
- 180.9274
- Rent YoY
- —
- Metro
- Decatur, IL
- State GDP YoY
- ▲ 1.59%
- F500 in state
- 60
Industry mix (Fortune 500 HQ in IL)
| Industry | F500 HQs | Revenue |
|---|---|---|
| Insurance | 4 | $201B |
|
||
| Consumer Goods | 4 | $87B |
|
||
| Industrial Machinery | 3 | $64B |
|
||
| Healthcare | 2 | $55B |
|
||
| Retail / Pharmacy | 1 | $148B |
|
||
| Agriculture / Food | 1 | $86B |
|
||
Price history
+63.5% since first listed8 events — show timeline
- 2026-06-08 Pending — CIBR
- 2026-05-23 Contingent — CIBR
- 2026-05-21 Listed $89,900 CIBR
- 2019-12-26 Sold (Public Records) $50,000 Public Records
- 2019-12-23 Sold (MLS) $50,000 CIBR
- 2019-08-09 Listed — MRED as Distributed by MLS Grid
- 2019-08-09 Listed $60,000 CIBR
- 2007-01-08 Sold (Public Records) $55,000 Public Records
Property tax history
+1.5%/yrLatest (2019): $1,658 · +2.5% YoY. Source: county tax records.
Cash-flow waterfall
monthlySold comps — $/sqft
last 12 mo · ≤1 miLoading sold comps…