1661 Old Country Rd #353 · Calverton, NY
Flood risk No data
- FEMA flood zone
- —
- Chance of flooding over 30 yrs
- —
- Est. flood insurance / yr
- —
Fire risk No data
- Est. fire insurance / yr
- —
Heat risk No data
- Hot days now (above threshold)
- —
- Hot days in 30 yrs
- —
Wind risk No data
- Chance of severe wind over 30 yrs
- —
Air-quality risk No data
- Unhealthy air days now
- —
- Unhealthy air days in 30 yrs
- —
Risk factors via First Street. Map © Google.
Why this score? — see what drove the B+ grade
The composite is a weighted blend of 9 inputs, each scored 0–100. Each bar is that input's sub-score; the figure is the points it added to the 100-point composite (weight × sub-score).
- Cash flow +30.0/30.0
- ARV discount +13.5/15.0
- 1% rule +10.0/10.0
- DSCR +10.0/10.0
- Schools +3.6/10.0
- Livability +2.9/5.0
- Rent growth +2.5/5.0
- Condition / age +2.5/5.0
- Appreciation +0.0/10.0
$365,000
🖨 Deal sheet 📄 Offer letter ✓ Due diligence
Listing remarks
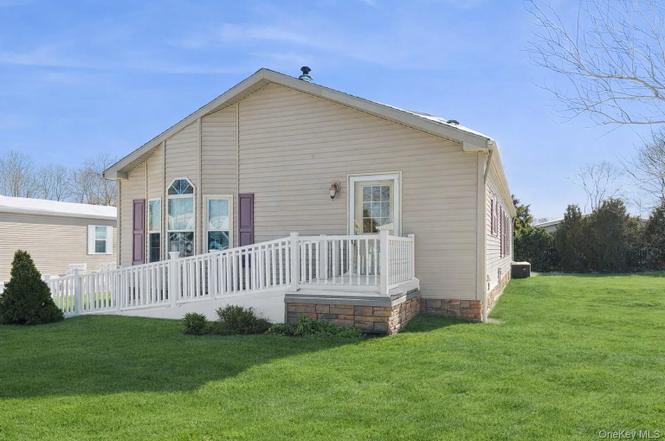
Beautifully maintained 3-bedroom, 2-bath home in a desirable 55+ community in the heart of Riverhead. Features include a spacious primary suite with ensuite bath and soaking tub, generously sized two additional bedrooms, and a move-in-ready open-concept layout ideal for entertaining. Well-appointed kitchen, separate laundry room, welcoming front porch, central air, and storage shed. Community amenities include pool, clubhouse, and fitness center. Close to shopping, dining, everyday conveniences, and the gateway to the North Fork- rare opportunity in a central location.
Key facts
- Soaking tub
- Primary suite
- Ensuite bath
Tags
Property features AI
Finance
- Other: Living area reported from plans
- HOA & community: Community association (Hometown America); Monthly association fee of $800; Association covers common area maintenance, pool service, sewer, trash and water; Community amenities include clubhouse, fitness center, pool, and snow removal; Senior community
Exterior
- Parking: Private parking for 2 vehicles; No carport
- Utilities: Electric service by PSEG; Propane available; Cable connected; Shared sewer service
- Home design: Double wide manufactured home; Single-story (one level)
- Construction: Vinyl siding construction
- Exterior features: Vinyl siding; Shed(s); Community pool
Interior
- Kitchen: Dishwasher; Microwave; Oven; Range; Refrigerator; Freezer
- Bedrooms: One-level home with bedrooms on the main floor
- Bathrooms: 2 full bathrooms
- Heating & cooling: Central air conditioning; Forced air heating; Kerosene heating
- Interior features: First-floor bedroom; First-floor full bathroom; Ceiling fans; Chef's kitchen; Open floor plan; Open kitchen; Primary bathroom; Soaking tub; Covered porch
- Laundry & utility: Laundry room with washer and dryer
Neighborhood map
What this means for you Summary
Snapshot
- This is a 3-bed/2.0-bath single-family listed at $365k.
Deal economics
- At list price, monthly cash flow is $4k ($45k/yr) — positive.
- The deal already cash-flows at list — no discount required.
- Meets the 1% rule at list price ($9k rent vs $365k).
- Recommended offer: $343k (6.0% below list) — sets the bar for market timing.
- Cap rate 18.7% vs local median 7.2% in Calverton — top-decile yield for the area; either an underpriced asset or a hidden risk that comps aren't pricing in. Stress-test before assuming the spread holds.
Location & tenants
- Location reads 58/100 on livability (#1,053 in NY) — a working-class tenant base; expect higher turnover. Watch: crime C-, employment D, amenities F.
- Riverhead Central School District (suburban): math 34% / reading 48% proficiency, ranked #489 of 590 in NY (top 83%) — families likely to look elsewhere, expect single-tenant / working-renter base with shorter leases.
- Zoned schools: Aquebogue Elementary School (math 47% / reading 57%, grade C-, #988 of 2,108 statewide, top 49%, 474 students, 40% FRL); Riverhead Middle School (math 18% / reading 35%, grade F, #594 of 729 statewide, top 81%, 827 students, 57% FRL); Riverhead Senior High School (math 80% / reading 86%, grade A, #440 of 1,100 statewide, top 40%, 2,001 students, 52% FRL).
- Zoned-school proficiency averages 54% at this address vs 41% district-wide (+13 pts) — the actual schools serving this property are materially stronger than the Riverhead Central School District average implies; a family-tenant draw the district grade alone would hide.
- Market conditions: 188 active listings in the ZIP; 1 comparable units currently listed for rent nearby; 1,366 units permitted in Suffolk County in 2024 (216 in 5+ unit buildings).
Forward outlook
- Local home prices are declining (-3.0%/yr); year-one equity from $3k of loan paydown is wiped out by about $11k of value loss. Plan a longer hold.
- Suffolk County population projected to shrink 5% by 2050 — rents likely to lag national; underwrite the cash flow, not the appreciation.
- At projected returns (-3.0% appreciation + 3.0% rent growth), your $102k cash investment doubles in ~3 years — after that, you're playing with house money.
Negotiation context
- It's been on market 84 days — a 6% lower offer ($343k) is reasonable based on typical stale-listing flexibility.
Questions for the listing agent
- It's been on market 84 days. Have you received any prior offers? Is the seller open to a 6% concession, seller financing, or rate buy-down credit?
- What does the HOA fee cover, when was the last increase, and are there any pending special assessments or reserve-fund shortfalls?
- Why hasn't it sold? Are there any deal-killer items the seller is aware of (foundation, flood, title, zoning, code violations)?
- Is there a deadline driving the sale (1031 exchange, divorce, estate, relocation)? That informs how much negotiation room exists.
- Schools are D-rated, which usually means shorter tenancies and higher turnover. Who's the typical renter profile here, and what's been the actual vacancy rate?
- What's the average days-on-market for RENTAL listings here right now (not sales)? A rising rental-DOM trend means longer vacancies and softer asking-rent achievability than the comps imply.
- What's the recent tenant-quality profile in this submarket — average credit score on applications, eviction rate, late-payment / NSF rate, and stable-employment percentage? A property-management company in the area should have these aggregated.
- How much new for-sale + rental construction is in the pipeline within 1–3 miles? Heavy new supply typically softens prices + rents 12–24 months out; constrained supply supports both.
Investment metrics
- 1% rule
- 2.47% ✓
- Cap rate
- 18.75%
- Cash-on-cash
- 44.47%
- DSCR
- 2.98
- GRM
- 3.4
CMA / ARV
- ARV (on-the-fly)
- $421,223
- Comps found
- 6
Show comp detail 6 sales within ~0.75 mi
| Address | Dist | Beds/Ba | Sqft | Sold | Price | $/sf | Match |
|---|---|---|---|---|---|---|---|
| 1661-544 Old Country Rd | 0.05mi | 3/2.0 | 1,600 (-2%) | 24mo | $365,000 | $228 | 74 |
| 1661-570 Old Country Rd | 0.00mi | 2/2.0 (-1) | 1,736 (+6%) | 16mo | $445,500 | $257 | 72 |
| 1661-530 Old Country Rd | 0.00mi | 2/2.0 (-1) | 1,736 (+6%) | 19mo | $385,000 | $222 | 69 |
| 11 Industrial Blvd | 0.58mi | 4/2.0 (+1) | 1,500 (-8%) | 5mo | $620,000 | $413 | 50 |
| 1661-340 Old Country Rd | 0.20mi | 3/3.0 | 1,855 (+13%) | 20mo | $405,000 | $218 | 48 |
| 1443 W Main St | 0.59mi | 2/1.0 (-1) | 1,500 (-8%) | 17mo | $505,000 | $337 | 35 |
Match score weights: distance 35% · size 25% · config 20% · recency 20%. Top-matched comps best support the ARV.
Projected returns pro-forma
-3.0% appreciation · 3.0% rent growth · sell at horizon
- IRR
- 41.6%
- Equity multiple
- 2.79×
- Total profit
- $182,714
- Equity at exit
- $54,423
- IRR
- 47.8%
- Equity multiple
- 5.62×
- Total profit
- $472,278
- Equity at exit
- $31,559
Cash invested: $102,200 (down + closing). Projections, not guarantees.
Landlord ↔ Tenant lean methodology
- Overall (STATE)
- 15 Strongly Tenant-Friendly
- State New York
- 15 Strongly Tenant-Friendly · D+10
- County
- — inherits STATE
- City
- — inherits STATE
ZIP-level market 11901
- Home prices YoY
- -29.5%
- Active inventory
- 188
- Price-to-rent
- 3.4×
Monthly cashflow live
- Estimated rent
- $9,000 medium interval (Pro) →
- Mortgage (P&I)
- −$1,914
- Tax est. 1.5%
- −$456 /mo · $5,475/yr
- Insurance
- −$152
- HOA
- −$800
- Vacancy / Maint / Mgmt
- −$1,890
- Net cashflow
- $3,788
Break-even live
UW: 25.0% down · 7.5% · 30yr · 1.5% tax · 5.0% vac · 8.0% maint · 8.0% mgmt
Financing live
Cash to close
- Down payment
- $91,250
- Closing costs
- $10,950
- Reserves months
- —
- Total cash needed
- —
Loan-product check · same deal, 3 products live
Conventional
25% down · 7.5% · 30yr
- Down + closing
- —
- Monthly P&I
- —
- Monthly cashflow
- —
- DSCR
- —
- Eligible?
- —
Personal DTI + credit; lowest rate.
DSCR
20% down · 8.5% · 30yr
- Down + closing
- —
- Monthly P&I
- —
- Monthly cashflow
- —
- DSCR
- —
- Eligible?
- —
No personal income docs; deal must DSCR.
Hard money
10% down · 12.0% · 12mo
- Down + closing
- —
- Monthly P&I
- —
- Monthly cashflow
- —
- DSCR
- —
- Eligible?
- —
Short-term bridge; refi at stabilization.
Rent comps 1 comps
| Address | Beds | Baths | Sqft | Rent | $/sqft | DOM | Units | Dist |
|---|---|---|---|---|---|---|---|---|
| 19 Kroemer Ave Riverhead, NY | 4.0 | 2.0 | 2000 | $9,000 | $4.50 | 1d | 1 | 0.74mi |
HOA detail
- Monthly dues
- $800 · $9,600/yr
- Likely covers
- poolgym
Listing history 5 events
-
2026-04-27status Pending
-
2026-03-31price $365,000
-
2026-02-24price $374,999
-
2026-02-07price $405,000
-
2026-01-31$439,000 Active
ⓘ Source: listings_history table (triggers on properties + properties_extension) + one-shot
backfill from property_details.listing_events for pre-trigger history.
Nearby sold comps map
Loading sold comps map…
Walkable amenities ~0.75 mi
Loading nearby amenities…
Taxation est. · year 1
- Rental income
- $108,000
- − Mortgage interest
- −$20,446
- − Property taxes
- −$5,475
- − Insurance
- −$1,825
- − Repairs & maintenance
- −$8,640
- − Management
- −$8,640
- − HOA
- −$9,600
- − Depreciation
- −$10,618
- Taxable income
- $42,756
- Est. tax owed @ 24.0%
- −$10,261
- After-tax cash flow
- $35,189/yr
For passive investors: Depreciation is non-cash, so a rental often shows a tax loss while cash-flowing — sheltering income. Rental losses are passive: they offset passive income freely, and up to $25,000/yr can offset ordinary (W-2) income if you actively participate and your MAGI is under $100k (phasing out to $0 by $150k); unused losses carry forward. On sale, claimed depreciation is recaptured at up to 25%, and gains may owe capital-gains tax (a 1031 exchange can defer both). Figures are a year-1 estimate at your 24.0% rate — not tax advice; consult a CPA.
Schools (NCES district)
- District
- Riverhead Central School District
- NCES district ID
- 3624690
- Math proficiency
- 34% ▼ -4.00%
- Reading proficiency
- 48% ▲ 13.00%
- Median HH income
- $61,607
- Composite
- 36.38/100
- National rank
- #4683
- State rank
- #489 of 590 in NY
Livability — Calverton
- Score
- 58/100
- State rank
- #1053
- US rank
- #20908
Category grades
Schools grade is shown separately in the Schools card above.
Census & demographics
- Census place
- Calverton, NY
- City population
- 6,784
- Population (ZIP)
- 32,921
Population outlook (Suffolk County) Hauer SSP2
- Today (2025)
- 1,505,262 people
- By 2030
- 1,498,318 · -0.5%
- By 2040
- 1,471,101 · -2.3%
- By 2050
- 1,424,848 · -5.3%
- By 2075
- 1,337,157 · -11.2%
- By 2100
- 1,217,720 · -19.1%
Race, ethnicity, and origin ACS 2023
- Neighborhood character
- Diverse neighborhood (Simpson 0.63)
- Race & ethnicity
- White 52% Hispanic / Latino 29% Two or more races 14% Black 11% Asian 3%
- Hispanic origin (detail)
- Mexican 4%
- Common ancestry
- Romanian 8% Iranian 1% Portuguese 1%
- Foreign-born
- 25% · Canada, Jamaica
- Languages at home
- 68% English-only · Spanish 26% Other Indo-European 3% Russian/Polish/Slavic 2%
Political lean MEDSL · Suffolk
- 2024 margin
- Lean R (+10.0) · D 45.0% · R 55.0%
- 2008→2024 swing
- -16.0pp toward R · 2008: 6.0pp · 2024: -10.0pp
- All cycles
- 2024: R+10.0 2020: R+0.0 2016: R+8.2 2012: D+2.9 2008: D+6.0
Not yet ingested
- Civics
- —
Market trends
- HPI YoY
- ▼ -182.60%
- Current HPI
- 436.7781
- Rent YoY
- —
- Metro
- —
- State GDP YoY
- ▲ 2.60%
- F500 in state
- 92
Industry mix (Fortune 500 HQ in NY)
| Industry | F500 HQs | Revenue |
|---|---|---|
| Financial Services | 10 | $950B |
|
||
| Consumer Goods | 9 | $162B |
|
||
| Insurance | 4 | $225B |
|
||
| Telecommunications | 2 | $144B |
|
||
| Pharmaceuticals | 2 | $112B |
|
||
| Media / Entertainment | 2 | $69B |
|
||
Price history
-16.9% since first listed5 events — show timeline
- 2026-04-27 Pending — OneKey® MLS as Distributed by MLS Grid
- 2026-03-31 Price Changed $365,000 OneKey® MLS as Distributed by MLS Grid
- 2026-02-24 Price Changed $374,999 OneKey® MLS as Distributed by MLS Grid
- 2026-02-07 Price Changed $405,000 OneKey® MLS as Distributed by MLS Grid
- 2026-01-31 Listed $439,000 OneKey® MLS as Distributed by MLS Grid
Cash-flow waterfall
monthlySold comps — $/sqft
last 12 mo · ≤1 miLoading sold comps…