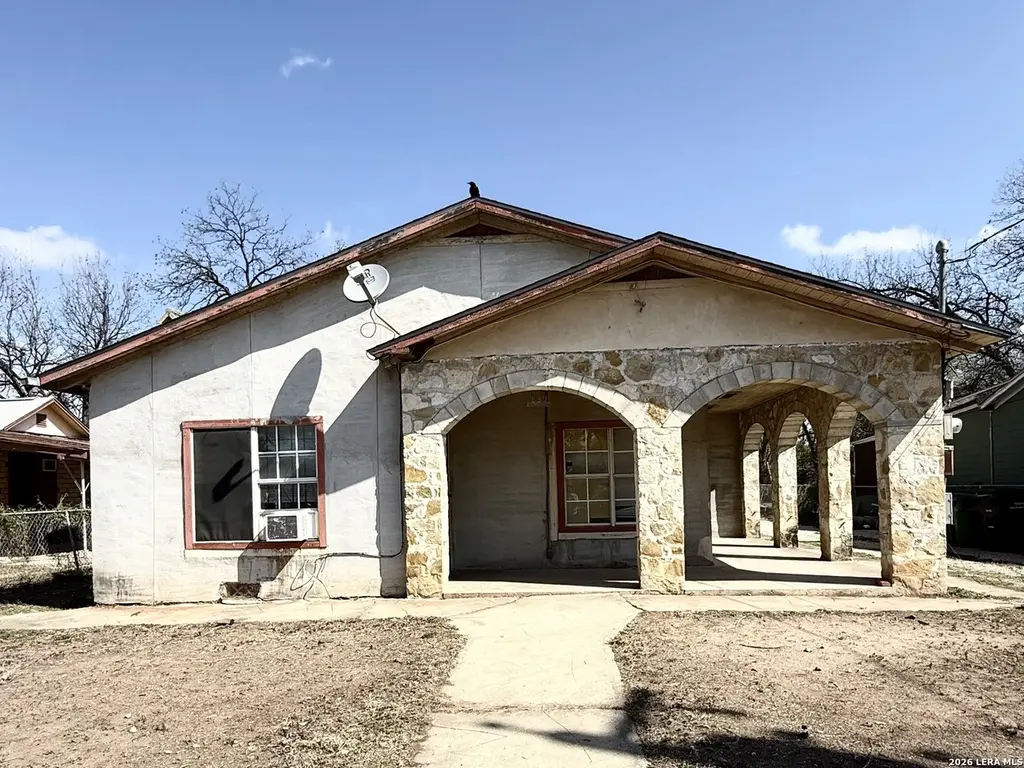
339 Ceralvo · San Antonio, TX
Flood risk 1/10 · Minimal
- FEMA flood zone
- X (unshaded)
- Chance of flooding over 30 yrs
- 0.0%
- Est. flood insurance / yr
- $507 – $1,088
Fire risk 1/10 · Minimal
- Est. fire insurance / yr
- $1,222 – $2,270
Heat risk 8/10 · Major
- Hot days now (above 109°F)
- 7 days/yr
- Hot days in 30 yrs
- 22 days/yr
Wind risk 8/10 · Major
- Chance of severe wind over 30 yrs
- 80.0%
Air-quality risk 2/10 · Minimal
- Unhealthy air days now
- 1 days/yr
- Unhealthy air days in 30 yrs
- 2 days/yr
Risk factors via First Street. Map © Google.
Why this score? — see what drove the C+ grade
The composite is a weighted blend of 9 inputs, each scored 0–100. Each bar is that input's sub-score; the figure is the points it added to the 100-point composite (weight × sub-score).
- Cash flow +21.8/30.0
- Appreciation +10.0/10.0
- 1% rule +7.3/10.0
- DSCR +7.0/10.0
- Rent growth +4.4/5.0
- Livability +4.0/5.0
- Condition / age +2.5/5.0
- ARV discount +2.2/15.0
- Schools +1.4/10.0
$99,500
🖨 Deal sheet 📄 Offer letter ✓ Due diligence
Listing remarks MLS
Great opportunity for investors or buyers ready to add their personal touch! This property is being sold AS IS and offers incredible potential as an investment property or a primary residence with some updates and repairs. The home sits on a large lot with a mature pecan tree, providing shade and plenty of outdoor space. A standout feature is the detached additional building with plumbing, offering endless possibilities-workshop, guest space, rental potential, or studio. Located just minutes from Downtown San Antonio with quick access to major expressways, this property combines convenience with opportunity. Don't miss the chance to transform this property into something special!
Key facts
- Large lot
- Mature pecan tree
- Outdoor space
Tags
Neighborhood map
What this means for you Summary
Snapshot
- This is a 2-bed/1.0-bath single-family listed at $100k.
Deal economics
- At list price, monthly cash flow is $155 ($2k/yr) — positive.
- The deal already cash-flows at list — no discount required.
- Meets the 1% rule at list price ($1k rent vs $100k).
- Recommended offer: $94k (6.0% below list) — sets the bar for market timing.
- Cap rate 8.2% vs local median 3.8% in San Antonio — top-decile yield for the area; either an underpriced asset or a hidden risk that comps aren't pricing in. Stress-test before assuming the spread holds.
Location & tenants
- Location reads 80/100 on livability (#31 in TX, #1,616 nationally) — a professional / high-income tenant draw. Strengths: amenities A+, commute A+, cost of living A+; Watch: schools C-, crime F.
- San Antonio ISD (urban): math 12% / reading 22% proficiency, ranked #805 of 826 in TX (top 98%) — low school quality limits family demand, transient renter base, plan for 1-2y turnover; 80% free/reduced lunch — lower-income household profile, screen leases tightly.
- Market conditions: Rents rising fast (+7.7%/yr); 154 active listings in the ZIP; 40 comparable units currently listed for rent nearby; rentals at typical pace (median 18d on market — plan ~3-4 weeks tenant-placement turnaround); lower-income renter base — watch delinquency; 8,308 units permitted in Bexar County in 2024 (2,506 in 5+ unit buildings).
- At $1,220/mo this rent would consume 45% of the median local household income ($32k/yr) (locally 2789% of renters already pay >50% of income on rent) — very limited rent-growth headroom before tenants either downsize or default.
Forward outlook
- In year one you build about $11k of equity ($688 loan paydown + $10k appreciation (10.0% local appreciation)).
- Bexar County population projected at +50% by 2050 — long-run rental-demand tailwind backs the buy-and-hold thesis.
- At projected returns (10.0% appreciation + 7.7% rent growth), your $28k cash investment doubles in ~3 years — after that, you're playing with house money.
- By year 4, paydown + projected appreciation supports a ~$38k cash-out refi (75% LTV) — recoverable capital for the next deal without selling this one.
Negotiation context
- It's been on market 82 days — a 6% lower offer ($94k) is reasonable based on typical stale-listing flexibility.
Risks & watch-outs
- Watch-outs: property tax is 3.0% of price; built in 1945 — expect roof / HVAC / electrical / plumbing capex.
- Climate carrying-cost: severe wind risk, 80% chance of damaging wind over 30y; extreme-heat days projected 7→22/yr by 2055 (HVAC capex compounding) — expect insurance premiums to compound above CPI over the hold.
Questions for the listing agent
- It's been on market 82 days. Have you received any prior offers? Is the seller open to a 6% concession, seller financing, or rate buy-down credit?
- Built in 1945 — when were the roof, HVAC, electrical panel, plumbing, and water heater last replaced?
- Property tax is high relative to price — has the assessment been appealed recently, and will the sale trigger a re-assessment?
- Why hasn't it sold? Are there any deal-killer items the seller is aware of (foundation, flood, title, zoning, code violations)?
- Is there a deadline driving the sale (1031 exchange, divorce, estate, relocation)? That informs how much negotiation room exists.
- Crime grade is F in this area — have there been break-ins, vandalism, or insurance claims at this property in the last 3 years? What carrier currently insures it and at what premium?
- What's the average days-on-market for RENTAL listings here right now (not sales)? A rising rental-DOM trend means longer vacancies and softer asking-rent achievability than the comps imply.
- What's the recent tenant-quality profile in this submarket — average credit score on applications, eviction rate, late-payment / NSF rate, and stable-employment percentage? A property-management company in the area should have these aggregated.
- How much new for-sale + rental construction is in the pipeline within 1–3 miles? Heavy new supply typically softens prices + rents 12–24 months out; constrained supply supports both.
Investment metrics
- 1% rule
- 1.23% ✓
- Cap rate
- 8.16%
- Cash-on-cash
- 6.68%
- DSCR
- 1.30
- GRM
- 6.8
CMA / ARV
- ARV (median comp)
- $89,012
- List price
- $99,500
- Delta
- 11.78%
- Verdict
- OVERPRICED
- Comps
- 20 within 1.0 mi
Show comp detail 12 sales within ~0.75 mi
| Address | Dist | Beds/Ba | Sqft | Sold | Price | $/sf | Match |
|---|---|---|---|---|---|---|---|
| 102 Noria | 0.08mi | 2/1.0 | 694 (-8%) | 2mo | $49,900 | $72 | 82 |
| 235 Noria St | 0.14mi | 3/1.0 (+1) | 728 (-3%) | 4mo | $130,000 | $179 | 80 |
| 227 Noria St | 0.13mi | 2/1.0 | 696 (-7%) | 4mo | $55,000 | $79 | 79 |
| 206 Mercedes | 0.17mi | 2/1.0 | 809 (+8%) | 2mo | $87,500 | $108 | 78 |
| 410 Ceralvo | 0.07mi | 2/1.0 | 672 (-10%) | 7mo | $84,999 | $126 | 73 |
| 350 Madero | 0.39mi | 2/1.0 | 674 (-10%) | 10mo | $39,900 | $59 | 56 |
| 360 Madero St | 0.41mi | 2/1.0 | 680 (-10%) | 13mo | $100,000 | $147 | 54 |
| 305 Jean St | 0.41mi | 3/1.0 (+1) | 825 (+10%) | 9mo | $199,999 | $242 | 52 |
| 634 Drake | 0.45mi | 2/1.0 | 840 (+12%) | 10mo | $125,000 | $149 | 51 |
| 315 Jean St | 0.41mi | 3/1.5 (+1) | 841 (+12%) | 5mo | $139,998 | $166 | 50 |
| 818 Angela | 0.70mi | 1/1.0 (-1) | 680 (-10%) | 4mo | $65,000 | $96 | 44 |
| 209-211 Pendleton | 0.53mi | 1/1.0 (-1) | 672 (-10%) | 13mo | $150,000 | $223 | 41 |
Match score weights: distance 35% · size 25% · config 20% · recency 20%. Top-matched comps best support the ARV.
Projected returns pro-forma
10.0% appreciation · 7.73% rent growth · sell at horizon
- IRR
- 31.4%
- Equity multiple
- 3.52×
- Total profit
- $70,245
- Equity at exit
- $89,637
- IRR
- 28.9%
- Equity multiple
- 8.69×
- Total profit
- $214,190
- Equity at exit
- $193,307
Cash invested: $27,860 (down + closing). Projections, not guarantees.
Landlord ↔ Tenant lean methodology
- Overall (STATE)
- 87 Strongly Landlord-Friendly
- State Texas
- 87 Strongly Landlord-Friendly · R+5
- County
- — inherits STATE
- City
- — inherits STATE
ZIP-level market 78207
- Home prices YoY
- 15.2%
- Rents YoY
- 7.7%
- Active inventory
- 154
- Price-to-rent
- 6.8×
Monthly cashflow live
- Estimated rent
- $1,220 high interval (Pro) →
- Mortgage (P&I)
- −$522
- Tax from tax record
- −$246 /mo · $2,947/yr
- Insurance
- −$41
- HOA
- −$0
- Vacancy / Maint / Mgmt
- −$256
- Net cashflow
- $155
Break-even live
UW: 25.0% down · 7.5% · 30yr · 1.5% tax · 5.0% vac · 8.0% maint · 8.0% mgmt
Financing live
Cash to close
- Down payment
- $24,875
- Closing costs
- $2,985
- Reserves months
- —
- Total cash needed
- —
Loan-product check · same deal, 3 products live
Conventional
25% down · 7.5% · 30yr
- Down + closing
- —
- Monthly P&I
- —
- Monthly cashflow
- —
- DSCR
- —
- Eligible?
- —
Personal DTI + credit; lowest rate.
DSCR
20% down · 8.5% · 30yr
- Down + closing
- —
- Monthly P&I
- —
- Monthly cashflow
- —
- DSCR
- —
- Eligible?
- —
No personal income docs; deal must DSCR.
Hard money
10% down · 12.0% · 12mo
- Down + closing
- —
- Monthly P&I
- —
- Monthly cashflow
- —
- DSCR
- —
- Eligible?
- —
Short-term bridge; refi at stabilization.
Rent comps 40 comps
| Address | Beds | Baths | Sqft | Rent | $/sqft | DOM | Units | Dist |
|---|---|---|---|---|---|---|---|---|
| 319 Noria St San Antonio, TX | 3.0 | 1.0 | 1002 | $1,100 | $1.10 | 23d | 1 | 0.24mi |
| 2406 S Laredo St San Antonio, TX | 3.0 | 1.0 | 944 | $1,200 | $1.27 | 14d | 1 | 0.45mi |
| 1938 S Zarzamora St Unit 710 San Antonio, TX | 2.0 | 2.0 | 955 | $1,102 | $1.15 | 3d | 1 | 0.46mi |
| 1938 S Zarzamora St Unit 610 San Antonio, TX | 1.0 | 1.0 | 744 | $915 | $1.23 | 3d | 1 | 0.46mi |
| 2003 S Zarzamora St San Antonio, TX | 1.0–4.0 | 1.0–2.0 | 1028 | $1,120 | $1.09 | 23d | 1 | 0.50mi |
| 310 Finton Unit A San Antonio, TX | 1.0 | 1.0 | 960 | $850 | $0.89 | 43d | 1 | 0.59mi |
| 1901 S San Marcos Unit 610 San Antonio, TX | 1.0 | 1.0 | 750 | $962 | $1.28 | 3d | 1 | 0.60mi |
| 1901 S San Marcos Unit 710 San Antonio, TX | 2.0 | 2.0 | 985 | $1,147 | $1.16 | 3d | 1 | 0.60mi |
| 329 Taft Blvd San Antonio, TX | 2.0 | 2.0 | 862 | $2,200 | $2.55 | 1d | 1 | 0.71mi |
| 450 Taft Blvd San Antonio, TX | 3.0 | 1.0 | 883 | $1,295 | $1.47 | 43d | 1 | 0.75mi |
| 626 Kirk Pl San Antonio, TX | 2.0 | 1.0 | 912 | $1,100 | $1.21 | 20d | 1 | 0.78mi |
| 350 Barrett Pl San Antonio, TX | 2.0 | 1.0 | 616 | $1,225 | $1.99 | 4d | 1 | 0.80mi |
| 602 Chihuahua St San Antonio, TX | 2.0 | 1.0 | 783 | $1,150 | $1.47 | 43d | 1 | 0.80mi |
| 614 Chihuahua St San Antonio, TX | 3.0 | 2.0 | 1082 | $1,400 | $1.29 | 43d | 1 | 0.82mi |
| 222 Glass Ave San Antonio, TX | 2.0 | 2.0 | 1007 | $2,400 | $2.38 | 43d | 1 | 0.88mi |
| 438 Pruitt Ave #1 San Antonio, TX | 2.0 | 1.0 | 980 | $1,245 | $1.27 | 43d | 1 | 0.94mi |
| 218 Tampico St San Antonio, TX | 2.0 | 1.0–2.0 | 808 | $1,623 | $2.01 | 2d | 28 | 0.95mi |
| 815 Ripford St San Antonio, TX | 2.0 | 1.0 | 728 | $1,300 | $1.79 | 4d | 1 | 0.97mi |
| 843 Brady Blvd San Antonio, TX | 3.0 | 2.0 | 864 | $1,650 | $1.91 | 23d | 1 | 0.97mi |
| 205 W Lambert St San Antonio, TX | 2.0 | 1.0 | 550 | $995 | $1.81 | 17d | 1 | 0.99mi |
| 205 Mockert San Antonio, TX | 2.0 | 1.0 | 864 | $1,050 | $1.22 | 23d | 1 | 1.00mi |
| 131 Klein St #1 San Antonio, TX | 2.0 | 1.0 | 653 | $1,395 | $2.14 | 44d | 1 | 1.06mi |
| 1209 El Paso St San Antonio, TX | 2.0 | 1.0 | 966 | $975 | $1.01 | 23d | 1 | 1.06mi |
| 125 Forrest Ave San Antonio, TX | 2.0 | 1.0 | 616 | $1,275 | $2.07 | 16d | 1 | 1.07mi |
| 1102 El Paso St San Antonio, TX | 1.0–3.0 | 1.0–2.0 | 888 | $1,116 | $1.26 | 3d | 1 | 1.08mi |
| 2311 Potosi St San Antonio, TX | 3.0 | 1.0 | 864 | $1,600 | $1.85 | 43d | 1 | 1.12mi |
| 2812 Vera Cruz San Antonio, TX | 1.0 | 2.0 | 1060 | $1,200 | $1.13 | 4d | 1 | 1.12mi |
| 1823 San Carlos St San Antonio, TX | 3.0 | 2.0 | 1090 | $1,099 | $1.01 | 2d | 1 | 1.14mi |
| 150 Hearne San Antonio, TX | 2.0 | 1.0 | 1044 | $1,400 | $1.34 | 23d | 1 | 1.14mi |
| 2721 Colima St San Antonio, TX | 2.0 | 1.0 | 700 | $1,250 | $1.79 | 14d | 1 | 1.15mi |
| 509 S Trinity St San Antonio, TX | 3.0 | 1.0 | 921 | $1,300 | $1.41 | 4d | 1 | 1.17mi |
| 939 S Frio St Unit 2294 San Antonio, TX | 2.0 | 2.0 | 931 | $1,467 | $1.58 | 3d | 1 | 1.19mi |
| 939 S Frio St Unit 1294 San Antonio, TX | 1.0 | 1.0 | 630 | $977 | $1.55 | 3d | 1 | 1.19mi |
| 939 S Frio St Unit 294 San Antonio, TX | 1.0 | 1.0 | 664 | $1,009 | $1.52 | 10d | 1 | 1.19mi |
| 120 Bank St San Antonio, TX | 3.0 | 2.0 | 1035 | $1,495 | $1.44 | 43d | 1 | 1.20mi |
| 120 Bank St San Antonio, TX | 3.0 | 2.0 | 1035 | $1,450 | $1.40 | 20d | 1 | 1.20mi |
| 128 Saint Francis Ave Unit 3 San Antonio, TX | 1.0 | 1.0 | 528 | $775 | $1.47 | 23d | 1 | 1.22mi |
| 1011 S Frio St San Antonio, TX | 3.0 | 1.0–3.0 | 1121 | $1,820 | $1.62 | 1d | 32 | 1.22mi |
| 1711 W Cesar E Chavez Blvd Unit 1 San Antonio, TX | 3.0 | 1.0 | 800 | $1,275 | $1.59 | 43d | 1 | 1.22mi |
| 142 Helena St San Antonio, TX | 2.0 | 1.0 | 840 | $1,350 | $1.61 | 4d | 1 | 1.24mi |
Listing history 14 events
-
2026-06-18days on market $99,500 Active 82 DOM
-
2026-06-17days on market $99,500 Active 81 DOM
-
2026-06-16days on market $99,500 Active 80 DOM
-
2026-06-15days on market $99,500 Active 79 DOM
-
2026-06-13days on market $99,500 Active 77 DOM
-
2026-06-09days on market $99,500 Active 73 DOM
-
2026-06-08days on market $99,500 Active 72 DOM
-
2026-06-07days on market $99,500 Active 71 DOM
-
2026-06-04days on market $99,500 Active 68 DOM
-
2026-06-03days on market $99,500 Active 67 DOM
-
2026-06-02days on market $99,500 Active 66 DOM
-
2026-06-01days on market $99,500 Active 65 DOM
-
2026-05-31days on market $99,500 Active 64 DOM
-
2026-03-28$99,500 New 694-char remark
Show marketing remark (694 chars)
Great opportunity for investors or buyers ready to add their personal touch! This property is being sold AS IS and offers incredible potential as an investment property or a primary residence with some updates and repairs. The home sits on a large lot with a mature pecan tree, providing shade and plenty of outdoor space. A standout feature is the detached additional building with plumbing, offering endless possibilities-workshop, guest space, rental potential, or studio. Located just minutes from Downtown San Antonio with quick access to major expressways, this property combines convenience with opportunity. Don't miss the chance to transform this property into something special!
ⓘ Source: listings_history table (triggers on properties + properties_extension) + one-shot
backfill from property_details.listing_events for pre-trigger history.
Tax reassessment forecast TX · Resets to sale price
- Current annual tax
- $2,947 · $246/mo
- Projected year-2 tax
- $2,947 · $246/mo
- Expected delta
- $0/yr ($0/mo · 0.0%)
ⓘ Screening estimate from a state-policy table — verify with the county assessor before closing.
Climate risk First Street
- Flood 1/10 Low FEMA zone X (unshaded) · 0% chance over 30 yrs
- Wildfire 1/10 Low
- Heat 8/10 Severe 7 d/yr ≥109°F today · 22 d/yr by 30 yrs out
- Wind 8/10 Severe 80% chance of damaging wind over 30 yrs
- Air quality 2/10 Low 1 unhealthy d/yr today · 2 by 30 yrs out
Nearby sold comps map
Loading sold comps map…
Walkable amenities ~0.75 mi
Loading nearby amenities…
Taxation est. · year 1
- Rental income
- $14,641
- − Mortgage interest
- −$5,574
- − Property taxes
- −$2,947
- − Insurance
- −$498
- − Repairs & maintenance
- −$1,171
- − Management
- −$1,171
- − Depreciation
- −$2,895
- Taxable income
- $387
- Est. tax owed @ 24.0%
- −$93
- After-tax cash flow
- $1,768/yr
For passive investors: Depreciation is non-cash, so a rental often shows a tax loss while cash-flowing — sheltering income. Rental losses are passive: they offset passive income freely, and up to $25,000/yr can offset ordinary (W-2) income if you actively participate and your MAGI is under $100k (phasing out to $0 by $150k); unused losses carry forward. On sale, claimed depreciation is recaptured at up to 25%, and gains may owe capital-gains tax (a 1031 exchange can defer both). Figures are a year-1 estimate at your 24.0% rate — not tax advice; consult a CPA.
Schools (NCES district)
- District
- San Antonio ISD
- NCES district ID
- 4838730
- Math proficiency
- 12% ▼ -21.00%
- Reading proficiency
- 22% ▼ -7.00%
- Median HH income
- $30,952
- Composite
- 13.57/100
- National rank
- #9512
- State rank
- #805 of 826 in TX
Livability — San Antonio
- Score
- 80/100
- State rank
- #31
- US rank
- #1616
Category grades
Schools grade is shown separately in the Schools card above.
Census & demographics
- Census place
- San Antonio, TX
- County
- Bexar County · 1,990,555 people
- City population
- 1,806,925
- Metro
- San Antonio-New Braunfels, TX
- Population (ZIP)
- 55,474
- Household income
- $32,472
- Rent vs Own
- Severe rent burden
- 2789.0
Population outlook (Bexar County) Hauer SSP2
- Today (2025)
- 2,336,851 people
- By 2030
- 2,560,728 · +9.6%
- By 2040
- 3,020,569 · +29.3%
- By 2050
- 3,493,522 · +49.5%
- By 2075
- 4,668,459 · +99.8%
- By 2100
- 5,533,242 · +136.8%
Race, ethnicity, and origin ACS 2023
- Neighborhood character
- Predominantly Hispanic (88%)
- Race & ethnicity
- Hispanic / Latino 88% Two or more races 41% White 6% Black 5% Native American 2%
- Hispanic origin (detail)
- Mexican 79%
- Foreign-born
- 19% · Canada
- Languages at home
- 39% English-only · Spanish 60%
Political lean MEDSL · Bexar
- 2024 margin
- Lean D (+9.8) · D 54.3% · R 44.6% · Other 1.1%
- 2008→2024 swing
- +4.2pp toward D · 2008: 5.6pp · 2024: 9.8pp
- All cycles
- 2024: D+9.8 2020: D+18.2 2016: D+13.5 2012: D+4.6 2008: D+5.6
Not yet ingested
- Civics
- —
Market trends
- HPI YoY
- ▲ 34.92%
- Current HPI
- 264.7559
- Rent YoY
- ▲ 7.73%
- Metro
- San Antonio-New Braunfels, TX
- State GDP YoY
- ▲ 3.95%
- F500 in state
- 110
Industry mix (Fortune 500 HQ in TX)
| Industry | F500 HQs | Revenue |
|---|---|---|
| Energy | 16 | $1,198B |
|
||
| Technology | 5 | $198B |
|
||
| Engineering / Construction | 4 | $72B |
|
||
| Energy Services | 3 | $60B |
|
||
| Utilities | 3 | $41B |
|
||
| Healthcare | 2 | $330B |
|
||
Price history
1 event — show timeline
- 2026-03-28 Listed $99,500 LERA
Property tax history
+8.5%/yrLatest (2025): $2,947 · +0.0% YoY. Source: county tax records.
Cash-flow waterfall
monthlySold comps — $/sqft
last 12 mo · ≤1 miLoading sold comps…