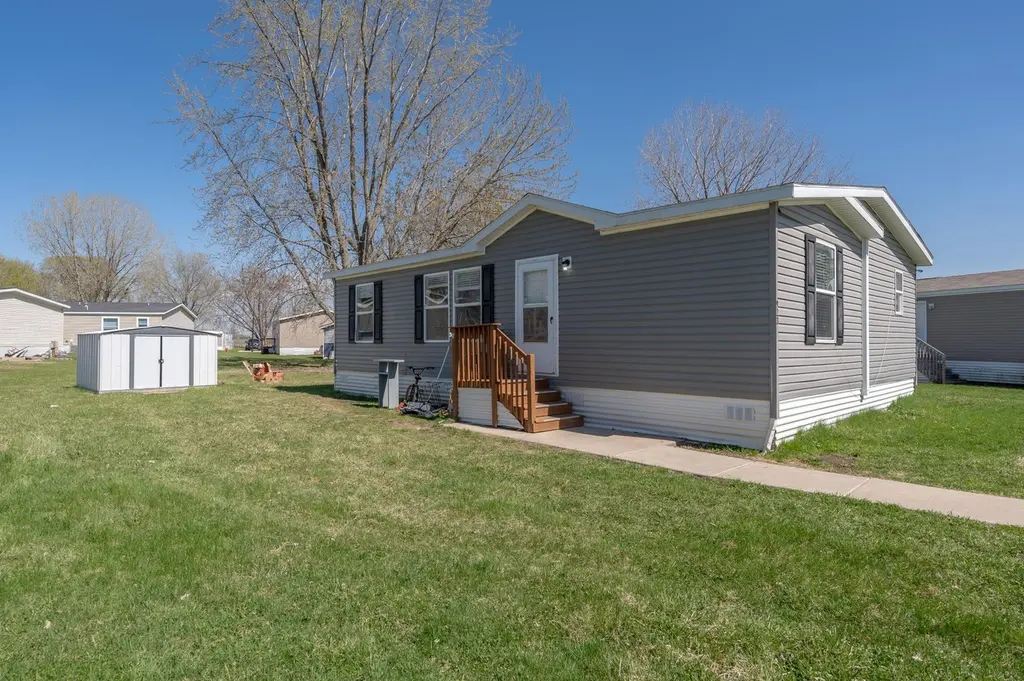
923 Hamlet Cir · Lakeville, MN
Flood risk 1/10 · Minimal
- FEMA flood zone
- X (unshaded)
- Chance of flooding over 30 yrs
- 0.0%
- Est. flood insurance / yr
- $507 – $1,088
Fire risk 1/10 · Minimal
- Est. fire insurance / yr
- $888 – $1,650
Heat risk 2/10 · Minimal
- Hot days now (above 99°F)
- 7 days/yr
- Hot days in 30 yrs
- 14 days/yr
Wind risk 2/10 · Minimal
- Chance of severe wind over 30 yrs
- —
Air-quality risk 2/10 · Minimal
- Unhealthy air days now
- 0 days/yr
- Unhealthy air days in 30 yrs
- 1 days/yr
Risk factors via First Street. Map © Google.
Why this score? — see what drove the B grade
The composite is a weighted blend of 9 inputs, each scored 0–100. Each bar is that input's sub-score; the figure is the points it added to the 100-point composite (weight × sub-score).
- Cash flow +30.0/30.0
- 1% rule +10.0/10.0
- DSCR +10.0/10.0
- ARV discount +7.5/15.0
- Schools +4.4/10.0
- Livability +4.2/5.0
- Condition / age +3.8/5.0
- Rent growth +3.3/5.0
- Appreciation +0.0/10.0
$99,900
🖨 Deal sheet 📄 Offer letter ✓ Due diligence
Key facts
- Built 2018
- Listed 55 days
Property features AI
Finance
- Financial info: Annual taxes reported $568 (2026)
- HOA & community: Land is leased (land lease $950)
Exterior
- Parking: Asphalt parking
- Utilities: City water connected; City sewer connected; Natural gas
- Home design: Residential property; Single-story; Above-grade living area 1,248
- Construction: Manufactured home
- Exterior features: Vinyl exterior; Asphalt parking
Interior
- Bedrooms: 3 bedrooms
- Bathrooms: 2 full bathrooms
- Heating & cooling: Forced air heating; Central air conditioning
- Interior features: No basement; One-level living
Neighborhood map
What this means for you Summary
Snapshot
- This is a 3-bed/2.0-bath single-family listed at $100k. Condition is rated good.
Deal economics
- At list price, monthly cash flow is $1k ($13k/yr) — positive.
- The deal already cash-flows at list — no discount required.
- Meets the 1% rule at list price ($2k rent vs $100k).
- Recommended offer: $97k (3.0% below list) — sets the bar for market timing.
- Cap rate 19.3% vs local median 3.2% in Lakeville — top-decile yield for the area; either an underpriced asset or a hidden risk that comps aren't pricing in. Stress-test before assuming the spread holds.
Location & tenants
- Location reads 84/100 on livability (#25 in MN, #711 nationally) — a professional / high-income tenant draw. Strengths: schools A+, crime A+, employment A+; Watch: amenities D+, commute F, cost of living F.
- Farmington Public School District (suburban): math 43% / reading 52% proficiency, ranked #104 of 301 in MN (top 35%) — families likely to look elsewhere, expect single-tenant / working-renter base with shorter leases; only 12% free/reduced lunch — higher-income household profile.
- Market conditions: Rents rising (+3.4%/yr); 713 active listings in the ZIP; 1 comparable units currently listed for rent nearby; high-income renter base; 2,134 units permitted in Dakota County in 2024 (898 in 5+ unit buildings).
Forward outlook
- Local home prices are declining (-3.0%/yr); year-one equity from $691 of loan paydown is wiped out by about $3k of value loss. Plan a longer hold.
- Dakota County population projected at +11% by 2050 — modest demand growth; plan on rents tracking national, not racing it.
- At projected returns (-3.0% appreciation + 3.4% rent growth), your $28k cash investment doubles in ~3 years — after that, you're playing with house money.
Negotiation context
- It's been on market 55 days — a 3% lower offer ($97k) is reasonable based on typical stale-listing flexibility.
Questions for the listing agent
- It's been on market 55 days. Have you received any prior offers? Is the seller open to a 3% concession, seller financing, or rate buy-down credit?
- Is there a deadline driving the sale (1031 exchange, divorce, estate, relocation)? That informs how much negotiation room exists.
- Schools are A-rated — typically a magnet for longer-tenancy family renters. What's the average tenant stay here, and is there a school-zone premium baked into asking?
- What's the average days-on-market for RENTAL listings here right now (not sales)? A rising rental-DOM trend means longer vacancies and softer asking-rent achievability than the comps imply.
- What's the recent tenant-quality profile in this submarket — average credit score on applications, eviction rate, late-payment / NSF rate, and stable-employment percentage? A property-management company in the area should have these aggregated.
- How much new for-sale + rental construction is in the pipeline within 1–3 miles? Heavy new supply typically softens prices + rents 12–24 months out; constrained supply supports both.
Investment metrics
- 1% rule
- 2.25% ✓
- Cap rate
- 19.29%
- Cash-on-cash
- 46.43%
- DSCR
- 3.07
- GRM
- 3.7
CMA / ARV
- ARV (median comp)
- $325,852
- List price
- $99,900
- Delta
- -69.34%
- Verdict
- UNDERPRICED
- Comps
- 1 within 2.0 mi
Projected returns pro-forma
-3.0% appreciation · 3.38% rent growth · sell at horizon
- IRR
- 44.1%
- Equity multiple
- 2.92×
- Total profit
- $53,633
- Equity at exit
- $14,895
- IRR
- 50.3%
- Equity multiple
- 5.97×
- Total profit
- $139,154
- Equity at exit
- $8,638
Cash invested: $27,972 (down + closing). Projections, not guarantees.
Landlord ↔ Tenant lean methodology
- Overall (STATE)
- 46 Balanced
- State Minnesota
- 46 Balanced · D+2
- County
- — inherits STATE
- City
- — inherits STATE
ZIP-level market 55044
- Rents YoY
- 3.4%
- Active inventory
- 713
- Price-to-rent
- 3.7×
Monthly cashflow live
- Estimated rent
- $2,244 medium interval (Pro) →
- Mortgage (P&I)
- −$524
- Tax est. 1.5%
- −$125 /mo · $1,498/yr
- Insurance
- −$42
- HOA
- −$0
- Vacancy / Maint / Mgmt
- −$471
- Net cashflow
- $1,082
Break-even live
UW: 25.0% down · 7.5% · 30yr · 1.5% tax · 5.0% vac · 8.0% maint · 8.0% mgmt
Financing live
Cash to close
- Down payment
- $24,975
- Closing costs
- $2,997
- Reserves months
- —
- Total cash needed
- —
Loan-product check · same deal, 3 products live
Conventional
25% down · 7.5% · 30yr
- Down + closing
- —
- Monthly P&I
- —
- Monthly cashflow
- —
- DSCR
- —
- Eligible?
- —
Personal DTI + credit; lowest rate.
DSCR
20% down · 8.5% · 30yr
- Down + closing
- —
- Monthly P&I
- —
- Monthly cashflow
- —
- DSCR
- —
- Eligible?
- —
No personal income docs; deal must DSCR.
Hard money
10% down · 12.0% · 12mo
- Down + closing
- —
- Monthly P&I
- —
- Monthly cashflow
- —
- DSCR
- —
- Eligible?
- —
Short-term bridge; refi at stabilization.
Rent comps 1 comps
| Address | Beds | Baths | Sqft | Rent | $/sqft | DOM | Units | Dist |
|---|---|---|---|---|---|---|---|---|
| 8500 210th St W Lakeville, MN | 1.0–3.0 | 1.0–2.0 | 920 | $1,755 | $1.91 | 1d | 1 | 1.44mi |
Listing history 14 events
-
2026-06-18days on market $99,900 Active 55 DOM
-
2026-06-17days on market $99,900 Active 54 DOM
-
2026-06-16days on market $99,900 Active 53 DOM
-
2026-06-15days on market $99,900 Active 52 DOM
-
2026-06-13days on market $99,900 Active 50 DOM
-
2026-06-09days on market $99,900 Active 46 DOM
-
2026-06-08days on market $99,900 Active 45 DOM
-
2026-06-07days on market $99,900 Active 44 DOM
-
2026-06-04days on market $99,900 Active 41 DOM
-
2026-06-03days on market $99,900 Active 40 DOM
-
2026-06-02days on market $99,900 Active 39 DOM
-
2026-06-01days on market $99,900 Active 38 DOM
-
2026-05-31days on market $99,900 Active 37 DOM
-
2026-04-24$99,900 Active 389-char remark
ⓘ Source: listings_history table (triggers on properties + properties_extension) + one-shot
backfill from property_details.listing_events for pre-trigger history.
Climate risk First Street
- Flood 1/10 Low FEMA zone X (unshaded) · 0% chance over 30 yrs
- Wildfire 1/10 Low
- Heat 2/10 Low 7 d/yr ≥99°F today · 14 d/yr by 30 yrs out
- Wind 2/10 Low
- Air quality 2/10 Low 0 unhealthy d/yr today · 1 by 30 yrs out
Nearby sold comps map
Loading sold comps map…
Walkable amenities ~0.75 mi
Loading nearby amenities…
Taxation est. · year 1
- Rental income
- $26,925
- − Mortgage interest
- −$5,596
- − Property taxes
- −$1,498
- − Insurance
- −$500
- − Repairs & maintenance
- −$2,154
- − Management
- −$2,154
- − Depreciation
- −$2,906
- Taxable income
- $12,117
- Est. tax owed @ 24.0%
- −$2,908
- After-tax cash flow
- $10,078/yr
For passive investors: Depreciation is non-cash, so a rental often shows a tax loss while cash-flowing — sheltering income. Rental losses are passive: they offset passive income freely, and up to $25,000/yr can offset ordinary (W-2) income if you actively participate and your MAGI is under $100k (phasing out to $0 by $150k); unused losses carry forward. On sale, claimed depreciation is recaptured at up to 25%, and gains may owe capital-gains tax (a 1031 exchange can defer both). Figures are a year-1 estimate at your 24.0% rate — not tax advice; consult a CPA.
Condition & rehab AI · 12 photos
This home is in good condition with cosmetic updates needed to enhance its curb appeal and interior aesthetics. The property is move-in ready with a good foundation and structure.
Repairs flagged
- Minor Kitchen cabinets — Worn appearance
- Minor Kitchen countertops — Need cleaning
Value-add opportunities
- Both Paint interior walls — Fresh paint enhances curb appeal and interior aesthetics.
- Both Replace kitchen countertops — New countertops improve functionality and aesthetics.
- Both Landscaping improvements — Enhances curb appeal and adds value to the property.
Renovation cost estimate screening
| Repair item | Severity | Est. cost |
|---|---|---|
| Kitchen cabinets · Worn appearance | Minor | $500–3,000 |
| Kitchen countertops · Need cleaning | Minor | $500–3,000 |
| Total estimated repair cost · 2 items | $1,000–6,000 |
Value-add ROI direction
- Both Paint interior walls — Fresh paint enhances curb appeal and interior aesthetics. ↑
- Both Replace kitchen countertops — New countertops improve functionality and aesthetics. ↑
- Both Landscaping improvements — Enhances curb appeal and adds value to the property. ↑
ⓘ Cost ranges are severity-bucket heuristics (US national rule-of-thumb). Get contractor quotes + a written scope before underwriting a rehab budget.
Schools (NCES district)
- District
- Farmington Public School District
- NCES district ID
- 2711820
- Math proficiency
- 43% ▼ -12.00%
- Reading proficiency
- 52% ▼ -7.00%
- Median HH income
- $83,959
- Composite
- 43.93/100
- National rank
- #2905
- State rank
- #104 of 301 in MN
Livability — Lakeville
- Score
- 84/100
- State rank
- #25
- US rank
- #711
Category grades
Schools grade is shown separately in the Schools card above.
Census & demographics
- Census place
- Lakeville, MN
- County
- Dakota County · 417,704 people
- City population
- 64,762
- Metro
- Minneapolis-St. Paul-Bloomington, MN-WI
- Population (ZIP)
- 64,762
- Household income
- $141,551
- Rent vs Own
- Severe rent burden
- 956.0
Population outlook (Dakota County) Hauer SSP2
- Today (2025)
- 450,671 people
- By 2030
- 465,068 · +3.2%
- By 2040
- 486,770 · +8.0%
- By 2050
- 498,743 · +10.7%
- By 2075
- 533,865 · +18.5%
- By 2100
- 550,133 · +22.1%
Race, ethnicity, and origin ACS 2023
- Neighborhood character
- Predominantly White (80%)
- Race & ethnicity
- White 80% Hispanic / Latino 6% Asian 6% Two or more races 5% Black 4%
- Hispanic origin (detail)
- Mexican 4%
- Common ancestry
- Portuguese 13% Romanian 4% Italian 3%
- Foreign-born
- 9% · Canada, Vietnam, South Korea
- Languages at home
- 88% English-only · Spanish 4% Other Asian/Pacific 2% Vietnamese 1%
Political lean MEDSL · Dakota
- 2024 margin
- D (+12.9) · D 55.4% · R 42.5% · Other 2.1%
- 2008→2024 swing
- +7.4pp toward D · 2008: 5.5pp · 2024: 12.9pp
- All cycles
- 2024: D+12.9 2020: D+13.9 2016: D+4.7 2012: D+2.9 2008: D+5.5
Not yet ingested
- Civics
- —
Market trends
- HPI YoY
- ▼ -165.50%
- Current HPI
- 216.0601
- Rent YoY
- ▲ 3.38%
- Metro
- Minneapolis-St. Paul-Bloomington, MN-WI
- State GDP YoY
- ▲ 2.41%
- F500 in state
- 34
Industry mix (Fortune 500 HQ in MN)
| Industry | F500 HQs | Revenue |
|---|---|---|
| Healthcare | 2 | $407B |
|
||
| Retail | 2 | $150B |
|
||
| Consumer Goods | 2 | $32B |
|
||
| Industrial Machinery | 2 | $6B |
|
||
| Agriculture | 1 | $40B |
|
||
| Healthcare / Medical Devices | 1 | $32B |
|
||
Price history
1 event — show timeline
- 2026-04-24 Listed $99,900 NORTHSTARMLS as Distributed by MLS Grid
Cash-flow waterfall
monthlySold comps — $/sqft
last 12 mo · ≤1 miLoading sold comps…