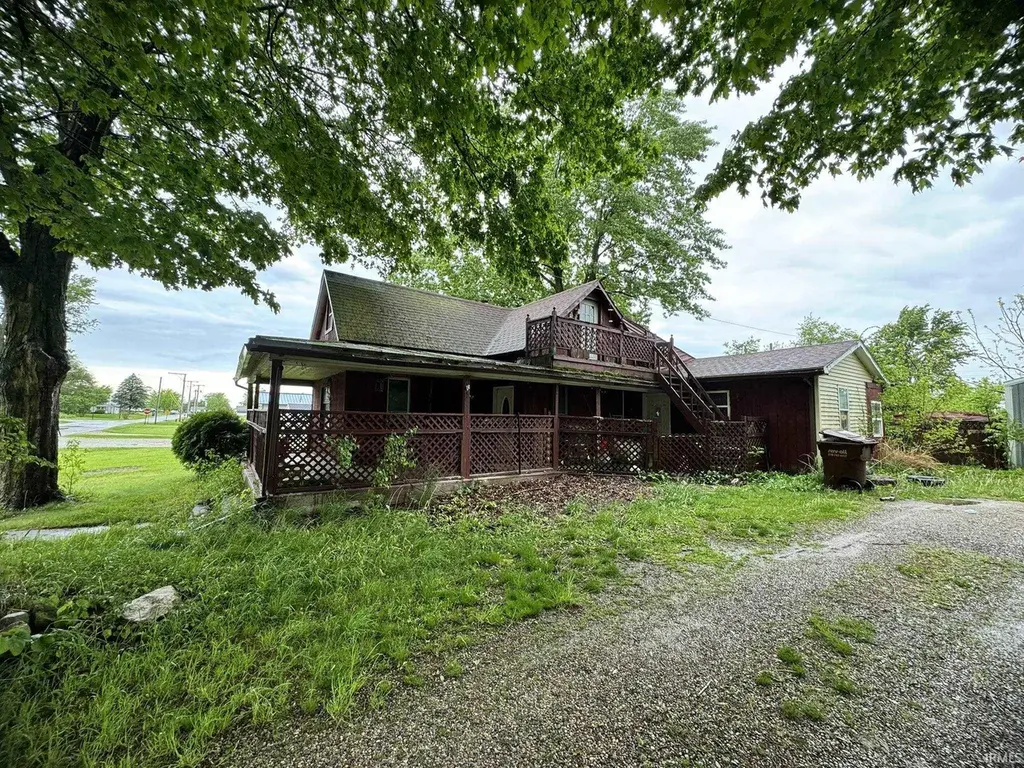
315 W Lincoln St · Ashley, IN
Flood risk 1/10 · Minimal
- FEMA flood zone
- X (unshaded)
- Chance of flooding over 30 yrs
- 0.0%
- Est. flood insurance / yr
- $507 – $1,088
Fire risk 1/10 · Minimal
- Est. fire insurance / yr
- $717 – $1,331
Heat risk 2/10 · Minimal
- Hot days now (above 100°F)
- 7 days/yr
- Hot days in 30 yrs
- 16 days/yr
Wind risk 2/10 · Minimal
- Chance of severe wind over 30 yrs
- —
Air-quality risk 2/10 · Minimal
- Unhealthy air days now
- 1 days/yr
- Unhealthy air days in 30 yrs
- 2 days/yr
Risk factors via First Street. Map © Google.
Why this score? — see what drove the B- grade
The composite is a weighted blend of 9 inputs, each scored 0–100. Each bar is that input's sub-score; the figure is the points it added to the 100-point composite (weight × sub-score).
- Cash flow +30.0/30.0
- DSCR +10.0/10.0
- 1% rule +9.9/10.0
- ARV discount +7.5/15.0
- Schools +3.9/10.0
- Livability +3.2/5.0
- Rent growth +2.5/5.0
- Condition / age +2.5/5.0
- Appreciation +0.0/10.0
$84,900
🖨 Deal sheet 📄 Offer letter ✓ Due diligence
Listing remarks MLS
Nestled in a quiet neighborhood on 2 lots this charmer is ready for some TLC. A wrap around porch is perfect for morning coffee or just relaxing in the evening. Roof new in 2016. 2 car garage built in 2012 Back yard is fenced for pets or kids. Upper level attic provides good storage. Priced to sell!
Key facts
- Quiet street
- 2 lots
- Fenced in back yard
Tags
Property features AI
Exterior
- Parking: Detached 2-car garage
- Utilities: Public water; Public sewer
- Home design: Single-story single-family residence; Site-built home
- Construction: Vinyl and wood siding
- Exterior features: Level lot; Lot dimensions approximately 100 x 135; 0.3-acre lot
Interior
- Bathrooms: 1 full bathroom (main level)
- Heating & cooling: Natural gas heating; Wall-unit cooling
- Interior features: Crawl space basement; 7 total rooms
- Laundry & utility: Main-level laundry
Neighborhood map
What this means for you Summary
Snapshot
- This is a 2-bed/1.0-bath single-family listed at $85k.
Deal economics
- At list price, monthly cash flow is $500 ($6k/yr) — positive.
- The deal already cash-flows at list — no discount required.
- Meets the 1% rule at list price ($1k rent vs $85k).
- Recommended offer: $84k (1.5% below list) — sets the bar for market timing.
Location & tenants
- Location reads 65/100 on livability (#320 in IN) — a middle-class / working-renter tenant base. Strengths: crime A+, cost of living A+, housing A+; Watch: employment C-, amenities F, commute F.
- Dekalb County Ctl United School District (town): math 42% / reading 50% proficiency, ranked #91 of 301 in IN (top 30%) — families likely to look elsewhere, expect single-tenant / working-renter base with shorter leases.
- Zoned schools: Country Meadow Elementary School (math 47% / reading 37%, grade F, #434 of 994 statewide, top 48%, 314 students, 43% FRL); Dekalb Middle School (math 34% / reading 52%, grade D-, #92 of 330 statewide, top 29%, 800 students, 47% FRL); Dekalb High School (math 43% / reading 70%, grade C, #70 of 369 statewide, top 19%, 1,075 students, 36% FRL).
- Market conditions: 150 active listings in the ZIP; 209 units permitted in Steuben County in 2024 (72 in 5+ unit buildings).
Forward outlook
- Local home prices are declining (-3.0%/yr); year-one equity from $587 of loan paydown is wiped out by about $3k of value loss. Plan a longer hold.
- Steuben County population projected at -13% by 2050 — secular population decline; favor cash flow + early exit over multi-decade hold.
- At projected returns (-3.0% appreciation + 3.0% rent growth), your $24k cash investment doubles in ~5 years — after that, you're playing with house money.
Negotiation context
- It's been on market 30 days — a 2% lower offer ($84k) is reasonable based on typical stale-listing flexibility.
- 4 sale attempts since 10y ago; this cycle's ask has dropped $10k (11%) from the opening price — seller is motivated, your offer sets the floor, not the list.
- Current owner paid $67k; 27% above their basis — modest negotiation headroom, anchor on the comps not their cost.
Risks & watch-outs
- Watch-outs: built in 1900 — expect roof / HVAC / electrical / plumbing capex.
Questions for the listing agent
- Built in 1900 — when were the roof, HVAC, electrical panel, plumbing, and water heater last replaced?
- Is there a deadline driving the sale (1031 exchange, divorce, estate, relocation)? That informs how much negotiation room exists.
- Schools are D-rated, which usually means shorter tenancies and higher turnover. Who's the typical renter profile here, and what's been the actual vacancy rate?
- What's the average days-on-market for RENTAL listings here right now (not sales)? A rising rental-DOM trend means longer vacancies and softer asking-rent achievability than the comps imply.
- What's the recent tenant-quality profile in this submarket — average credit score on applications, eviction rate, late-payment / NSF rate, and stable-employment percentage? A property-management company in the area should have these aggregated.
- How much new for-sale + rental construction is in the pipeline within 1–3 miles? Heavy new supply typically softens prices + rents 12–24 months out; constrained supply supports both.
Investment metrics
- 1% rule
- 1.49% ✓
- Cap rate
- 13.36%
- Cash-on-cash
- 25.23%
- DSCR
- 2.12
- GRM
- 5.6
CMA / ARV
- ARV (on-the-fly)
- $194,552
- Comps found
- 9
Show comp detail 9 sales within ~0.75 mi
| Address | Dist | Beds/Ba | Sqft | Sold | Price | $/sf | Match |
|---|---|---|---|---|---|---|---|
| 507 W State St | 0.11mi | 3/1.5 (+1) | 1,144 (-2%) | 9mo | $189,900 | $166 | 76 |
| 408 Hardy St | 0.53mi | 3/1.0 (+1) | 1,188 (+1%) | 1mo | $189,000 | $159 | 67 |
| 509 W State St | 0.13mi | 3/2.0 (+1) | 1,056 (-10%) | 10mo | $197,200 | $187 | 60 |
| 103 Adams Ct | 0.12mi | 3/1.0 (+1) | 1,008 (-14%) | 11mo | $165,000 | $164 | 57 |
| 106 E Hobart St | 0.42mi | 3/2.0 (+1) | 1,120 (-4%) | 9mo | $175,000 | $156 | 56 |
| 410 S Gonser Ave | 0.46mi | 3/2.0 (+1) | 1,001 (-15%) | 3mo | $180,000 | $180 | 43 |
| 305 Chapel Ln | 0.68mi | 3/1.0 (+1) | 1,280 (+9%) | 8mo | $215,000 | $168 | 41 |
| 302 Chaple Ln | 0.68mi | 3/1.0 (+1) | 1,008 (-14%) | 0mo | $195,000 | $193 | 39 |
| 203 E Lincoln St | 0.38mi | 3/1.0 (+1) | 1,008 (-14%) | 24mo | $110,000 | $109 | 34 |
Match score weights: distance 35% · size 25% · config 20% · recency 20%. Top-matched comps best support the ARV.
Projected returns pro-forma
-3.0% appreciation · 3.0% rent growth · sell at horizon
- IRR
- 18.7%
- Equity multiple
- 1.76×
- Total profit
- $18,045
- Equity at exit
- $12,659
- IRR
- 27.1%
- Equity multiple
- 3.38×
- Total profit
- $56,563
- Equity at exit
- $7,341
Cash invested: $23,772 (down + closing). Projections, not guarantees.
Landlord ↔ Tenant lean methodology
- Overall (STATE)
- 90 Strongly Landlord-Friendly
- State Indiana
- 90 Strongly Landlord-Friendly · R+11
- County
- — inherits STATE
- City
- — inherits STATE
ZIP-level market 46706
- Home prices YoY
- -15.2%
- Active inventory
- 150
- Price-to-rent
- 5.6×
Monthly cashflow live
- Estimated rent
- $1,262 medium interval (Pro) →
- Mortgage (P&I)
- −$445
- Tax from tax record
- −$16 /mo · $197/yr
- Insurance
- −$35
- HOA
- −$0
- Vacancy / Maint / Mgmt
- −$265
- Net cashflow
- $500
Break-even live
UW: 25.0% down · 7.5% · 30yr · 1.5% tax · 5.0% vac · 8.0% maint · 8.0% mgmt
Financing live
Cash to close
- Down payment
- $21,225
- Closing costs
- $2,547
- Reserves months
- —
- Total cash needed
- —
Loan-product check · same deal, 3 products live
Conventional
25% down · 7.5% · 30yr
- Down + closing
- —
- Monthly P&I
- —
- Monthly cashflow
- —
- DSCR
- —
- Eligible?
- —
Personal DTI + credit; lowest rate.
DSCR
20% down · 8.5% · 30yr
- Down + closing
- —
- Monthly P&I
- —
- Monthly cashflow
- —
- DSCR
- —
- Eligible?
- —
No personal income docs; deal must DSCR.
Hard money
10% down · 12.0% · 12mo
- Down + closing
- —
- Monthly P&I
- —
- Monthly cashflow
- —
- DSCR
- —
- Eligible?
- —
Short-term bridge; refi at stabilization.
Listing history 23 events
-
2026-06-18days on market $84,900 Active 30 DOM
-
2026-06-17remarks 225-char remark
-
2026-06-17price $84,900 Active 29 DOM
-
2026-06-17days on market $89,900 Active 29 DOM
-
2026-06-16days on market $89,900 Active 28 DOM
-
2026-06-15days on market $89,900 Active 27 DOM
-
2026-06-13days on market $89,900 Active 25 DOM
-
2026-06-12days on market $89,900 Active 24 DOM
-
2026-06-09days on market $89,900 Active 21 DOM
-
2026-06-08days on market $89,900 Active 20 DOM
-
2026-06-07days on market $89,900 Active 19 DOM
-
2026-06-07days on market $89,900 Active 18 DOM
-
2026-06-04days on market $89,900 Active 15 DOM
-
2026-06-02days on market $89,900 Active 14 DOM
-
2026-06-01price $89,900 Active 13 DOM
-
2026-06-01days on market $94,900 Active 13 DOM
-
2026-05-31days on market $94,900 Active 12 DOM
-
2026-05-31days on market $94,900 Active 11 DOM
-
2026-05-19$94,900 Active
-
2019-12-02soldstatus $66,900 302-char remark
Show marketing remark (302 chars)
Nestled in a quiet neighborhood on 2 lots this charmer is ready for some TLC. A wrap around porch is perfect for morning coffee or just relaxing in the evening. Roof new in 2016. 2 car garage built in 2012 Back yard is fenced for pets or kids. Upper level attic provides good storage. Priced to sell!
-
2019-07-12$66,900 302-char remark
Show marketing remark (302 chars)
Nestled in a quiet neighborhood on 2 lots this charmer is ready for some TLC. A wrap around porch is perfect for morning coffee or just relaxing in the evening. Roof new in 2016. 2 car garage built in 2012 Back yard is fenced for pets or kids. Upper level attic provides good storage. Priced to sell!
-
2017-07-21$69,900
-
2016-08-31$55,000
ⓘ Source: listings_history table (triggers on properties + properties_extension) + one-shot
backfill from property_details.listing_events for pre-trigger history.
Tax reassessment forecast IN · Partial reset (capped growth)
- Current annual tax
- $197 · $16/mo
- Projected year-2 tax
- $459 · $38/mo
- Expected delta
- +$262/yr (+$22/mo · 133.1%)
ⓘ Screening estimate from a state-policy table — verify with the county assessor before closing.
Climate risk First Street
- Flood 1/10 Low FEMA zone X (unshaded) · 0% chance over 30 yrs
- Wildfire 1/10 Low
- Heat 2/10 Low 7 d/yr ≥100°F today · 16 d/yr by 30 yrs out
- Wind 2/10 Low
- Air quality 2/10 Low 1 unhealthy d/yr today · 2 by 30 yrs out
Nearby sold comps map
Loading sold comps map…
Walkable amenities ~0.75 mi
Loading nearby amenities…
Taxation est. · year 1
- Rental income
- $15,143
- − Mortgage interest
- −$4,756
- − Property taxes
- −$197
- − Insurance
- −$424
- − Repairs & maintenance
- −$1,211
- − Management
- −$1,211
- − Depreciation
- −$2,470
- Taxable income
- $4,873
- Est. tax owed @ 24.0%
- −$1,170
- After-tax cash flow
- $4,829/yr
For passive investors: Depreciation is non-cash, so a rental often shows a tax loss while cash-flowing — sheltering income. Rental losses are passive: they offset passive income freely, and up to $25,000/yr can offset ordinary (W-2) income if you actively participate and your MAGI is under $100k (phasing out to $0 by $150k); unused losses carry forward. On sale, claimed depreciation is recaptured at up to 25%, and gains may owe capital-gains tax (a 1031 exchange can defer both). Figures are a year-1 estimate at your 24.0% rate — not tax advice; consult a CPA.
Schools (NCES district)
- District
- Dekalb County Ctl United School District
- NCES district ID
- 1801590
- Math proficiency
- 42% ▼ -7.00%
- Reading proficiency
- 50% ▼ -7.00%
- Median HH income
- $48,100
- Composite
- 39.26/100
- National rank
- #4000
- State rank
- #91 of 301 in IN
Livability — Ashley
- Score
- 65/100
- State rank
- #320
- US rank
- #12601
Category grades
Schools grade is shown separately in the Schools card above.
Census & demographics
- Census place
- Ashley, IN
- City population
- 1,988
- Population (ZIP)
- 20,277
Population outlook (Steuben County) Hauer SSP2
- Today (2025)
- 34,334 people
- By 2030
- 33,801 · -1.6%
- By 2040
- 32,076 · -6.6%
- By 2050
- 30,022 · -12.6%
- By 2075
- 25,626 · -25.4%
- By 2100
- 21,257 · -38.1%
Race, ethnicity, and origin ACS 2023
- Neighborhood character
- Predominantly White (96%)
- Race & ethnicity
- White 96% Two or more races 3% Hispanic / Latino 2%
- Common ancestry
- Iranian 3% Romanian 3% Lithuanian 2%
- Foreign-born
- 2% · Canada
- Languages at home
- 98% English-only · Spanish 1% German/W. Germanic 1%
Political lean MEDSL · Steuben
- 2024 margin
- Solid R (+42.1) · D 28.1% · R 70.2% · Other 1.6%
- 2008→2024 swing
- -32.3pp toward R · 2008: -9.8pp · 2024: -42.1pp
- All cycles
- 2024: R+42.1 2020: R+42.2 2016: R+44.0 2012: R+27.0 2008: R+9.8
Not yet ingested
- Civics
- —
Market trends
- HPI YoY
- ▼ -43.82%
- Current HPI
- 243.6936
- Rent YoY
- —
- Metro
- —
- State GDP YoY
- ▲ 2.90%
- F500 in state
- 18
Industry mix (Fortune 500 HQ in IN)
| Industry | F500 HQs | Revenue |
|---|---|---|
| Industrial Machinery | 2 | $37B |
|
||
| Healthcare | 1 | $177B |
|
||
| Pharmaceuticals | 1 | $45B |
|
||
| Metals / Steel | 1 | $18B |
|
||
| Agriculture | 1 | $17B |
|
||
| Packaging | 1 | $12B |
|
||
Price history
+72.5% since first listed5 events — show timeline
- 2026-05-19 Listed $94,900 IRMLS
- 2019-12-02 Sold (MLS) $66,900 IRMLS
- 2019-07-12 Listed $66,900 IRMLS
- 2017-07-21 Listed $69,900 IRMLS
- 2016-08-31 Listed $55,000 IRMLS
Property tax history
+0.2%/yrLatest (2024): $197 · -8.8% YoY. Source: county tax records.
Cash-flow waterfall
monthlySold comps — $/sqft
last 12 mo · ≤1 miLoading sold comps…