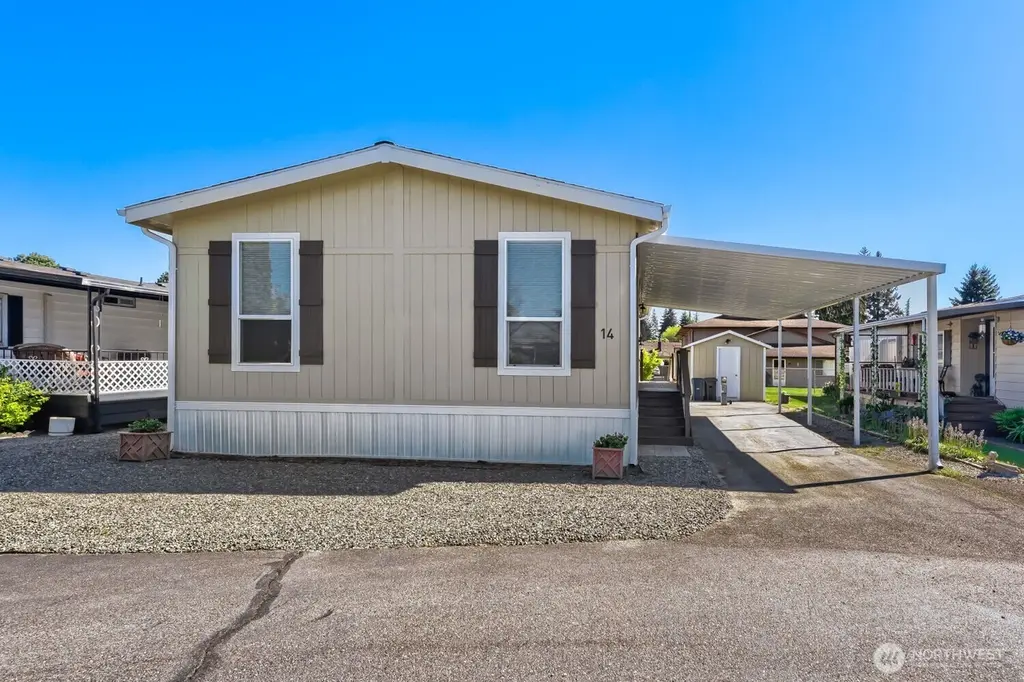
7508 47th Ave NE #14 · Marysville, WA
Flood risk No data
- FEMA flood zone
- —
- Chance of flooding over 30 yrs
- —
- Est. flood insurance / yr
- —
Fire risk No data
- Est. fire insurance / yr
- —
Heat risk No data
- Hot days now (above threshold)
- —
- Hot days in 30 yrs
- —
Wind risk No data
- Chance of severe wind over 30 yrs
- —
Air-quality risk No data
- Unhealthy air days now
- —
- Unhealthy air days in 30 yrs
- —
Risk factors via First Street. Map © Google.
Why this score? — see what drove the C+ grade
The composite is a weighted blend of 9 inputs, each scored 0–100. Each bar is that input's sub-score; the figure is the points it added to the 100-point composite (weight × sub-score).
- Cash flow +25.2/30.0
- DSCR +8.3/10.0
- ARV discount +7.5/15.0
- 1% rule +5.4/10.0
- Livability +4.2/5.0
- Schools +4.1/10.0
- Rent growth +2.9/5.0
- Condition / age +2.5/5.0
- Appreciation +0.0/10.0
$215,000
🖨 Deal sheet 📄 Offer letter ✓ Due diligence
Listing remarks
Welcome to easy, low-maintenance living in this beautifully maintained 2021 manufactured home! Thoughtfully designed, this one-owner home features 3 bedrooms, 2 full bathrooms and a bright, open layout. The spacious kitchen offers plenty of storage for everyday living and entertaining. The primary suite is situated on the opposite side of the home, featuring a large bathroom and walk-in closet. Enjoy quiet mornings or relaxing evenings on the extended deck or back patio. A detached shed provides ample storage for tools, hobbies, or seasonal items. Located in a quiet 55+ community, you’ll enjoy a relaxed pace of living while still being close to everyday amenities, making errands sim
Key facts
- Spacious kitchen
- Extended deck
- Detached shed
Tags
Property features AI
Finance
- Other: Bus line nearby
- Financial info: Land lease payment; Listing terms: Cash
- HOA & community: Located in Liberty Village park (37 homes); Park approved for sale; Senior community
Exterior
- Parking: Carport
- Utilities: Electric energy source; Public water; Public sewer; Power provided by PUD; Water service by Liberty Village
- Home design: Manufactured double-wide home; One level; Marlette model 55CRC24443BH21; Very good condition; Mobile home remains in place
- Construction: Cement plank construction; Composition roof; Tie-down foundation; Manufactured after 06/15/1976
- Exterior features: Cement planked exterior; Dead-end street; Paved access; Patio/porch/deck
Interior
- Kitchen: Dishwasher; Garbage disposal; Microwave; Refrigerator; Stove/Range
- Bedrooms: 3 bedrooms
- Flooring: Laminate; Carpet
- Bathrooms: 2 full bathrooms (2 bathtubs, 2 showers)
- Heating & cooling: Forced air heating; No cooling
- Interior features: Water heater; Double pane windows; Patio/porch/deck; Bath off primary; Walk-in closet
- Laundry & utility: Utility room; Electric water heater
Neighborhood map
What this means for you Summary
Snapshot
- This is a 2-bed/2.0-bath manufactured listed at $215k.
Deal economics
- At list price, monthly cash flow is $479 ($6k/yr) — positive.
- The deal already cash-flows at list — no discount required.
- Meets the 1% rule at list price ($2k rent vs $215k).
- Recommended offer: $209k (3.0% below list) — sets the bar for market timing.
- Cap rate 9.0% vs local median 3.0% in Marysville — top-decile yield for the area; either an underpriced asset or a hidden risk that comps aren't pricing in. Stress-test before assuming the spread holds.
Location & tenants
- Location reads 84/100 on livability (#43 in WA, #768 nationally) — a professional / high-income tenant draw. Strengths: commute A+, employment A+, housing A+; Watch: cost of living F.
- Marysville School District (suburban): math 36% / reading 51% proficiency, ranked #177 of 291 in WA (top 61%) — families likely to look elsewhere, expect single-tenant / working-renter base with shorter leases.
- Market conditions: Rents rising (+1.7%/yr); 430 active listings in the ZIP; 34 comparable units currently listed for rent nearby; rentals at typical pace (median 25d on market — plan ~3-4 weeks tenant-placement turnaround); solid renter incomes; 3,982 units permitted in Snohomish County in 2024 (1,492 in 5+ unit buildings).
Forward outlook
- Local home prices are declining (-3.0%/yr); year-one equity from $1k of loan paydown is wiped out by about $6k of value loss. Plan a longer hold.
- Snohomish County population projected at +30% by 2050 — long-run rental-demand tailwind backs the buy-and-hold thesis.
Negotiation context
- It's been on market 35 days — a 3% lower offer ($209k) is reasonable based on typical stale-listing flexibility.
- 4 sale attempts since 22y ago with the ask held roughly flat each time — persistent listings suggest the price (not the market) is what's stuck; bring a comps-based counter.
- Current owner paid $180k; 20% above their basis — modest negotiation headroom, anchor on the comps not their cost.
Questions for the listing agent
- It's been on market 35 days. Have you received any prior offers? Is the seller open to a 3% concession, seller financing, or rate buy-down credit?
- Is there a deadline driving the sale (1031 exchange, divorce, estate, relocation)? That informs how much negotiation room exists.
- Schools are B-rated — typically a magnet for longer-tenancy family renters. What's the average tenant stay here, and is there a school-zone premium baked into asking?
- What's the average days-on-market for RENTAL listings here right now (not sales)? A rising rental-DOM trend means longer vacancies and softer asking-rent achievability than the comps imply.
- What's the recent tenant-quality profile in this submarket — average credit score on applications, eviction rate, late-payment / NSF rate, and stable-employment percentage? A property-management company in the area should have these aggregated.
- How much new for-sale + rental construction is in the pipeline within 1–3 miles? Heavy new supply typically softens prices + rents 12–24 months out; constrained supply supports both.
Investment metrics
- 1% rule
- 1.04% ✓
- Cap rate
- 8.97%
- Cash-on-cash
- 9.56%
- DSCR
- 1.43
- GRM
- 8.0
CMA / ARV
- ARV (median comp)
- $99,950
- List price
- $215,000
- Delta
- 115.11%
- Verdict
- OVERPRICED
- Comps
- 11 within 1.0 mi
Show comp detail 7 sales within ~0.75 mi
| Address | Dist | Beds/Ba | Sqft | Sold | Price | $/sf | Match |
|---|---|---|---|---|---|---|---|
| 4401 80th St NE Unit Sp 38 | 0.52mi | 2/2.0 | 1,056 (-6%) | 11mo | $175,000 | $166 | 56 |
| 4000 76th St NE #95 | 0.27mi | 2/1.0 | 1,008 (-11%) | 20mo | $135,000 | $134 | 49 |
| 8515 State Ave #4 | 0.70mi | 2/2.0 | 1,244 (+10%) | 3mo | $95,000 | $76 | 48 |
| 8515 State Ave #64 | 0.70mi | 2/2.0 | 1,150 (+2%) | 20mo | $115,000 | $100 | 47 |
| 8515 State Ave #66 | 0.70mi | 3/2.0 (+1) | 1,182 (+5%) | 11mo | $130,000 | $110 | 46 |
| 8515 State Ave #54 | 0.70mi | 3/2.0 (+1) | 1,188 (+5%) | 11mo | $142,500 | $120 | 45 |
| 8515 State Ave NE #74 | 0.70mi | 3/2.0 (+1) | 1,248 (+11%) | 2mo | $215,000 | $172 | 43 |
Match score weights: distance 35% · size 25% · config 20% · recency 20%. Top-matched comps best support the ARV.
Projected returns pro-forma
-3.0% appreciation · 1.66% rent growth · sell at horizon
- IRR
- -3.3%
- Equity multiple
- 0.88×
- Total profit
- $-7,376
- Equity at exit
- $32,057
- IRR
- 4.9%
- Equity multiple
- 1.34×
- Total profit
- $20,629
- Equity at exit
- $18,589
Cash invested: $60,200 (down + closing). Projections, not guarantees.
Landlord ↔ Tenant lean methodology
- Overall (STATE)
- 28 Tenant-Leaning
- State Washington
- 28 Tenant-Leaning · D+8
- County
- — inherits STATE
- City
- — inherits STATE
ZIP-level market 98270
- Rents YoY
- 1.7%
- Active inventory
- 430
- Price-to-rent
- 8.0×
Monthly cashflow live
- Estimated rent
- $2,242 high interval (Pro) →
- Mortgage (P&I)
- −$1,127
- Tax from tax record
- −$75 /mo · $897/yr
- Insurance
- −$90
- HOA
- −$0
- Vacancy / Maint / Mgmt
- −$471
- Net cashflow
- $479
Break-even live
UW: 25.0% down · 7.5% · 30yr · 1.5% tax · 5.0% vac · 8.0% maint · 8.0% mgmt
Financing live
Cash to close
- Down payment
- $53,750
- Closing costs
- $6,450
- Reserves months
- —
- Total cash needed
- —
Loan-product check · same deal, 3 products live
Conventional
25% down · 7.5% · 30yr
- Down + closing
- —
- Monthly P&I
- —
- Monthly cashflow
- —
- DSCR
- —
- Eligible?
- —
Personal DTI + credit; lowest rate.
DSCR
20% down · 8.5% · 30yr
- Down + closing
- —
- Monthly P&I
- —
- Monthly cashflow
- —
- DSCR
- —
- Eligible?
- —
No personal income docs; deal must DSCR.
Hard money
10% down · 12.0% · 12mo
- Down + closing
- —
- Monthly P&I
- —
- Monthly cashflow
- —
- DSCR
- —
- Eligible?
- —
Short-term bridge; refi at stabilization.
Rent comps 34 comps
| Address | Beds | Baths | Sqft | Rent | $/sqft | DOM | Units | Dist |
|---|---|---|---|---|---|---|---|---|
| 7234 47th Ave NE Marysville, WA | 2.0 | 1.0 | 950 | $2,018 | $2.12 | 5d | 2 | 0.14mi |
| 4817 76th St NE Marysville, WA | 2.0 | 1.5 | 995 | $1,895 | $1.90 | 43d | 1 | 0.20mi |
| 7119 47th Ave NE Marysville, WA | 3.0 | 1.0 | 1125 | $1,950 | $1.73 | 15d | 1 | 0.23mi |
| 4602 80th St NE Marysville, WA | 1.0–2.0 | 1.0–2.0 | 777 | $1,975 | $2.54 | 5d | 3 | 0.25mi |
| 7111 47th Ave NE Marysville, WA | 2.0 | 1.0 | 637 | $2,025 | $3.18 | 5d | 3 | 0.26mi |
| 7126 49th Dr NE Unit 4 Marysville, WA | 2.0 | 1.0 | 820 | $1,495 | $1.82 | 20d | 1 | 0.29mi |
| 7015 47th Ave NE Marysville, WA | 1.0–2.0 | 1.0 | 802 | $1,650 | $2.06 | 12d | 3 | 0.31mi |
| 7625 51st Ave NE Unit A Marysville, WA | 2.0 | 2.5 | 1286 | $2,195 | $1.71 | 22d | 1 | 0.34mi |
| 1100 Columbia Ave Marysville, WA | 1.0–2.0 | 1.0 | 759 | $1,825 | $2.40 | 2d | 3 | 0.34mi |
| 4521 80th St NE Marysville, WA | 1.0–2.0 | 1.0–1.5 | 881 | $2,150 | $2.44 | 5d | 3 | 0.35mi |
| 1266 Woodgate Ave Unit B Marysville, WA | 2.0 | 1.0 | 950 | $1,750 | $1.84 | 24d | 1 | 0.45mi |
| 1310 Cedar Ave Marysville, WA | 1.0–2.0 | 1.0 | 778 | $2,055 | $2.64 | 43d | 7 | 0.49mi |
| 1270 Cedar Ave Unit 1 Marysville, WA | 2.0 | 1.0 | 945 | $1,875 | $1.98 | 43d | 1 | 0.51mi |
| 4407 84th St NE Marysville, WA | 3.0 | 2.5 | 1452 | $3,098 | $2.13 | 2d | 20 | 0.58mi |
| 1729 8th St Marysville, WA | 2.0 | 1.0 | 700 | $2,300 | $3.29 | 22d | 1 | 0.59mi |
| 1298 Beach Ave Marysville, WA | 2.0 | 1.0 | 1143 | $2,950 | $2.58 | 43d | 1 | 0.59mi |
| 804 Columbia Ave Unit 5 Marysville, WA | 2.0 | 1.0 | 850 | $1,695 | $1.99 | 24d | 1 | 0.63mi |
| 1024 Cedar Ave Apt B Marysville, WA | 2.0 | 1.0 | 1020 | $1,795 | $1.76 | 43d | 1 | 0.64mi |
| 1345 Beach Ave Unit B Marysville, WA | 3.0 | 2.5 | 1125 | $2,100 | $1.87 | 43d | 1 | 0.66mi |
| 1031 Cedar Ave Unit 102 Marysville, WA | 3.0 | 2.5 | 1200 | $2,395 | $2.00 | 43d | 1 | 0.67mi |
| 5705 Grove St Apt 8 Marysville, WA | 2.0 | 1.0 | 980 | $1,995 | $2.04 | 2d | 1 | 0.68mi |
| 1404 9th St Marysville, WA | 2.0 | 2.0 | 841 | $2,345 | $2.79 | 18d | 1 | 0.70mi |
| 1518 7th St #4 Marysville, WA | 2.0 | 1.0 | 900 | $1,595 | $1.77 | 18d | 1 | 0.74mi |
| 5127 61st St NE Marysville, WA | 2.0 | 2.0 | 1232 | $2,795 | $2.27 | 18d | 1 | 0.89mi |
| 5121 88th St NE Unit B Marysville, WA | 3.0 | 2.0 | 1170 | $3,500 | $2.99 | 43d | 1 | 0.93mi |
| 9114 44th Dr NE #1 Marysville, WA | 2.0 | 1.0 | 1006 | $2,095 | $2.08 | 24d | 1 | 1.00mi |
| 1830 1st St Marysville, WA | 2.0 | 1.0 | 709 | $1,595 | $2.25 | 43d | 1 | 1.02mi |
| 1926 1st St Apt C Marysville, WA | 2.0 | 1.0 | 933 | $1,595 | $1.71 | 43d | 1 | 1.02mi |
| 6300 Grove St Unit A Marysville, WA | 2.0 | 1.0 | 1005 | $3,100 | $3.08 | 43d | 1 | 1.06mi |
| 6514 69th St NE Marysville, WA | 3.0 | 2.0 | 1317 | $3,700 | $2.81 | 43d | 1 | 1.27mi |
| 6110 64th St NE Marysville, WA | 1.0–3.0 | 1.0–2.0 | 867 | $1,885 | $2.17 | 1d | 2 | 1.28mi |
| 6526 67th Pl NE Marysville, WA | 3.0 | 2.0 | 1120 | $3,100 | $2.77 | 43d | 1 | 1.32mi |
| 5828 93rd Pl NE Marysville, WA | 3.0 | 1.0 | 912 | $2,000 | $2.19 | 24d | 1 | 1.36mi |
| 8700 67th Ave NE Marysville, WA | 2.0–3.0 | 2.0 | 999 | $1,995 | $2.00 | 5d | 2 | 1.45mi |
Listing history 25 events
-
2026-06-18days on market $215,000 Active 35 DOM
-
2026-06-17days on market $215,000 Active 34 DOM
-
2026-06-16days on market $215,000 Active 33 DOM
-
2026-06-15days on market $215,000 Active 32 DOM
-
2026-06-13pricedays on market $215,000 Active 30 DOM
-
2026-06-09days on market $220,000 Active 26 DOM
-
2026-06-08days on market $220,000 Active 25 DOM
-
2026-06-07days on market $220,000 Active 24 DOM
-
2026-06-04days on market $220,000 Active 21 DOM
-
2026-06-03days on market $220,000 Active 20 DOM
-
2026-06-02days on market $220,000 Active 19 DOM
-
2026-06-01days on market $220,000 Active 18 DOM
-
2026-05-31days on market $220,000 Active 17 DOM
-
2026-05-05$220,000 Active
-
2023-03-22soldstatus $179,900 Closed
-
2023-03-02status Pending
-
2023-03-01soldstatus $179,900 Closed
-
2023-02-18status Pending
-
2022-11-10price $179,900
-
2022-09-26$185,000 Active
-
2010-05-21soldstatus $20,000 Sold
-
2010-04-22status Pending
-
2010-03-16$24,950 Active
-
2004-06-23soldstatus $23,000
-
2004-03-22$31,000
ⓘ Source: listings_history table (triggers on properties + properties_extension) + one-shot
backfill from property_details.listing_events for pre-trigger history.
Tax reassessment forecast WA · Resets to sale price
- Current annual tax
- $897 · $75/mo
- Projected year-2 tax
- $2,107 · $176/mo
- Expected delta
- +$1,210/yr (+$101/mo · 134.9%)
ⓘ Screening estimate from a state-policy table — verify with the county assessor before closing.
Nearby sold comps map
Loading sold comps map…
Walkable amenities ~0.75 mi
Loading nearby amenities…
Taxation est. · year 1
- Rental income
- $26,904
- − Mortgage interest
- −$12,043
- − Property taxes
- −$897
- − Insurance
- −$1,075
- − Repairs & maintenance
- −$2,152
- − Management
- −$2,152
- − Depreciation
- −$6,255
- Taxable income
- $2,330
- Est. tax owed @ 24.0%
- −$559
- After-tax cash flow
- $5,193/yr
For passive investors: Depreciation is non-cash, so a rental often shows a tax loss while cash-flowing — sheltering income. Rental losses are passive: they offset passive income freely, and up to $25,000/yr can offset ordinary (W-2) income if you actively participate and your MAGI is under $100k (phasing out to $0 by $150k); unused losses carry forward. On sale, claimed depreciation is recaptured at up to 25%, and gains may owe capital-gains tax (a 1031 exchange can defer both). Figures are a year-1 estimate at your 24.0% rate — not tax advice; consult a CPA.
Schools (NCES district)
- District
- Marysville School District
- NCES district ID
- 5304860
- Math proficiency
- 36% ▼ -1.00%
- Reading proficiency
- 51% ▲ 2.00%
- Median HH income
- $67,461
- Composite
- 41.31/100
- National rank
- #7367
- State rank
- #177 of 291 in WA
Livability — Marysville
- Score
- 84/100
- State rank
- #43
- US rank
- #768
Category grades
Schools grade is shown separately in the Schools card above.
Census & demographics
- Census place
- Marysville, WA
- County
- Snohomish County · 786,756 people
- City population
- 85,887
- Metro
- Seattle-Tacoma-Bellevue, WA
- Population (ZIP)
- 55,049
- Household income
- $108,147
- Rent vs Own
- Severe rent burden
- 1150.0
Population outlook (Snohomish County) Hauer SSP2
- Today (2025)
- 899,800 people
- By 2030
- 960,975 · +6.8%
- By 2040
- 1,074,447 · +19.4%
- By 2050
- 1,171,954 · +30.2%
- By 2075
- 1,384,849 · +53.9%
- By 2100
- 1,497,296 · +66.4%
Race, ethnicity, and origin ACS 2023
- Neighborhood character
- Diverse neighborhood (Simpson 0.55)
- Race & ethnicity
- White 64% Hispanic / Latino 17% Two or more races 14% Asian 8% Black 3% Native American 2%
- Hispanic origin (detail)
- Mexican 13%
- Common ancestry
- Portuguese 5% Italian 3% Lithuanian 2%
- Foreign-born
- 14% · Canada, China, Vietnam
- Languages at home
- 79% English-only · Spanish 9% Russian/Polish/Slavic 4% Tagalog/Filipino 2%
Political lean MEDSL · Snohomish
- 2024 margin
- D (+19.0) · D 57.8% · R 38.9% · Other 3.3%
- 2008→2024 swing
- +0.1pp no change · 2008: 18.9pp · 2024: 19.0pp
- All cycles
- 2024: D+19.0 2020: D+20.6 2016: D+16.6 2012: D+16.2 2008: D+18.9
Not yet ingested
- Civics
- —
Market trends
- HPI YoY
- ▼ -673.52%
- Current HPI
- 321.1535
- Rent YoY
- ▲ 1.66%
- Metro
- Seattle-Tacoma-Bellevue, WA
- State GDP YoY
- ▲ 4.65%
- F500 in state
- 22
Industry mix (Fortune 500 HQ in WA)
| Industry | F500 HQs | Revenue |
|---|---|---|
| Retail | 2 | $269B |
|
||
| Technology / Retail | 1 | $638B |
|
||
| Technology | 1 | $245B |
|
||
| Telecommunications | 1 | $38B |
|
||
| Food / Beverage | 1 | $36B |
|
||
| Automotive / Trucks | 1 | $34B |
|
||
Price history
+593.5% since first listed13 events — show timeline
- 2026-06-11 Price Changed $215,000 NWMLS as Distributed by MLS Grid
- 2026-05-05 Listed $220,000 NWMLS as Distributed by MLS Grid
- 2023-03-22 Sold (MLS) $179,900 NWMLS as Distributed by MLS Grid
- 2023-03-02 Pending — NWMLS as Distributed by MLS Grid
- 2023-03-01 Sold (MLS) $179,900 NWMLS as Distributed by MLS Grid
- 2023-02-18 Pending — NWMLS as Distributed by MLS Grid
- 2022-11-10 Price Changed $179,900 NWMLS as Distributed by MLS Grid
- 2022-09-26 Listed $185,000 NWMLS as Distributed by MLS Grid
- 2010-05-21 Sold (MLS) $20,000 NWMLS as Distributed by MLS Grid
- 2010-04-22 Pending — NWMLS as Distributed by MLS Grid
- 2010-03-16 Listed $24,950 NWMLS as Distributed by MLS Grid
- 2004-06-23 Sold (MLS) $23,000 NWMLS as Distributed by MLS Grid
- 2004-03-22 Listed $31,000 NWMLS as Distributed by MLS Grid
Property tax history
+6.5%/yrLatest (2026): $897 · -4.7% YoY. Source: county tax records.
Cash-flow waterfall
monthlySold comps — $/sqft
last 12 mo · ≤1 miLoading sold comps…