 Duplex
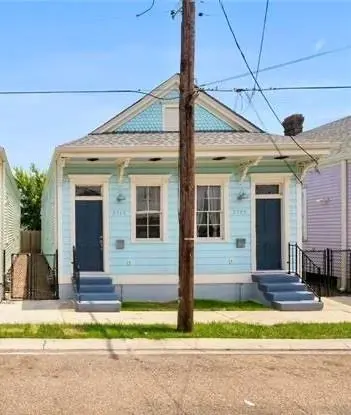
2709-11 3rd St · New Orleans, LA
Flood risk No data
- FEMA flood zone
- —
- Chance of flooding over 30 yrs
- —
- Est. flood insurance / yr
- —
Fire risk No data
- Est. fire insurance / yr
- —
Heat risk No data
- Hot days now (above threshold)
- —
- Hot days in 30 yrs
- —
Wind risk No data
- Chance of severe wind over 30 yrs
- —
Air-quality risk No data
- Unhealthy air days now
- —
- Unhealthy air days in 30 yrs
- —
Risk factors via First Street. Map © Google.
Why this score? — see what drove the C- grade
The composite is a weighted blend of 9 inputs, each scored 0–100. Each bar is that input's sub-score; the figure is the points it added to the 100-point composite (weight × sub-score).
- Cash flow +17.6/30.0
- Appreciation +10.0/10.0
- DSCR +5.5/10.0
- 1% rule +4.8/10.0
- Rent growth +4.0/5.0
- Livability +4.0/5.0
- Condition / age +4.0/5.0
- Schools +1.6/10.0
- ARV discount +0.0/15.0
$259,000
🖨 Deal sheet (PDF) 📄 Offer letter ✓ Due diligence
Multi-family units
County records classify this as Multi-Family (2-4 Unit). Listing-text estimate: 2 units. confirmed
Listing remarks MLS
Beautiful Historic Duplex in Central City Renovated to the studs in 2018, New Electric, New Plumbing, New HVAC, New Roof, New Hot Water Heaters. This is a Perfect Owner Occupied or Turn Key Investment property offering, hard wood floors and high end finishes. Each Unit Contains Washer and Dryer, Granite Counter Tops, and high ceilings. A MUST SEE! Can be Sold as package deal with 2713-15 Third St and 2705-07 Third St. All measurements approximate not guaranteed
Key facts
- New plumbing
- New hvac
- New electric
Tags
Neighborhood map
What this means for you Summary
Snapshot
- This is a 2 × 2-bed/1-bath units multifamily listed at $259k. Condition is rated good.
Deal economics
- At list price, monthly cash flow is $206 ($2k/yr) — positive. Per door: $103/mo.
- The deal already cash-flows at list — no discount required.
- To meet the 1% rule (rent ≥ 1% of price), the offer needs to be $253k (2.5% below list).
- Recommended offer: $236k (9.0% below list) — sets the bar for market timing.
- Cap rate 7.2% vs local median 4.4% in New Orleans — top-decile yield for the area; either an underpriced asset or a hidden risk that comps aren't pricing in. Stress-test before assuming the spread holds.
Location & tenants
- Location reads 81/100 on livability (#3 in LA, #1,383 nationally) — a professional / high-income tenant draw. Strengths: amenities A+, commute A+, health & safety A+; Watch: crime C-, employment D.
- Orleans Parish (urban): math 11% / reading 27% proficiency, ranked #69 of 98 in LA (top 70%) — low school quality limits family demand, transient renter base, plan for 1-2y turnover; 68% free/reduced lunch — lower-income household profile, screen leases tightly.
- Zoned schools: Benjamin Franklin Elem. Math And Science (math 12% / reading 23%, grade F, #479 of 646 statewide, top 75%, 747 students, 98% FRL, charter) — zoned schools average 98% FRL vs 68% district-wide (30 pts higher); higher-poverty schools than district average — tighter screening recommended.
- Market conditions: Rents rising fast (+6.0%/yr); 134 active listings in the ZIP; 40 comparable units currently listed for rent nearby; rentals at typical pace (median 26d on market — plan ~3-4 weeks tenant-placement turnaround); lower-income renter base — watch delinquency; 710 units permitted in Orleans Parish in 2024 (244 in 5+ unit buildings).
- At $2,526/mo this rent would consume 77% of the median local household income ($39k/yr) (locally 714% of renters already pay >50% of income on rent) — very limited rent-growth headroom before tenants either downsize or default.
Forward outlook
- In year one you build about $28k of equity ($2k loan paydown + $26k appreciation (10.0% local appreciation)).
- Orleans County population projected at +61% by 2050 — long-run rental-demand tailwind backs the buy-and-hold thesis.
- At projected returns (10.0% appreciation + 6.0% rent growth), your $73k cash investment doubles in ~3 years — after that, you're playing with house money.
- By year 2, paydown + projected appreciation supports a ~$45k cash-out refi (75% LTV) — recoverable capital for the next deal without selling this one.
Negotiation context
- It's been on market 110 days — a 9% lower offer ($236k) is reasonable based on typical stale-listing flexibility.
- 6 sale attempts since 4y ago with the ask held roughly flat each time — persistent listings suggest the price (not the market) is what's stuck; bring a comps-based counter.
Questions for the listing agent
- It's been on market 110 days. Have you received any prior offers? Is the seller open to a 9% concession, seller financing, or rate buy-down credit?
- Can we see the unit-by-unit rent roll, current vacancy, and any below-market leases? What's the average tenancy length?
- What capital expenditures (roof, boiler, parking lot, exteriors) have been made in the last 5 years, and what's planned in the next 2?
- Why hasn't it sold? Are there any deal-killer items the seller is aware of (foundation, flood, title, zoning, code violations)?
- Is there a deadline driving the sale (1031 exchange, divorce, estate, relocation)? That informs how much negotiation room exists.
- What's the average days-on-market for RENTAL listings here right now (not sales)? A rising rental-DOM trend means longer vacancies and softer asking-rent achievability than the comps imply.
- What's the recent tenant-quality profile in this submarket — average credit score on applications, eviction rate, late-payment / NSF rate, and stable-employment percentage? A property-management company in the area should have these aggregated.
- How much new apartment / multifamily construction is in the pipeline within 1–3 miles? Heavy new supply (>2% of stock underway) typically softens rents 12–24 months out; light construction supports rent growth.
Investment metrics
- 1% rule
- 0.98% ✗
- Cap rate
- 7.25%
- Cash-on-cash
- 3.40%
- DSCR
- 1.15
- GRM
- 8.5
CMA / ARV
- ARV (median comp)
- $199,094
- List price
- $259,000
- Delta
- 30.09%
- Verdict
- OVERPRICED
- Comps
- 20 within 1.0 mi
Show comp detail 3 sales within ~0.75 mi
| Address | Dist | Beds/Ba | Sqft | Sold | Price | $/sf | Match |
|---|---|---|---|---|---|---|---|
| 2304-06 6th St | 0.37mi | 2/2.0 | 1,183 (-3%) | 10mo | $159,900 | $135 | 69 |
| 2717 S Liberty St | 0.30mi | 2/3.0 | 1,154 (-5%) | 9mo | $72,000 | $62 | 69 |
| 2610 12 S Johnson St | 0.43mi | 1/1.0 | 1,250 (+2%) | 15mo | $42,500 | $34 | 63 |
Match score weights: distance 35% · size 25% · config 20% · recency 20%. Top-matched comps best support the ARV.
Projected returns pro-forma
10.0% appreciation · 5.98% rent growth · sell at horizon
- IRR
- 27.9%
- Equity multiple
- 3.23×
- Total profit
- $161,994
- Equity at exit
- $233,328
- IRR
- 25.2%
- Equity multiple
- 7.68×
- Total profit
- $484,670
- Equity at exit
- $503,180
Cash invested: $72,520 (down + closing). Projections, not guarantees.
Landlord ↔ Tenant lean methodology
- Overall (STATE)
- 90 Strongly Landlord-Friendly
- State Louisiana
- 90 Strongly Landlord-Friendly · R+12
- County
- — inherits STATE
- City
- — inherits STATE
ZIP-level market 70113
- Rents YoY
- 6.0%
- Active inventory
- 134
- Price-to-rent
- 17.1×
Monthly cashflow live
- Estimated rent
- $2,526 high interval (Pro) →
- Mortgage (P&I)
- −$1,358
- Tax est. 1.5%
- −$324 /mo · $3,885/yr
- Insurance
- −$108
- HOA
- −$0
- Vacancy / Maint / Mgmt
- −$530
- Net cashflow
- $206
Break-even live
Sensitivity live
| Price | -10% $385 | -5% $295 | +0% $206 | +5% $116 | +10% $27 |
|---|---|---|---|---|---|
| Rent | -10% $6 | -5% $106 | +0% $206 | +5% $305 | +10% $405 |
| Rate | -1.0pp $336 | -0.5pp $272 | base $206 | +0.5pp $139 | +1.0pp $70 |
2-unit breakdown (identical units grouped — click to expand)
| Units | Beds | Baths | Est. rent |
|---|---|---|---|
| 2× units | 2 | 1 | $2,526 |
| #1 | 2 | 1 | $1,263 |
| #2 | 2 | 1 | $1,263 |
| Total (2 units) | $2,526 | ||
UW: 25.0% down · 7.5% · 30yr · 1.5% tax · 5.0% vac · 8.0% maint · 8.0% mgmt
Financing live
Cash to close
- Down payment
- $64,750
- Closing costs
- $7,770
- Reserves months
- —
- Total cash needed
- —
Loan-product check · same deal, 3 products live
Conventional
25% down · 7.5% · 30yr
- Down + closing
- —
- Monthly P&I
- —
- Monthly cashflow
- —
- DSCR
- —
- Eligible?
- —
Personal DTI + credit; lowest rate.
DSCR
20% down · 8.5% · 30yr
- Down + closing
- —
- Monthly P&I
- —
- Monthly cashflow
- —
- DSCR
- —
- Eligible?
- —
No personal income docs; deal must DSCR.
Hard money
10% down · 12.0% · 12mo
- Down + closing
- —
- Monthly P&I
- —
- Monthly cashflow
- —
- DSCR
- —
- Eligible?
- —
Short-term bridge; refi at stabilization.
Rent comps 40 comps
| Address | Beds | Baths | Sqft | Rent | $/sqft | DOM | Units | Dist |
|---|---|---|---|---|---|---|---|---|
| 2429 Freret St New Orleans, LA | 2.0 | 1.0 | 725 | $1,300 | $1.79 | 5d | 1 | 0.13mi |
| 2503 First St New Orleans, LA | 2.0 | 1.0 | 741 | $1,200 | $1.62 | 4d | 1 | 0.16mi |
| 2503 First St New Orleans, LA | 2.0 | 1.0 | 741 | $1,200 | $1.62 | 5d | 1 | 0.16mi |
| 2213 Clara St New Orleans, LA | 1.0 | 1.0 | 750 | $900 | $1.20 | 13d | 1 | 0.20mi |
| 2628 S Derbigny St New Orleans, LA | 3.0 | 1.0 | 900 | $1,500 | $1.67 | 5d | 1 | 0.27mi |
| 2814 Josephine St Unit B New Orleans, LA | 2.0 | 1.0 | 800 | $1,149 | $1.44 | 25d | 1 | 0.29mi |
| 3108 Second St New Orleans, LA | 3.0 | 3.0 | 1216 | $2,100 | $1.73 | 5d | 1 | 0.30mi |
| 2227 Second St New Orleans, LA | 2.0 | 2.0 | 1100 | $1,900 | $1.73 | 25d | 1 | 0.30mi |
| 2225 2nd St New Orleans, LA | 3.0 | 2.0 | 1100 | $1,800 | $1.64 | 25d | 1 | 0.31mi |
| 2222 Fourth St New Orleans, LA | 2.0 | 1.5 | 937 | $1,550 | $1.65 | 25d | 1 | 0.31mi |
| 2220 4th St New Orleans, LA | 1.0 | 1.0 | 937 | $1,650 | $1.76 | 25d | 1 | 0.31mi |
| 2818 Saint Andrew St New Orleans, LA | 2.0 | 1.0 | 900 | $1,550 | $1.72 | 25d | 1 | 0.31mi |
| 3120 Second St New Orleans, LA | 3.0 | 3.0 | 1256 | $2,050 | $1.63 | 25d | 1 | 0.32mi |
| 3122 2nd St New Orleans, LA | 3.0 | 3.0 | 1206 | $2,075 | $1.72 | 25d | 1 | 0.32mi |
| 2123 S Liberty St Unit 2125 New Orleans, LA | 3.0 | 2.0 | 1500 | $2,100 | $1.40 | 5d | 1 | 0.34mi |
| 2717 Loyola Ave New Orleans, LA | 3.0 | 2.0 | 1250 | $2,300 | $1.84 | 3d | 1 | 0.34mi |
| 2717 Loyola Ave New Orleans, LA | 3.0 | 2.0 | 1232 | $2,300 | $1.87 | 25d | 1 | 0.34mi |
| 2833 S Derbigny St New Orleans, LA | 3.0 | 2.0 | 1500 | $1,795 | $1.20 | 25d | 1 | 0.35mi |
| 3204 2nd St New Orleans, LA | 3.0 | 2.0 | 850 | $1,295 | $1.52 | 25d | 1 | 0.36mi |
| 2003 Rev John Raphael Jr Way New Orleans, LA | 1.0 | 1.0 | 750 | $1,175 | $1.57 | 25d | 1 | 0.37mi |
| 2001 Reverend John Raphael Junior Way Unit 2003 New Orleans, LA | 1.0 | 1.0 | 750 | $1,175 | $1.57 | 23d | 1 | 0.37mi |
| 2822 Martin L King Bl New Orleans, LA | 1.0 | 1.0 | 715 | $1,190 | $1.66 | 25d | 1 | 0.37mi |
| 2341 S Roman St Unit U New Orleans, LA | 3.0 | 2.0 | 1000 | $1,850 | $1.85 | 25d | 1 | 0.38mi |
| 2722 Martin L King Bl New Orleans, LA | 3.0 | 2.5 | 1350 | $1,800 | $1.33 | 25d | 1 | 0.38mi |
| 2329 Felicity St New Orleans, LA | 1.0 | 1.0 | 717 | $1,175 | $1.64 | 25d | 1 | 0.39mi |
| 2107 Fourth St New Orleans, LA | 3.0 | 1.0 | 1292 | $1,775 | $1.37 | 18d | 1 | 0.40mi |
| 2013 S Liberty St Apt 202 New Orleans, LA | 2.0 | 1.0 | 750 | $1,075 | $1.43 | 13d | 1 | 0.40mi |
| 2013 S Liberty St Unit 304 New Orleans, LA | 2.0 | 1.0 | 700 | $1,095 | $1.56 | 16d | 1 | 0.40mi |
| 2526 Martin Luther King Junior Blvd New Orleans, LA | 3.0 | 2.0 | 1200 | $2,200 | $1.83 | 5d | 1 | 0.42mi |
| 1614 Rev John Raphael Jr Way New Orleans, LA | 3.0 | 2.0 | 1000 | $1,500 | $1.50 | 25d | 1 | 0.43mi |
| 3435 Magnolia St New Orleans, LA | 3.0 | 1.0 | 1050 | $1,500 | $1.43 | 25d | 1 | 0.43mi |
| 1527 Reverend John Raphael Junior Way Unit A New Orleans, LA | 1.0 | 1.0 | 700 | $1,175 | $1.68 | 5d | 1 | 0.44mi |
| 1527 Reverend John Raphael Junior Way Unit A New Orleans, LA | 1.0 | 1.0 | 700 | $1,175 | $1.68 | 13d | 1 | 0.44mi |
| 3322 Third St New Orleans, LA | 3.0 | 2.0 | 950 | $1,450 | $1.53 | 25d | 1 | 0.44mi |
| 2223 Saint Andrew St New Orleans, LA | 1.0 | 1.0 | 800 | $1,250 | $1.56 | 25d | 1 | 0.45mi |
| 2605 Danneel St Unit A New Orleans, LA | 2.0 | 1.0 | 830 | $1,350 | $1.63 | 25d | 1 | 0.46mi |
| 2119 Josephine St New Orleans, LA | 3.0 | 1.0 | 1017 | $950 | $0.93 | 23d | 1 | 0.46mi |
| 3218 Jackson Ave New Orleans, LA | 3.0 | 2.0 | 1267 | $1,750 | $1.38 | 25d | 1 | 0.47mi |
| 2615 S Johnson St New Orleans, LA | 2.0 | 1.0 | 1200 | $1,400 | $1.17 | 25d | 1 | 0.47mi |
| 2615 S Johnson St New Orleans, LA | 2.0 | 1.0 | 1200 | $1,350 | $1.12 | 18d | 1 | 0.47mi |
Listing history 22 events
-
2026-06-21days on market $259,000 Active 110 DOM
-
2026-06-18days on market $259,000 Active 107 DOM
-
2026-06-17days on market $259,000 Active 106 DOM
-
2026-06-16days on market $259,000 Active 105 DOM
-
2026-06-15days on market $259,000 Active 104 DOM
-
2026-06-13days on market $259,000 Active 102 DOM
-
2026-06-10days on market $259,000 Active 99 DOM
-
2026-06-09days on market $259,000 Active 98 DOM
-
2026-06-08days on market $259,000 Active 97 DOM
-
2026-06-07days on market $259,000 Active 96 DOM
-
2026-06-05days on market $259,000 Active 93 DOM
-
2026-06-03days on market $259,000 Active 92 DOM
-
2026-06-02days on market $259,000 Active 91 DOM
-
2026-06-01days on market $259,000 Active 90 DOM
-
2026-05-31days on market $259,000 Active 89 DOM
-
2026-04-23price $259,000 465-char remark
Show marketing remark (465 chars)
Beautiful Historic Duplex in Central City Renovated to the studs in 2018, New Electric, New Plumbing, New HVAC, New Roof, New Hot Water Heaters. This is a Perfect Owner Occupied or Turn Key Investment property offering, hard wood floors and high end finishes. Each Unit Contains Washer and Dryer, Granite Counter Tops, and high ceilings. A MUST SEE! Can be Sold as package deal with 2713-15 Third St and 2705-07 Third St. All measurements approximate not guaranteed
-
2026-02-23$265,000 Active 465-char remark
Show marketing remark (465 chars)
Beautiful Historic Duplex in Central City Renovated to the studs in 2018, New Electric, New Plumbing, New HVAC, New Roof, New Hot Water Heaters. This is a Perfect Owner Occupied or Turn Key Investment property offering, hard wood floors and high end finishes. Each Unit Contains Washer and Dryer, Granite Counter Tops, and high ceilings. A MUST SEE! Can be Sold as package deal with 2713-15 Third St and 2705-07 Third St. All measurements approximate not guaranteed
-
2025-06-05$265,000 Active
-
2024-11-20$275,000 Active
-
2024-02-06$275,000
-
2023-01-25$275,000
-
2022-09-19$275,000
ⓘ Source: listings_history table (triggers on properties + properties_extension) + one-shot
backfill from property_details.listing_events for pre-trigger history.
Nearby sold comps map
Loading sold comps map…
Walkable amenities ~0.75 mi
Loading nearby amenities…
Taxation est. · year 1
- Rental income
- $30,312
- − Mortgage interest
- −$14,508
- − Property taxes
- −$3,885
- − Insurance
- −$1,295
- − Repairs & maintenance
- −$2,425
- − Management
- −$2,425
- − Depreciation
- −$7,535
- Taxable loss
- −$1,760
- Est. tax savings @ 24.0%
- +$423
- After-tax cash flow
- $2,890/yr
For passive investors: Depreciation is non-cash, so a rental often shows a tax loss while cash-flowing — sheltering income. Rental losses are passive: they offset passive income freely, and up to $25,000/yr can offset ordinary (W-2) income if you actively participate and your MAGI is under $100k (phasing out to $0 by $150k); unused losses carry forward. On sale, claimed depreciation is recaptured at up to 25%, and gains may owe capital-gains tax (a 1031 exchange can defer both). Figures are a year-1 estimate at your 24.0% rate — not tax advice; consult a CPA.
Condition & rehab AI · 10 photos
This renovated duplex is in excellent condition with new finishes and systems, offering a move-in-ready investment opportunity.
Value-add opportunities
- Both Paint exterior trim and doors — Enhances curb appeal and value.
- Both Replace window treatments — Freshens look and improves energy efficiency.
- Both Install smart home devices — Enhances convenience and marketability.
- Both Add outdoor lighting — Improves safety and curb appeal.
- Both Upgrade flooring in bathrooms — Enhances aesthetics and value.
- Both Install smart thermostat — Saves energy and improves comfort.
Renovation cost estimate screening
Value-add ROI direction
- Both Paint exterior trim and doors — Enhances curb appeal and value. ↑
- Both Replace window treatments — Freshens look and improves energy efficiency. ↑
- Both Install smart home devices — Enhances convenience and marketability. ↑
- Both Add outdoor lighting — Improves safety and curb appeal. ↑
- Both Upgrade flooring in bathrooms — Enhances aesthetics and value. ↑
- Both Install smart thermostat — Saves energy and improves comfort. ↑
ⓘ Cost ranges are severity-bucket heuristics (US national rule-of-thumb). Get contractor quotes + a written scope before underwriting a rehab budget.
Schools (NCES district)
- District
- Orleans Parish
- NCES district ID
- 2201170
- Math proficiency
- 11% ▼ -52.00%
- Reading proficiency
- 27% ▼ -46.00%
- Median HH income
- $37,011
- Composite
- 15.78/100
- National rank
- #9271
- State rank
- #69 of 98 in LA
Livability — New Orleans
- Score
- 81/100
- State rank
- #3
- US rank
- #1383
Category grades
Schools grade is shown separately in the Schools card above.
Census & demographics
- Census place
- New Orleans, LA
- County
- Orleans Parish · 338,817 people
- City population
- 338,817
- Metro
- New Orleans-Metairie, LA
- Population (ZIP)
- 9,387
- Household income
- $39,333
- Rent vs Own
- Severe rent burden
- 714.0
Population outlook (Orleans County) Hauer SSP2
- Today (2025)
- 513,025 people
- By 2030
- 575,781 · +12.2%
- By 2040
- 700,174 · +36.5%
- By 2050
- 826,541 · +61.1%
- By 2075
- 1,123,374 · +119.0%
- By 2100
- 1,355,609 · +164.2%
Race, ethnicity, and origin ACS 2023
- Neighborhood character
- Diverse neighborhood (Simpson 0.57)
- Race & ethnicity
- Black 61% White 20% Hispanic / Latino 13% Two or more races 11% Asian 2%
- Hispanic origin (detail)
- Mexican 2%
- Common ancestry
- Lithuanian 2% Portuguese 1% Slovak 1%
- Foreign-born
- 13% · Canada, Vietnam, China
- Languages at home
- 86% English-only · Spanish 11% Other Indo-European 1% Vietnamese 1%
Political lean MEDSL · Orleans
- 2024 margin
- Solid D (+67.0) · D 82.2% · R 15.2% · Other 2.7%
- 2008→2024 swing
- +6.7pp toward D · 2008: 60.3pp · 2024: 67.0pp
- All cycles
- 2024: D+67.0 2020: D+68.2 2016: D+66.2 2012: D+62.5 2008: D+60.3
Not yet ingested
- Civics
- —
Market trends
- HPI YoY
- ▲ 65.92%
- Current HPI
- 229.3968
- Rent YoY
- ▲ 5.98%
- Metro
- New Orleans-Metairie, LA
- State GDP YoY
- ▲ 3.29%
- F500 in state
- 10
Industry mix (Fortune 500 HQ in LA)
| Industry | F500 HQs | Revenue |
|---|---|---|
| Telecommunications | 2 | $23B |
|
||
| Utilities | 1 | $12B |
|
||
| Wholesale / Distribution | 1 | $5B |
|
||
| Advertising | 1 | $2B |
|
||
Price history
-5.8% since first listed7 events — show timeline
- 2026-04-23 Price Changed $259,000 AcadianaMLS
- 2026-02-23 Listed $265,000 AcadianaMLS
- 2025-06-05 Listed $265,000 AcadianaMLS
- 2024-11-20 Listed $275,000 AcadianaMLS
- 2024-02-06 Listed $275,000 AcadianaMLS
- 2023-01-25 Listed $275,000 AcadianaMLS
- 2022-09-19 Listed $275,000 AcadianaMLS
Cash-flow waterfall
monthlySold comps — $/sqft
last 12 mo · ≤1 miLoading sold comps…