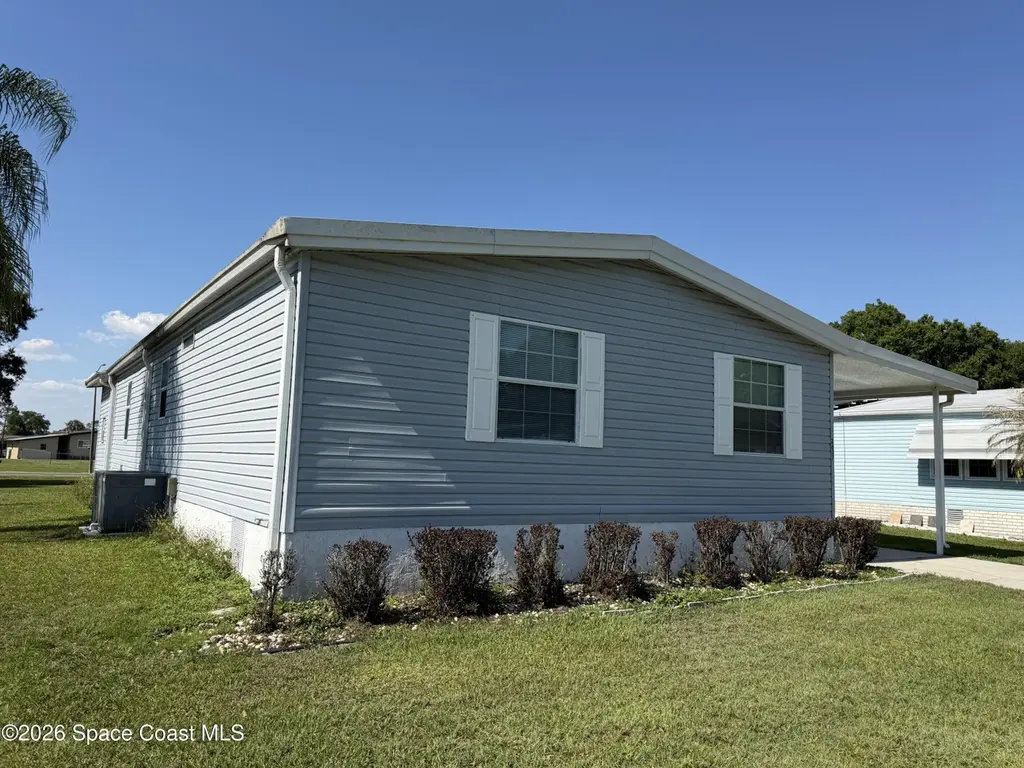
2637 Einwood Dr · Campbell, FL
Flood risk 1/10 · Minimal
- FEMA flood zone
- X (unshaded)
- Chance of flooding over 30 yrs
- 0.0%
- Est. flood insurance / yr
- $507 – $1,088
Fire risk 4/10 · Minor
- Est. fire insurance / yr
- $947 – $1,759
Heat risk 8/10 · Major
- Hot days now (above 108°F)
- 7 days/yr
- Hot days in 30 yrs
- 23 days/yr
Wind risk 9/10 · Severe
- Chance of severe wind over 30 yrs
- 99.0%
Air-quality risk 2/10 · Minimal
- Unhealthy air days now
- 0 days/yr
- Unhealthy air days in 30 yrs
- 1 days/yr
Risk factors via First Street. Map © Google.
Why this score? — see what drove the B+ grade
The composite is a weighted blend of 9 inputs, each scored 0–100. Each bar is that input's sub-score; the figure is the points it added to the 100-point composite (weight × sub-score).
- Cash flow +30.0/30.0
- ARV discount +15.0/15.0
- 1% rule +10.0/10.0
- DSCR +10.0/10.0
- Schools +3.6/10.0
- Livability +2.9/5.0
- Rent growth +2.7/5.0
- Condition / age +2.5/5.0
- Appreciation +0.0/10.0
$137,000
🖨 Deal sheet 📄 Offer letter ✓ Due diligence
Listing remarks MLS
Check out this beauitful 3 Bedroom 2 bathroom manufactured home located in the quiet, You own the land, Fee Simple, & landscape in the annual HOA fees, as well as access to the community clubhouse, pool, & recreation facilities. A brand new roof thermoplastic roofing membrane system has been installed in 2020, with permit by Osceola county. There's an attached permitted shed giving direct access to the washer, dryer, sink, & water heater, plus room for additional storage.
Key facts
- 0.17 acres
- Carport
- Enclosed porch
Tags
Property features AI
Finance
- Other: Unfurnished
- HOA & community: Association: Poinciana Village Nine Broadmoor; Annual association fee of $10
Exterior
- Parking: Carport (1 space)
- Utilities: Public sewer; Water connected; Electricity connected; Cable available
- Home design: Double wide mobile home; Single-story (main level entry)
- Construction: Vinyl siding; Mobile home construction
- Exterior features: Lot features: Other; Lot dimensions approximately 60 ft x 120 ft; Lot area about 0.17 acres; South-facing
Interior
- Kitchen: Kitchen included (main level)
- Bedrooms: 3 bedrooms, all on the main level
- Bathrooms: 2 full bathrooms
- Heating & cooling: Electric heating; Central air conditioning
- Interior features: 7 total rooms; Living room on the main level; Kitchen on the main level
Neighborhood map
What this means for you Summary
Snapshot
- This is a 3-bed/2.0-bath manufactured listed at $137k.
Deal economics
- At list price, monthly cash flow is $882 ($11k/yr) — positive.
- The deal already cash-flows at list — no discount required.
- Meets the 1% rule at list price ($2k rent vs $137k).
- Cap rate 14.0% vs local median 4.2% in Campbell — top-decile yield for the area; either an underpriced asset or a hidden risk that comps aren't pricing in. Stress-test before assuming the spread holds.
Location & tenants
- Location reads 58/100 on livability (#848 in FL) — a working-class tenant base; expect higher turnover. Strengths: cost of living A+, crime A, housing A-; Watch: schools F, amenities F, commute F.
- Osceola (suburban): math 39% / reading 45% proficiency, ranked #60 of 73 in FL (top 82%) — families likely to look elsewhere, expect single-tenant / working-renter base with shorter leases; 60% free/reduced lunch — lower-income household profile, screen leases tightly.
- Market conditions: Rents flat; 604 active listings in the ZIP; 34 comparable units currently listed for rent nearby; rentals at typical pace (median 20d on market — plan ~3-4 weeks tenant-placement turnaround); 8,813 units permitted in Osceola County in 2024 (3,072 in 5+ unit buildings).
- This rent runs 43% of the median local income ($66k/yr) — at the standard rent-burdened threshold; future hikes will face affordability resistance.
Forward outlook
- Local home prices are declining (-3.0%/yr); year-one equity from $947 of loan paydown is wiped out by about $4k of value loss. Plan a longer hold.
- Osceola County population projected at +73% by 2050 — long-run rental-demand tailwind backs the buy-and-hold thesis.
- At projected returns (-3.0% appreciation + 0.8% rent growth), your $38k cash investment doubles in ~5 years — after that, you're playing with house money.
Negotiation context
- Only 5 days on market — expect competitive offers; lowballing is unlikely to land.
- 4 sale attempts since 12y ago with the ask held roughly flat each time — persistent listings suggest the price (not the market) is what's stuck; bring a comps-based counter.
Risks & watch-outs
- Climate carrying-cost: severe wind risk, 99% chance of damaging wind over 30y; extreme-heat days projected 7→23/yr by 2055 (HVAC capex compounding) — expect insurance premiums to compound above CPI over the hold.
Questions for the listing agent
- Is there a deadline driving the sale (1031 exchange, divorce, estate, relocation)? That informs how much negotiation room exists.
- Schools are F-rated, which usually means shorter tenancies and higher turnover. Who's the typical renter profile here, and what's been the actual vacancy rate?
- What's the average days-on-market for RENTAL listings here right now (not sales)? A rising rental-DOM trend means longer vacancies and softer asking-rent achievability than the comps imply.
- What's the recent tenant-quality profile in this submarket — average credit score on applications, eviction rate, late-payment / NSF rate, and stable-employment percentage? A property-management company in the area should have these aggregated.
- How much new for-sale + rental construction is in the pipeline within 1–3 miles? Heavy new supply typically softens prices + rents 12–24 months out; constrained supply supports both.
Investment metrics
- 1% rule
- 1.74% ✓
- Cap rate
- 14.02%
- Cash-on-cash
- 27.58%
- DSCR
- 2.23
- GRM
- 4.8
CMA / ARV
- ARV (on-the-fly)
- $223,056
- Comps found
- 3
Show comp detail 3 sales within ~0.75 mi
| Address | Dist | Beds/Ba | Sqft | Sold | Price | $/sf | Match |
|---|---|---|---|---|---|---|---|
| 2631 Mcdaniel Dr | 0.10mi | 3/2.0 | 1,458 (-6%) | 8mo | $245,000 | $168 | 79 |
| 202 Ellsworth Ct | 0.35mi | 2/2.0 (-1) | 1,554 (+0%) | 12mo | $215,000 | $138 | 68 |
| 205 Albatross Way | 0.23mi | 3/2.0 | 1,352 (-13%) | 8mo | $195,000 | $144 | 62 |
Match score weights: distance 35% · size 25% · config 20% · recency 20%. Top-matched comps best support the ARV.
Projected returns pro-forma
-3.0% appreciation · 0.82% rent growth · sell at horizon
- IRR
- 19.1%
- Equity multiple
- 1.75×
- Total profit
- $28,907
- Equity at exit
- $20,427
- IRR
- 25.8%
- Equity multiple
- 3.02×
- Total profit
- $77,654
- Equity at exit
- $11,845
Cash invested: $38,360 (down + closing). Projections, not guarantees.
Landlord ↔ Tenant lean methodology
- Overall (STATE)
- 87 Strongly Landlord-Friendly
- State Florida
- 87 Strongly Landlord-Friendly · R+3
- County
- — inherits STATE
- City
- — inherits STATE
ZIP-level market 34758
- Home prices YoY
- -14.3%
- Rents YoY
- 0.8%
- Active inventory
- 604
- Price-to-rent
- 4.8×
Monthly cashflow live
- Estimated rent
- $2,386 high interval (Pro) →
- Mortgage (P&I)
- −$718
- Tax from tax record
- −$228 /mo · $2,731/yr
- Insurance
- −$57
- HOA
- −$0
- Vacancy / Maint / Mgmt
- −$501
- Net cashflow
- $882
Break-even live
UW: 25.0% down · 7.5% · 30yr · 1.5% tax · 5.0% vac · 8.0% maint · 8.0% mgmt
Financing live
Cash to close
- Down payment
- $34,250
- Closing costs
- $4,110
- Reserves months
- —
- Total cash needed
- —
Loan-product check · same deal, 3 products live
Conventional
25% down · 7.5% · 30yr
- Down + closing
- —
- Monthly P&I
- —
- Monthly cashflow
- —
- DSCR
- —
- Eligible?
- —
Personal DTI + credit; lowest rate.
DSCR
20% down · 8.5% · 30yr
- Down + closing
- —
- Monthly P&I
- —
- Monthly cashflow
- —
- DSCR
- —
- Eligible?
- —
No personal income docs; deal must DSCR.
Hard money
10% down · 12.0% · 12mo
- Down + closing
- —
- Monthly P&I
- —
- Monthly cashflow
- —
- DSCR
- —
- Eligible?
- —
Short-term bridge; refi at stabilization.
Rent comps 34 comps
| Address | Beds | Baths | Sqft | Rent | $/sqft | DOM | Units | Dist |
|---|---|---|---|---|---|---|---|---|
| 2253 Sheboygan Pl Kissimmee, FL | 3.0 | 2.0 | 1832 | $2,100 | $1.15 | 12d | 1 | 0.58mi |
| 2362 Barton Bay Ct Kissimmee, FL | 3.0 | 2.0 | 1844 | $1,950 | $1.06 | 24d | 1 | 0.61mi |
| 4497 Bluff Oak Loop Kissimmee, FL | 3.0 | 2.0 | 2115 | $2,290 | $1.08 | 3d | 1 | 0.71mi |
| 2443 Grey Hawk Dr Kissimmee, FL | 3.0 | 2.0 | 1662 | $2,450 | $1.47 | 16d | 1 | 0.82mi |
| 2449 Grey Hawk Dr Kissimmee, FL | 3.0 | 2.0 | 1662 | $2,450 | $1.47 | 16d | 1 | 0.83mi |
| 1918 Ancestry Trl Kissimmee, FL | 3.0 | 2.0 | 1432 | $2,200 | $1.54 | 24d | 1 | 0.92mi |
| 2562 Grey Hawk Dr Kissimmee, FL | 4.0 | 2.5 | 1662 | $2,650 | $1.59 | 4d | 1 | 0.97mi |
| 2566 Grey Hawk Dr Kissimmee, FL | 3.0 | 2.5 | 1662 | $2,500 | $1.50 | 4d | 1 | 0.98mi |
| 2570 Grey Hawk Dr Kissimmee, FL | 3.0 | 2.5 | 1662 | $2,500 | $1.50 | 4d | 1 | 0.98mi |
| 2574 Grey Hawk Dr Kissimmee, FL | 3.0 | 2.5 | 1662 | $2,500 | $1.50 | 4d | 1 | 0.98mi |
| 2578 Grey Hawk Dr Kissimmee, FL | 3.0 | 2.5 | 1662 | $2,500 | $1.50 | 4d | 1 | 0.99mi |
| 2578 Grey Hawk Dr Kissimmee, FL | 3.0 | 2.5 | 1662 | $2,450 | $1.47 | 20d | 1 | 0.99mi |
| 2582 Grey Hawk Dr Kissimmee, FL | 4.0 | 2.5 | 1662 | $2,650 | $1.59 | 4d | 1 | 0.99mi |
| 2571 Grey Hawk Dr Kissimmee, FL | 3.0 | 2.5 | 1662 | $2,500 | $1.50 | 16d | 1 | 1.00mi |
| 2533 Old Kent Cir Kissimmee, FL | 4.0 | 3.0 | 1888 | $2,000 | $1.06 | 15d | 1 | 1.05mi |
| 2626 Ham Brown Rd Kissimmee, FL | 3.0–4.0 | 2.5 | 1936 | $2,320 | $1.20 | 3d | 16 | 1.08mi |
| 2653 Broadwing St Kissimmee, FL | 4.0 | 2.0 | 1903 | $2,700 | $1.42 | 15d | 1 | 1.10mi |
| 4301 Twisted Twig Bnd Kissimmee, FL | 3.0 | 2.0 | 1267 | $2,300 | $1.82 | 24d | 1 | 1.18mi |
| 4269 Nightcaps Way Kissimmee, FL | 3.0 | 2.0 | 1555 | $2,500 | $1.61 | 24d | 1 | 1.19mi |
| 1918 Birnham Wood Bnd Kissimmee, FL | 3.0 | 2.0 | 1551 | $2,099 | $1.35 | 24d | 1 | 1.19mi |
| 4967 Pall Mall St Kissimmee, FL | 4.0 | 3.0 | 1741 | $2,500 | $1.44 | 4d | 1 | 1.26mi |
| 4207 Mountain Laurel Ln Kissimmee, FL | 3.0 | 2.0 | 1260 | $2,600 | $2.06 | 24d | 1 | 1.27mi |
| 4213 Patterson Cv Kissimmee, FL | 3.0 | 2.0 | 1700 | $2,490 | $1.46 | 24d | 1 | 1.27mi |
| 2359 Pocky Way Kissimmee, FL | 3.0 | 2.0 | 1560 | $2,300 | $1.47 | 24d | 1 | 1.30mi |
| 2293 Pocky Way Kissimmee, FL | 4.0 | 2.0 | 1854 | $2,490 | $1.34 | 24d | 1 | 1.31mi |
| 4327 Babbling Brook Way Kissimmee, FL | 3.0 | 2.0 | 1444 | $2,000 | $1.39 | 3d | 1 | 1.33mi |
| 4986 Thames St Kissimmee, FL | 4.0 | 3.0 | 1744 | $2,500 | $1.43 | 24d | 1 | 1.34mi |
| 1814 Lindens St Kissimmee, FL | 3.0 | 2.5 | 1463 | $2,200 | $1.50 | 24d | 1 | 1.35mi |
| 4273 Babbling Brook Way Kissimmee, FL | 3.0 | 2.0 | 1444 | $2,000 | $1.39 | 4d | 1 | 1.37mi |
| 4273 Babbling Brook Way Kissimmee, FL | 3.0 | 2.0 | 1444 | $2,000 | $1.39 | 20d | 1 | 1.37mi |
| 4391 Hazel St Kissimmee, FL | 3.0 | 2.5 | 1614 | $2,200 | $1.36 | 22d | 1 | 1.41mi |
| 4383 Hazel St Kissimmee, FL | 3.0 | 2.5 | 1616 | $2,200 | $1.36 | 24d | 1 | 1.41mi |
| 4213 Green Gables Pl Kissimmee, FL | 3.0 | 2.0 | 1555 | $2,300 | $1.48 | 24d | 1 | 1.44mi |
| 3249 Cottonwood Ct Kissimmee, FL | 4.0 | 2.5 | 1710 | $1,900 | $1.11 | 24d | 1 | 1.48mi |
Listing history 5 events
-
2026-06-13statusdays on market $137,000 Pending 5 DOM
-
2026-06-13days on market $137,000 Active 4 DOM
-
2026-06-08$137,000 Active 1 DOM
-
2026-06-08remarks 699-char remark
-
2026-06-08$137,000 Active 1 DOM
ⓘ Source: listings_history table (triggers on properties + properties_extension) + one-shot
backfill from property_details.listing_events for pre-trigger history.
Tax reassessment forecast FL · Resets to sale price
- Current annual tax
- $2,731 · $228/mo
- Projected year-2 tax
- $2,731 · $228/mo
- Expected delta
- $0/yr ($0/mo · 0.0%)
ⓘ Screening estimate from a state-policy table — verify with the county assessor before closing.
Climate risk First Street
- Flood 1/10 Low FEMA zone X (unshaded) · 0% chance over 30 yrs
- Wildfire 4/10 Moderate
- Heat 8/10 Severe 7 d/yr ≥108°F today · 23 d/yr by 30 yrs out
- Wind 9/10 Extreme 99% chance of damaging wind over 30 yrs
- Air quality 2/10 Low 0 unhealthy d/yr today · 1 by 30 yrs out
Nearby sold comps map
Loading sold comps map…
Walkable amenities ~0.75 mi
Loading nearby amenities…
Taxation est. · year 1
- Rental income
- $28,631
- − Mortgage interest
- −$7,674
- − Property taxes
- −$2,731
- − Insurance
- −$685
- − Repairs & maintenance
- −$2,290
- − Management
- −$2,290
- − Depreciation
- −$3,985
- Taxable income
- $8,974
- Est. tax owed @ 24.0%
- −$2,154
- After-tax cash flow
- $8,427/yr
For passive investors: Depreciation is non-cash, so a rental often shows a tax loss while cash-flowing — sheltering income. Rental losses are passive: they offset passive income freely, and up to $25,000/yr can offset ordinary (W-2) income if you actively participate and your MAGI is under $100k (phasing out to $0 by $150k); unused losses carry forward. On sale, claimed depreciation is recaptured at up to 25%, and gains may owe capital-gains tax (a 1031 exchange can defer both). Figures are a year-1 estimate at your 24.0% rate — not tax advice; consult a CPA.
Schools (NCES district)
- District
- Osceola
- NCES district ID
- 1201470
- Math proficiency
- 39% ▼ -9.00%
- Reading proficiency
- 45% ▼ -4.00%
- Median HH income
- $45,528
- Composite
- 35.7/100
- National rank
- #4865
- State rank
- #60 of 73 in FL
Livability — Campbell
- Score
- 58/100
- State rank
- #848
- US rank
- #21421
Category grades
Schools grade is shown separately in the Schools card above.
Census & demographics
- County
- Osceola County · 410,217 people
- City population
- 60,595
- Metro
- Orlando-Kissimmee-Sanford, FL
- Population (ZIP)
- 46,768
- Household income
- $66,339
- Rent vs Own
- Severe rent burden
- 1302.0
Population outlook (Osceola County) Hauer SSP2
- Today (2025)
- 447,624 people
- By 2030
- 511,823 · +14.3%
- By 2040
- 642,986 · +43.6%
- By 2050
- 774,552 · +73.0%
- By 2075
- 1,078,144 · +140.9%
- By 2100
- 1,269,660 · +183.6%
Race, ethnicity, and origin ACS 2023
- Neighborhood character
- Diverse neighborhood (Simpson 0.58)
- Race & ethnicity
- Hispanic / Latino 60% Black 22% Two or more races 16% White 13% Asian 1%
- Hispanic origin (detail)
- Mexican 1% Puerto Rican 36% Cuban 3% Dominican 7%
- Common ancestry
- Hispanic 8% Romanian 1%
- Foreign-born
- 24% · Canada, Jamaica
- Languages at home
- 42% English-only · Spanish 48% French/Haitian/Cajun 7% Arabic 1%
Political lean MEDSL · Osceola
- 2024 margin
- Toss-up / Even · D 48.7% · R 50.2% · Other 1.1%
- 2008→2024 swing
- -21.2pp toward R · 2008: 19.7pp · 2024: -1.4pp
- All cycles
- 2024: R+1.4 2020: D+13.8 2016: D+25.0 2012: D+24.5 2008: D+19.7
Not yet ingested
- Civics
- —
Market trends
- HPI YoY
- ▼ -49.53%
- Current HPI
- 295.8928
- Rent YoY
- ▲ 0.82%
- Metro
- Orlando-Kissimmee-Sanford, FL
- State GDP YoY
- ▲ 3.28%
- F500 in state
- 36
Industry mix (Fortune 500 HQ in FL)
| Industry | F500 HQs | Revenue |
|---|---|---|
| Industrial Technology | 2 | $29B |
|
||
| Insurance | 2 | $17B |
|
||
| Retail | 1 | $60B |
|
||
| Technology Distribution | 1 | $58B |
|
||
| Homebuilding | 1 | $35B |
|
||
| Technology Manufacturing | 1 | $35B |
|
||
Price history
+159.5% since first listed16 events — show timeline
- 2026-06-07 Listed $137,000 SCMLS
- 2022-02-14 Sold (Public Records) $175,000 Public Records
- 2022-01-26 Sold (MLS) $175,000 Stellar MLS as Distributed by MLS Grid
- 2021-09-09 Listing Removed — Stellar MLS as Distributed by MLS Grid
- 2021-09-06 Listed $140,000 Stellar MLS as Distributed by MLS Grid
- 2021-07-12 Sold (Public Records) $155,000 Public Records
- 2021-06-30 Sold (MLS) $155,000 Stellar MLS as Distributed by MLS Grid
- 2021-05-26 Pending — Stellar MLS as Distributed by MLS Grid
- 2021-05-26 Listed $149,900 Stellar MLS as Distributed by MLS Grid
- 2014-04-30 Sold (Public Records) $71,000 Public Records
- 2014-04-24 Sold (MLS) $71,000 Stellar MLS as Distributed by MLS Grid
- 2014-04-10 Pending — Stellar MLS as Distributed by MLS Grid
- 2014-04-04 Price Changed $74,900 Stellar MLS as Distributed by MLS Grid
- 2014-04-01 Listed $75,000 Stellar MLS as Distributed by MLS Grid
- 1994-02-17 Sold (Public Records) $13,500 Public Records
- 1981-10-01 Sold (Public Records) $52,800 Public Records
Property tax history
+13.1%/yrLatest (2025): $2,731 · +6.0% YoY. Source: county tax records.
Cash-flow waterfall
monthlySold comps — $/sqft
last 12 mo · ≤1 miLoading sold comps…