8041 NW CR 152 · Jennings, FL
Flood risk 1/10 · Minimal
- FEMA flood zone
- X (unshaded)
- Chance of flooding over 30 yrs
- 0.0%
- Est. flood insurance / yr
- $507 – $1,088
Fire risk 8/10 · Major
- Est. fire insurance / yr
- $947 – $1,759
Heat risk 8/10 · Major
- Hot days now (above 108°F)
- 7 days/yr
- Hot days in 30 yrs
- 20 days/yr
Wind risk 9/10 · Severe
- Chance of severe wind over 30 yrs
- 99.0%
Air-quality risk 6/10 · Moderate
- Unhealthy air days now
- 13 days/yr
- Unhealthy air days in 30 yrs
- 14 days/yr
Risk factors via First Street. Map © Google.
Why this score? — see what drove the B+ grade
The composite is a weighted blend of 9 inputs, each scored 0–100. Each bar is that input's sub-score; the figure is the points it added to the 100-point composite (weight × sub-score).
- Cash flow +30.0/30.0
- 1% rule +10.0/10.0
- DSCR +10.0/10.0
- Appreciation +9.3/10.0
- ARV discount +7.5/15.0
- Livability +2.9/5.0
- Schools +2.6/10.0
- Rent growth +2.5/5.0
- Condition / age +2.5/5.0
$39,900
🖨 Deal sheet 📄 Offer letter ✓ Due diligence
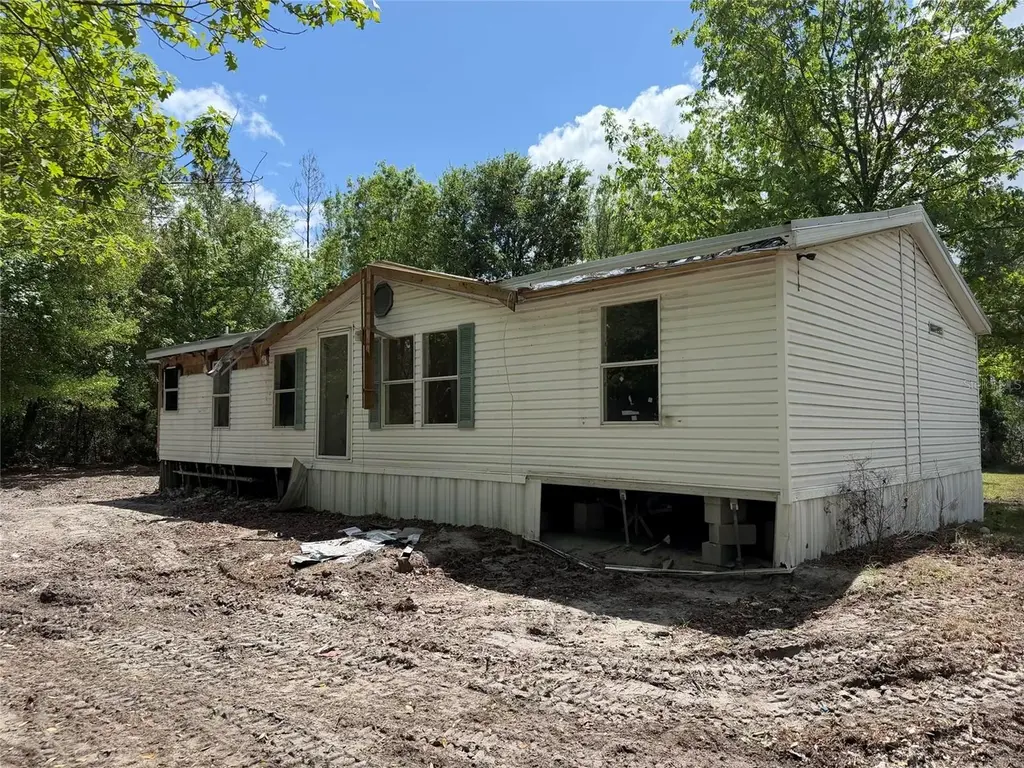
Listing remarks
Under contract-accepting backup offers. Investor Alert! Opportunity knocks in Jennings with this 2005 3 bedroom, 2 bath home situated on a full acre of land. This property is a complete fixer-upper. This property is perfect for investors, flippers, or anyone looking to create value with a renovation project. Prefer a fresh start? Remove the existing home and bring in your brand new site-built or manufactured home as septic is already in place, saving you time and money. Enjoy the peaceful, rural setting with plenty of space to spread out while still having essential utilities ready to go. Endless potential awaits so don’t miss this chance to turn vision into reality!
Key facts
- Well and septic
- Existing home
- Complete fixer-upper
Tags
Property features AI
Finance
- Other: Property is homesteaded; Property condition: fixer
- HOA & community: No association
Exterior
- Utilities: Well water; Septic tank; Other utilities
- Home design: Manufactured double-wide home; One story; North-facing
- Construction: Vinyl siding; Shingle roof; Pillar/post/pier foundation; Built as a manufactured home (double wide)
- Exterior features: Gravel road access; 1 acre lot
Interior
- Kitchen: No appliances included
- Bedrooms: 3 bedrooms
- Flooring: Other flooring
- Bathrooms: 2 full bathrooms
- Heating & cooling: No heating; No cooling
- Interior features: Living room/dining room combo
- Laundry & utility: Laundry room
Neighborhood map
What this means for you Summary
Snapshot
- This is a 3-bed/2.0-bath manufactured listed at $40k.
Deal economics
- At list price, monthly cash flow is $647 ($8k/yr) — positive.
- The deal already cash-flows at list — no discount required.
- Meets the 1% rule at list price ($1k rent vs $40k).
- Recommended offer: $39k (1.5% below list) — sets the bar for market timing.
- Cap rate 25.7% vs local median 2.9% in Jennings — top-decile yield for the area; either an underpriced asset or a hidden risk that comps aren't pricing in. Stress-test before assuming the spread holds.
Location & tenants
- Location reads 58/100 on livability (#843 in FL) — a working-class tenant base; expect higher turnover. Strengths: cost of living A+, housing A+; Watch: health & safety D, schools F, crime D-.
- Hamilton (rural): math 34% / reading 29% proficiency, ranked #68 of 73 in FL (top 93%) — families likely to look elsewhere, expect single-tenant / working-renter base with shorter leases; 72% free/reduced lunch — lower-income household profile, screen leases tightly.
- Market conditions: 68 active listings in the ZIP; 26 units permitted in Hamilton County in 2024 (0 in 5+ unit buildings).
Forward outlook
- In year one you build about $4k of equity ($276 loan paydown + $3k appreciation (8.6% local appreciation)).
- Hamilton County population projected at -12% by 2050 — secular population decline; favor cash flow + early exit over multi-decade hold.
- At projected returns (8.6% appreciation + 3.0% rent growth), your $11k cash investment doubles in ~1 year — after that, you're playing with house money.
- By year 8, paydown + projected appreciation supports a ~$31k cash-out refi (75% LTV) — recoverable capital for the next deal without selling this one.
Negotiation context
- It's been on market 25 days — a 2% lower offer ($39k) is reasonable based on typical stale-listing flexibility.
- 2 sale attempts; this cycle's ask has dropped $5k (11%) from the opening price — seller is motivated, your offer sets the floor, not the list.
Risks & watch-outs
- Climate carrying-cost: severe wind risk, 99% chance of damaging wind over 30y; severe wildfire risk; extreme-heat days projected 7→20/yr by 2055 (HVAC capex compounding) — expect insurance premiums to compound above CPI over the hold.
Questions for the listing agent
- Is there a deadline driving the sale (1031 exchange, divorce, estate, relocation)? That informs how much negotiation room exists.
- Schools are F-rated, which usually means shorter tenancies and higher turnover. Who's the typical renter profile here, and what's been the actual vacancy rate?
- Crime grade is D in this area — have there been break-ins, vandalism, or insurance claims at this property in the last 3 years? What carrier currently insures it and at what premium?
- What's the average days-on-market for RENTAL listings here right now (not sales)? A rising rental-DOM trend means longer vacancies and softer asking-rent achievability than the comps imply.
- What's the recent tenant-quality profile in this submarket — average credit score on applications, eviction rate, late-payment / NSF rate, and stable-employment percentage? A property-management company in the area should have these aggregated.
- How much new for-sale + rental construction is in the pipeline within 1–3 miles? Heavy new supply typically softens prices + rents 12–24 months out; constrained supply supports both.
Investment metrics
- 1% rule
- 2.87% ✓
- Cap rate
- 25.74%
- Cash-on-cash
- 69.46%
- DSCR
- 4.09
- GRM
- 2.9
CMA / ARV
No comps found within radius.
Projected returns pro-forma
8.57% appreciation · 3.0% rent growth · sell at horizon
- IRR
- 79.2%
- Equity multiple
- 6.29×
- Total profit
- $59,108
- Equity at exit
- $31,885
- IRR
- 74.5%
- Equity multiple
- 13.62×
- Total profit
- $141,021
- Equity at exit
- $64,852
Cash invested: $11,172 (down + closing). Projections, not guarantees.
Landlord ↔ Tenant lean methodology
- Overall (STATE)
- 87 Strongly Landlord-Friendly
- State Florida
- 87 Strongly Landlord-Friendly · R+3
- County
- — inherits STATE
- City
- — inherits STATE
ZIP-level market 32053
- Home prices YoY
- 1.9%
- Active inventory
- 68
- Price-to-rent
- 2.9×
Monthly cashflow live
- Estimated rent
- $1,146 medium interval (Pro) →
- Mortgage (P&I)
- −$209
- Tax from tax record
- −$33 /mo · $394/yr
- Insurance
- −$17
- HOA
- −$0
- Vacancy / Maint / Mgmt
- −$241
- Net cashflow
- $647
Break-even live
UW: 25.0% down · 7.5% · 30yr · 1.5% tax · 5.0% vac · 8.0% maint · 8.0% mgmt
Financing live
Cash to close
- Down payment
- $9,975
- Closing costs
- $1,197
- Reserves months
- —
- Total cash needed
- —
Loan-product check · same deal, 3 products live
Conventional
25% down · 7.5% · 30yr
- Down + closing
- —
- Monthly P&I
- —
- Monthly cashflow
- —
- DSCR
- —
- Eligible?
- —
Personal DTI + credit; lowest rate.
DSCR
20% down · 8.5% · 30yr
- Down + closing
- —
- Monthly P&I
- —
- Monthly cashflow
- —
- DSCR
- —
- Eligible?
- —
No personal income docs; deal must DSCR.
Hard money
10% down · 12.0% · 12mo
- Down + closing
- —
- Monthly P&I
- —
- Monthly cashflow
- —
- DSCR
- —
- Eligible?
- —
Short-term bridge; refi at stabilization.
Listing history 9 events
-
2026-06-15status $39,900 Pending 25 DOM
-
2026-06-15days on market $39,900 Active 25 DOM
-
2026-06-14days on market $39,900 Active 23 DOM
-
2026-06-13statusdays on market $39,900 Active 22 DOM
-
2026-05-20status Pending
-
2026-05-14price $39,900
-
2026-05-11status Active
-
2026-04-28status Pending
-
2026-04-16$44,900 Active
ⓘ Source: listings_history table (triggers on properties + properties_extension) + one-shot
backfill from property_details.listing_events for pre-trigger history.
Tax reassessment forecast FL · Resets to sale price
- Current annual tax
- $394 · $33/mo
- Projected year-2 tax
- $394 · $33/mo
- Expected delta
- $0/yr ($0/mo · 0.0%)
ⓘ Screening estimate from a state-policy table — verify with the county assessor before closing.
Climate risk First Street
- Flood 1/10 Low FEMA zone X (unshaded) · 0% chance over 30 yrs
- Wildfire 8/10 Severe
- Heat 8/10 Severe 7 d/yr ≥108°F today · 20 d/yr by 30 yrs out
- Wind 9/10 Extreme 99% chance of damaging wind over 30 yrs
- Air quality 6/10 Major 13 unhealthy d/yr today · 14 by 30 yrs out
Nearby sold comps map
Loading sold comps map…
Walkable amenities ~0.75 mi
Loading nearby amenities…
Taxation est. · year 1
- Rental income
- $13,752
- − Mortgage interest
- −$2,235
- − Property taxes
- −$394
- − Insurance
- −$200
- − Repairs & maintenance
- −$1,100
- − Management
- −$1,100
- − Depreciation
- −$1,161
- Taxable income
- $7,563
- Est. tax owed @ 24.0%
- −$1,815
- After-tax cash flow
- $5,945/yr
For passive investors: Depreciation is non-cash, so a rental often shows a tax loss while cash-flowing — sheltering income. Rental losses are passive: they offset passive income freely, and up to $25,000/yr can offset ordinary (W-2) income if you actively participate and your MAGI is under $100k (phasing out to $0 by $150k); unused losses carry forward. On sale, claimed depreciation is recaptured at up to 25%, and gains may owe capital-gains tax (a 1031 exchange can defer both). Figures are a year-1 estimate at your 24.0% rate — not tax advice; consult a CPA.
Schools (NCES district)
- District
- Hamilton
- NCES district ID
- 1200720
- Math proficiency
- 34% ▼ -8.00%
- Reading proficiency
- 29% ▼ -6.00%
- Median HH income
- $36,461
- Composite
- 26.18/100
- National rank
- #7267
- State rank
- #68 of 73 in FL
Livability — Jennings
- Score
- 58/100
- State rank
- #843
- US rank
- #21026
Category grades
Schools grade is shown separately in the Schools card above.
Census & demographics
- Population (ZIP)
- 3,707
Population outlook (Hamilton County) Hauer SSP2
- Today (2025)
- 13,405 people
- By 2030
- 13,031 · -2.8%
- By 2040
- 12,385 · -7.6%
- By 2050
- 11,740 · -12.4%
- By 2075
- 9,347 · -30.3%
- By 2100
- 6,344 · -52.7%
Race, ethnicity, and origin ACS 2023
- Neighborhood character
- Diverse neighborhood (Simpson 0.63)
- Race & ethnicity
- White 50% Black 25% Hispanic / Latino 22% Two or more races 5% Native American 5%
- Hispanic origin (detail)
- Mexican 15% Puerto Rican 2%
- Common ancestry
- Subsaharan African 5% Slovak 2% Hispanic 2%
- Foreign-born
- 8% · Canada
- Languages at home
- 80% English-only · Spanish 16% French/Haitian/Cajun 3%
Political lean MEDSL · Hamilton
- 2024 margin
- Solid R (+39.0) · D 30.1% · R 69.1%
- 2008→2024 swing
- -24.4pp toward R · 2008: -14.6pp · 2024: -39.0pp
- All cycles
- 2024: R+39.0 2020: R+31.8 2016: R+28.2 2012: R+16.9 2008: R+14.6
Not yet ingested
- Civics
- —
Market trends
- HPI YoY
- ▲ 8.57%
- Current HPI
- 449.0265
- Rent YoY
- —
- Metro
- —
- State GDP YoY
- ▲ 3.28%
- F500 in state
- 36
Industry mix (Fortune 500 HQ in FL)
| Industry | F500 HQs | Revenue |
|---|---|---|
| Industrial Technology | 2 | $29B |
|
||
| Insurance | 2 | $17B |
|
||
| Retail | 1 | $60B |
|
||
| Technology Distribution | 1 | $58B |
|
||
| Homebuilding | 1 | $35B |
|
||
| Technology Manufacturing | 1 | $35B |
|
||
Price history
-11.1% since first listed5 events — show timeline
- 2026-05-20 Pending — Stellar MLS as Distributed by MLS Grid
- 2026-05-14 Price Changed $39,900 Stellar MLS as Distributed by MLS Grid
- 2026-05-11 Relisted — Stellar MLS as Distributed by MLS Grid
- 2026-04-28 Pending — Stellar MLS as Distributed by MLS Grid
- 2026-04-16 Listed $44,900 Stellar MLS as Distributed by MLS Grid
Property tax history
+1.5%/yrLatest (2025): $394 · -6.3% YoY. Source: county tax records.
Cash-flow waterfall
monthlySold comps — $/sqft
last 12 mo · ≤1 miLoading sold comps…