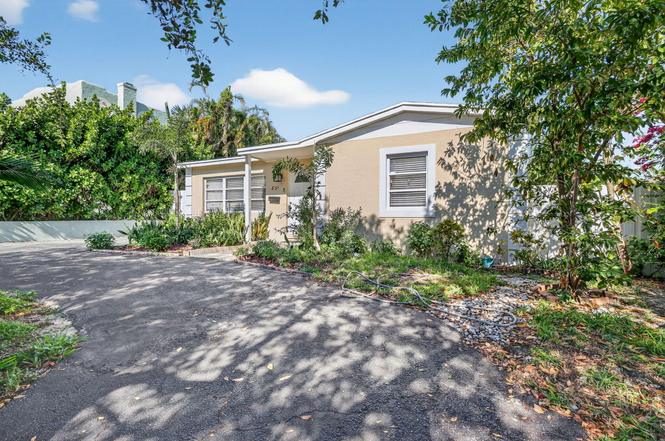
831 30th Ct · West Palm Beach, FL
Flood risk 1/10 · Minimal
- FEMA flood zone
- X (unshaded)
- Chance of flooding over 30 yrs
- 0.0%
- Est. flood insurance / yr
- $507 – $1,088
Fire risk 1/10 · Minimal
- Est. fire insurance / yr
- $947 – $1,759
Heat risk 10/10 · Severe
- Hot days now (above 105°F)
- 7 days/yr
- Hot days in 30 yrs
- 25 days/yr
Wind risk 10/10 · Severe
- Chance of severe wind over 30 yrs
- 99.0%
Air-quality risk 2/10 · Minimal
- Unhealthy air days now
- 1 days/yr
- Unhealthy air days in 30 yrs
- 1 days/yr
Risk factors via First Street. Map © Google.
Why this score? — see what drove the C grade
The composite is a weighted blend of 9 inputs, each scored 0–100. Each bar is that input's sub-score; the figure is the points it added to the 100-point composite (weight × sub-score).
- Cash flow +18.3/30.0
- ARV discount +15.0/15.0
- DSCR +5.7/10.0
- 1% rule +4.9/10.0
- Schools +4.3/10.0
- Livability +4.1/5.0
- Rent growth +3.3/5.0
- Condition / age +2.5/5.0
- Appreciation +0.0/10.0
$405,000
🖨 Deal sheet 📄 Offer letter ✓ Due diligence
Listing remarks MLS
Remodeled, new paint and new water proof floors. all new led lighting new ceiling fans. New refrigerator, oven, microwave,and washing machine. 1 year old Dryer. Granite counter tops. Located high on the hill One of the highest points in West Palm. no worries about flooding.
Key facts
- 4 parking spots
- Built 1955
- Listed 167 days
Property features AI
Finance
- Financial info: Pets allowed with no restrictions
- HOA & community: No association amenities
Exterior
- Parking: Four open parking spaces
- Security: Smoke detectors
- Utilities: Public water; Public sewer; Three-phase electric; Cable available
- Home design: Single-family residence; One story; Faces south; Resale condition
- Construction: Stucco and CBS construction; Composition/shingle roof; Built using standard foundation (public records)
- Exterior features: Not waterfront
Interior
- Kitchen: Dishwasher; Electric range; Refrigerator
- Bedrooms: One main-level bedroom
- Flooring: Ceramic tile; Laminate
- Bathrooms: Two full bathrooms; One bathroom on the main level
- Heating & cooling: Central electric heating; Central air (electric) cooling
- Interior features: Split bedroom layout; Unfurnished
Neighborhood map
What this means for you Summary
Snapshot
- This is a 4-bed/2.0-bath single-family listed at $405k.
Deal economics
- At list price, monthly cash flow is $369 ($4k/yr) — positive.
- The deal already cash-flows at list — no discount required.
- To meet the 1% rule (rent ≥ 1% of price), the offer needs to be $402k (0.6% below list).
- Recommended offer: $356k (12.0% below list) — sets the bar for market timing.
- Cap rate 7.4% vs local median 3.8% in West Palm Beach — top-decile yield for the area; either an underpriced asset or a hidden risk that comps aren't pricing in. Stress-test before assuming the spread holds.
Location & tenants
- Location reads 82/100 on livability (#75 in FL, #1,255 nationally) — a professional / high-income tenant draw. Strengths: commute A+, housing A+, health & safety A+; Watch: employment C-, crime F.
- Palm Beach (suburban): math 46% / reading 53% proficiency, ranked #34 of 73 in FL (top 47%) — families likely to look elsewhere, expect single-tenant / working-renter base with shorter leases.
- Market conditions: Rents rising (+3.1%/yr); 305 active listings in the ZIP; 33 comparable units currently listed for rent nearby; rentals at typical pace (median 24d on market — plan ~3-4 weeks tenant-placement turnaround); 3,974 units permitted in Palm Beach County in 2024 (1,012 in 5+ unit buildings).
- At $4,024/mo this rent would consume 80% of the median local household income ($60k/yr) (locally 2157% of renters already pay >50% of income on rent) — very limited rent-growth headroom before tenants either downsize or default.
Forward outlook
- Local home prices are declining (-3.0%/yr); year-one equity from $3k of loan paydown is wiped out by about $12k of value loss. Plan a longer hold.
- Palm Beach County population projected at +30% by 2050 — long-run rental-demand tailwind backs the buy-and-hold thesis.
Negotiation context
- It's been on market 167 days — a 12% lower offer ($356k) is reasonable based on typical stale-listing flexibility.
- 7 sale attempts since 24y ago with the ask held roughly flat each time — persistent listings suggest the price (not the market) is what's stuck; bring a comps-based counter.
- Current owner paid $238k; list at $405k implies a 70% gain — meaningful room to come down on a strong offer.
Risks & watch-outs
- Watch-outs: built in 1955 — expect roof / HVAC / electrical / plumbing capex.
- Climate carrying-cost: severe wind risk, 99% chance of damaging wind over 30y; extreme-heat days projected 7→25/yr by 2055 (HVAC capex compounding) — expect insurance premiums to compound above CPI over the hold.
Questions for the listing agent
- It's been on market 167 days. Have you received any prior offers? Is the seller open to a 12% concession, seller financing, or rate buy-down credit?
- Built in 1955 — when were the roof, HVAC, electrical panel, plumbing, and water heater last replaced?
- Why hasn't it sold? Are there any deal-killer items the seller is aware of (foundation, flood, title, zoning, code violations)?
- Is there a deadline driving the sale (1031 exchange, divorce, estate, relocation)? That informs how much negotiation room exists.
- Crime grade is F in this area — have there been break-ins, vandalism, or insurance claims at this property in the last 3 years? What carrier currently insures it and at what premium?
- What's the average days-on-market for RENTAL listings here right now (not sales)? A rising rental-DOM trend means longer vacancies and softer asking-rent achievability than the comps imply.
- What's the recent tenant-quality profile in this submarket — average credit score on applications, eviction rate, late-payment / NSF rate, and stable-employment percentage? A property-management company in the area should have these aggregated.
- How much new for-sale + rental construction is in the pipeline within 1–3 miles? Heavy new supply typically softens prices + rents 12–24 months out; constrained supply supports both.
Investment metrics
- 1% rule
- 0.99% ✗
- Cap rate
- 7.39%
- Cash-on-cash
- 3.91%
- DSCR
- 1.17
- GRM
- 8.4
CMA / ARV
- ARV (on-the-fly)
- $758,095
- Comps found
- 1
Show comp detail 1 sale within ~0.75 mi
| Address | Dist | Beds/Ba | Sqft | Sold | Price | $/sf | Match |
|---|---|---|---|---|---|---|---|
| 219 32nd St | 0.66mi | 3/2.0 (-1) | 1,386 (-0%) | 20mo | $755,000 | $545 | 47 |
Match score weights: distance 35% · size 25% · config 20% · recency 20%. Top-matched comps best support the ARV.
Projected returns pro-forma
-3.0% appreciation · 3.08% rent growth · sell at horizon
- IRR
- -10.1%
- Equity multiple
- 0.63×
- Total profit
- $-41,716
- Equity at exit
- $60,387
- IRR
- -0.6%
- Equity multiple
- 0.96×
- Total profit
- $-4,434
- Equity at exit
- $35,017
Cash invested: $113,400 (down + closing). Projections, not guarantees.
Landlord ↔ Tenant lean methodology
- Overall (STATE)
- 87 Strongly Landlord-Friendly
- State Florida
- 87 Strongly Landlord-Friendly · R+3
- County
- — inherits STATE
- City
- — inherits STATE
ZIP-level market 33407
- Rents YoY
- 3.1%
- Active inventory
- 305
- Price-to-rent
- 8.4×
Monthly cashflow live
- Estimated rent
- $4,024 high interval (Pro) →
- Mortgage (P&I)
- −$2,124
- Tax from tax record
- −$517 /mo · $6,207/yr
- Insurance
- −$169
- HOA
- −$0
- Vacancy / Maint / Mgmt
- −$845
- Net cashflow
- $369
Break-even live
UW: 25.0% down · 7.5% · 30yr · 1.5% tax · 5.0% vac · 8.0% maint · 8.0% mgmt
Financing live
Cash to close
- Down payment
- $101,250
- Closing costs
- $12,150
- Reserves months
- —
- Total cash needed
- —
Loan-product check · same deal, 3 products live
Conventional
25% down · 7.5% · 30yr
- Down + closing
- —
- Monthly P&I
- —
- Monthly cashflow
- —
- DSCR
- —
- Eligible?
- —
Personal DTI + credit; lowest rate.
DSCR
20% down · 8.5% · 30yr
- Down + closing
- —
- Monthly P&I
- —
- Monthly cashflow
- —
- DSCR
- —
- Eligible?
- —
No personal income docs; deal must DSCR.
Hard money
10% down · 12.0% · 12mo
- Down + closing
- —
- Monthly P&I
- —
- Monthly cashflow
- —
- DSCR
- —
- Eligible?
- —
Short-term bridge; refi at stabilization.
Rent comps 33 comps
| Address | Beds | Baths | Sqft | Rent | $/sqft | DOM | Units | Dist |
|---|---|---|---|---|---|---|---|---|
| 933 30th Ct West Palm Beach, FL | 3.0 | 1.5 | 1085 | $3,100 | $2.86 | 24d | 1 | 0.13mi |
| 636 35th St West Palm Beach, FL | 3.0 | 2.0 | 1133 | $3,500 | $3.09 | 24d | 1 | 0.26mi |
| 3808 Westview Ave West Palm Beach, FL | 4.0 | 3.0 | 1617 | $3,100 | $1.92 | 24d | 1 | 0.37mi |
| 701 37th St West Palm Beach, FL | 3.0 | 2.0 | 1426 | $3,600 | $2.52 | 24d | 1 | 0.37mi |
| 619 37th St West Palm Beach, FL | 3.0 | 2.0 | 1414 | $3,350 | $2.37 | 24d | 1 | 0.41mi |
| 406 35th St West Palm Beach, FL | 3.0 | 2.0 | 1835 | $8,000 | $4.36 | 24d | 1 | 0.51mi |
| 411 26th St West Palm Beach, FL | 3.0 | 3.5 | 1847 | $6,900 | $3.74 | 7d | 1 | 0.57mi |
| 411 26th St West Palm Beach, FL | 4.0 | 3.5 | 1847 | $6,900 | $3.74 | 24d | 1 | 0.57mi |
| 436 38th St West Palm Beach, FL | 4.0 | 3.0 | 1479 | $6,500 | $4.39 | 24d | 1 | 0.57mi |
| 716 21st St West Palm Beach, FL | 4.0 | 2.0 | 1560 | $3,800 | $2.44 | 5d | 1 | 0.63mi |
| 716 21st St West Palm Beach, FL | 4.0 | 2.0 | 1560 | $3,800 | $2.44 | 17d | 1 | 0.63mi |
| 735 20th St West Palm Beach, FL | 4.0 | 3.0 | 1767 | $3,800 | $2.15 | 24d | 1 | 0.65mi |
| 735 20th St West Palm Beach, FL | 4.0 | 3.0 | 1767 | $3,600 | $2.04 | 7d | 1 | 0.65mi |
| 216 32nd St West Palm Beach, FL | 3.0 | 3.0 | 1846 | $6,200 | $3.36 | 24d | 1 | 0.67mi |
| 202 32nd St West Palm Beach, FL | 3.0 | 2.0 | 1636 | $5,995 | $3.66 | 24d | 1 | 0.70mi |
| 1101 Grant St West Palm Beach, FL | 4.0 | 2.0 | 1726 | $2,995 | $1.74 | 16d | 1 | 0.74mi |
| 401 42nd St West Palm Beach, FL | 3.0 | 1.0 | 1100 | $4,950 | $4.50 | 24d | 1 | 0.77mi |
| 401 42nd St West Palm Beach, FL | 3.0 | 1.0 | 1400 | $4,950 | $3.54 | 15d | 1 | 0.77mi |
| 1104 State St Unit C West Palm Beach, FL | 3.0 | 1.0 | 875 | $3,000 | $3.43 | 24d | 1 | 0.79mi |
| 565 Lilac Ct West Palm Beach, FL | 3.0 | 2.0 | 1250 | $3,000 | $2.40 | 17d | 1 | 0.95mi |
| 1805 N Flagler Dr #107 West Palm Beach, FL | 3.0 | 2.0 | 1237 | $2,995 | $2.42 | 3d | 1 | 0.99mi |
| 1563 40th St West Palm Beach, FL | 4.0 | 2.0 | 1680 | $3,600 | $2.14 | 4d | 1 | 1.02mi |
| 823 14th St West Palm Beach, FL | 3.0 | 1.0 | 1000 | $3,495 | $3.50 | 24d | 1 | 1.05mi |
| 926 14th St West Palm Beach, FL | 4.0 | 2.0 | 1050 | $3,000 | $2.86 | 15d | 1 | 1.08mi |
| 5101 Spruce Ave West Palm Beach, FL | 3.0 | 3.0 | 1151 | $3,100 | $2.69 | 24d | 1 | 1.11mi |
| 424 51st St Unit 426 West Palm Beach, FL | 3.0 | 2.0 | 1230 | $3,500 | $2.85 | 10d | 1 | 1.13mi |
| 1319 13th St West Palm Beach, FL | 3.0 | 2.0 | 1215 | $3,200 | $2.63 | 24d | 1 | 1.18mi |
| 5203 N Flagler Dr West Palm Beach, FL | 3.0 | 1.5 | 1458 | $6,000 | $4.12 | 24d | 1 | 1.18mi |
| 5301 N Flagler Dr West Palm Beach, FL | 4.0 | 3.0 | 1616 | $6,000 | $3.71 | 24d | 1 | 1.23mi |
| 1115 Windsor Ave West Palm Beach, FL | 4.0 | 3.0 | 1377 | $3,500 | $2.54 | 18d | 1 | 1.29mi |
| 629 56th St West Palm Beach, FL | 4.0 | 2.0 | 1689 | $3,100 | $1.84 | 15d | 1 | 1.35mi |
| 5600 N Flagler Dr West Palm Beach, FL | 1.0–3.0 | 2.0 | 1192 | $6,000 | $5.03 | 20d | 8 | 1.39mi |
| 921 8th St West Palm Beach, FL | 3.0 | 1.0 | 1000 | $3,395 | $3.40 | 24d | 1 | 1.44mi |
Listing history 35 events
-
2026-06-18days on market $405,000 Active 167 DOM
-
2026-06-17days on market $405,000 Active 166 DOM
-
2026-06-16days on market $405,000 Active 165 DOM
-
2026-06-15days on market $405,000 Active 164 DOM
-
2026-06-13days on market $405,000 Active 162 DOM
-
2026-06-09days on market $405,000 Active 158 DOM
-
2026-06-07days on market $405,000 Active 156 DOM
-
2026-06-04days on market $405,000 Active 153 DOM
-
2026-06-03days on market $405,000 Active 152 DOM
-
2026-06-01days on market $405,000 Active 150 DOM
-
2026-05-31days on market $405,000 Active 149 DOM
-
2026-04-10price $405,000
-
2026-01-02$425,000 Active
-
2025-12-31historical $425,000
-
2020-07-30soldstatus $238,000
-
2020-07-24soldstatus $238,000 Closed 274-char remark
Show marketing remark (274 chars)
Remodeled, new paint and new water proof floors. all new led lighting new ceiling fans. New refrigerator, oven, microwave,and washing machine. 1 year old Dryer. Granite counter tops. Located high on the hill One of the highest points in West Palm. no worries about flooding.
-
2020-06-10historical Contingent 274-char remark
Show marketing remark (274 chars)
Remodeled, new paint and new water proof floors. all new led lighting new ceiling fans. New refrigerator, oven, microwave,and washing machine. 1 year old Dryer. Granite counter tops. Located high on the hill One of the highest points in West Palm. no worries about flooding.
-
2020-02-23status Active 274-char remark
Show marketing remark (274 chars)
Remodeled, new paint and new water proof floors. all new led lighting new ceiling fans. New refrigerator, oven, microwave,and washing machine. 1 year old Dryer. Granite counter tops. Located high on the hill One of the highest points in West Palm. no worries about flooding.
-
2020-02-13historical Active Under Contract 274-char remark
Show marketing remark (274 chars)
Remodeled, new paint and new water proof floors. all new led lighting new ceiling fans. New refrigerator, oven, microwave,and washing machine. 1 year old Dryer. Granite counter tops. Located high on the hill One of the highest points in West Palm. no worries about flooding.
-
2020-02-10$239,900 Active 274-char remark
Show marketing remark (274 chars)
Remodeled, new paint and new water proof floors. all new led lighting new ceiling fans. New refrigerator, oven, microwave,and washing machine. 1 year old Dryer. Granite counter tops. Located high on the hill One of the highest points in West Palm. no worries about flooding.
-
2010-06-23historical
-
2010-02-15$149,900
-
2009-11-10soldstatus $69,900
-
2009-10-29historical
-
2009-09-11$69,900
-
2006-08-02soldstatus $230,000
-
2004-10-21soldstatus $168,000
-
2004-10-18soldstatus $168,000
-
2004-09-15historical
-
2004-06-22$179,900
-
2003-05-12soldstatus $115,000
-
2003-03-25historical
-
2002-05-20$69,900
-
1995-03-15soldstatus $47,000
-
1990-07-18soldstatus $28,400
ⓘ Source: listings_history table (triggers on properties + properties_extension) + one-shot
backfill from property_details.listing_events for pre-trigger history.
Tax reassessment forecast FL · Resets to sale price
- Current annual tax
- $6,207 · $517/mo
- Projected year-2 tax
- $6,207 · $517/mo
- Expected delta
- $0/yr ($0/mo · 0.0%)
ⓘ Screening estimate from a state-policy table — verify with the county assessor before closing.
Climate risk First Street
- Flood 1/10 Low FEMA zone X (unshaded) · 0% chance over 30 yrs
- Wildfire 1/10 Low
- Heat 10/10 Extreme 7 d/yr ≥105°F today · 25 d/yr by 30 yrs out
- Wind 10/10 Extreme 99% chance of damaging wind over 30 yrs
- Air quality 2/10 Low 1 unhealthy d/yr today · 1 by 30 yrs out
Nearby sold comps map
Loading sold comps map…
Walkable amenities ~0.75 mi
Loading nearby amenities…
Taxation est. · year 1
- Rental income
- $48,290
- − Mortgage interest
- −$22,686
- − Property taxes
- −$6,207
- − Insurance
- −$2,025
- − Repairs & maintenance
- −$3,863
- − Management
- −$3,863
- − Depreciation
- −$11,782
- Taxable loss
- −$2,136
- Est. tax savings @ 24.0%
- +$513
- After-tax cash flow
- $4,944/yr
For passive investors: Depreciation is non-cash, so a rental often shows a tax loss while cash-flowing — sheltering income. Rental losses are passive: they offset passive income freely, and up to $25,000/yr can offset ordinary (W-2) income if you actively participate and your MAGI is under $100k (phasing out to $0 by $150k); unused losses carry forward. On sale, claimed depreciation is recaptured at up to 25%, and gains may owe capital-gains tax (a 1031 exchange can defer both). Figures are a year-1 estimate at your 24.0% rate — not tax advice; consult a CPA.
Schools (NCES district)
- District
- Palm Beach
- NCES district ID
- 1201500
- Math proficiency
- 46% ▼ -16.00%
- Reading proficiency
- 53% ▼ -4.00%
- Median HH income
- $53,943
- Composite
- 42.72/100
- National rank
- #3160
- State rank
- #34 of 73 in FL
Livability — West Palm Beach
- Score
- 82/100
- State rank
- #75
- US rank
- #1255
Category grades
Schools grade is shown separately in the Schools card above.
Census & demographics
- Census place
- West Palm Beach, FL
- County
- Palm Beach County · 1,438,312 people
- City population
- 222,012
- Metro
- Miami-Fort Lauderdale-Pompano Beach, FL
- Population (ZIP)
- 34,851
- Household income
- $59,993
- Rent vs Own
- Severe rent burden
- 2157.0
Population outlook (Palm Beach County) Hauer SSP2
- Today (2025)
- 1,637,487 people
- By 2030
- 1,743,255 · +6.5%
- By 2040
- 1,948,712 · +19.0%
- By 2050
- 2,132,979 · +30.3%
- By 2075
- 2,530,027 · +54.5%
- By 2100
- 2,706,979 · +65.3%
Race, ethnicity, and origin ACS 2023
- Neighborhood character
- Diverse neighborhood (Simpson 0.62)
- Race & ethnicity
- Black 54% White 21% Hispanic / Latino 20% Two or more races 13% Asian 2%
- Hispanic origin (detail)
- Mexican 2% Puerto Rican 2% Cuban 2%
- Common ancestry
- Hispanic 8% Lithuanian 1% Romanian 1%
- Foreign-born
- 26% · Canada, Vietnam, Jamaica
- Languages at home
- 72% English-only · Spanish 17% French/Haitian/Cajun 8% Other Indo-European 1%
Political lean MEDSL · Palm Beach
- 2024 margin
- Toss-up / Even · D 50.0% · R 49.2%
- 2008→2024 swing
- -22.1pp toward R · 2008: 22.9pp · 2024: 0.8pp
- All cycles
- 2024: D+0.8 2020: D+12.8 2016: D+15.3 2012: D+17.0 2008: D+22.9
Not yet ingested
- Civics
- —
Market trends
- HPI YoY
- ▼ -299.26%
- Current HPI
- 363.3995
- Rent YoY
- ▲ 3.08%
- Metro
- Miami-Fort Lauderdale-Pompano Beach, FL
- State GDP YoY
- ▲ 3.28%
- F500 in state
- 36
Industry mix (Fortune 500 HQ in FL)
| Industry | F500 HQs | Revenue |
|---|---|---|
| Industrial Technology | 2 | $29B |
|
||
| Insurance | 2 | $17B |
|
||
| Retail | 1 | $60B |
|
||
| Technology Distribution | 1 | $58B |
|
||
| Homebuilding | 1 | $35B |
|
||
| Technology Manufacturing | 1 | $35B |
|
||
Price history
+1326.1% since first listed24 events — show timeline
- 2026-04-10 Price Changed $405,000 Beaches MLS
- 2026-01-02 Listed $425,000 Beaches MLS
- 2025-12-31 Coming Soon $425,000 Beaches MLS
- 2020-07-30 Sold (Public Records) $238,000 Public Records
- 2020-07-24 Sold (MLS) $238,000 Beaches MLS
- 2020-06-10 Contingent — Beaches MLS
- 2020-02-23 Relisted — Beaches MLS
- 2020-02-13 Contingent — Beaches MLS
- 2020-02-10 Listed $239,900 Beaches MLS
- 2010-06-23 Listing Removed — Beaches MLS
- 2010-02-15 Listed $149,900 Beaches MLS
- 2009-11-10 Sold (MLS) $69,900 Beaches MLS
- 2009-10-29 Listing Removed — Beaches MLS
- 2009-09-11 Listed $69,900 Beaches MLS
- 2006-08-02 Sold (Public Records) $230,000 Public Records
- 2004-10-21 Sold (Public Records) $168,000 Public Records
- 2004-10-18 Sold (MLS) $168,000 Beaches MLS
- 2004-09-15 Listing Removed — Beaches MLS
- 2004-06-22 Listed $179,900 Beaches MLS
- 2003-05-12 Sold (Public Records) $115,000 Public Records
- 2003-03-25 Listing Removed — Beaches MLS
- 2002-05-20 Listed $69,900 Beaches MLS
- 1995-03-15 Sold (Public Records) $47,000 Public Records
- 1990-07-18 Sold (Public Records) $28,400 Public Records
Property tax history
+8.1%/yrLatest (2025): $6,207 · +0.7% YoY. Source: county tax records.
Cash-flow waterfall
monthlySold comps — $/sqft
last 12 mo · ≤1 miLoading sold comps…