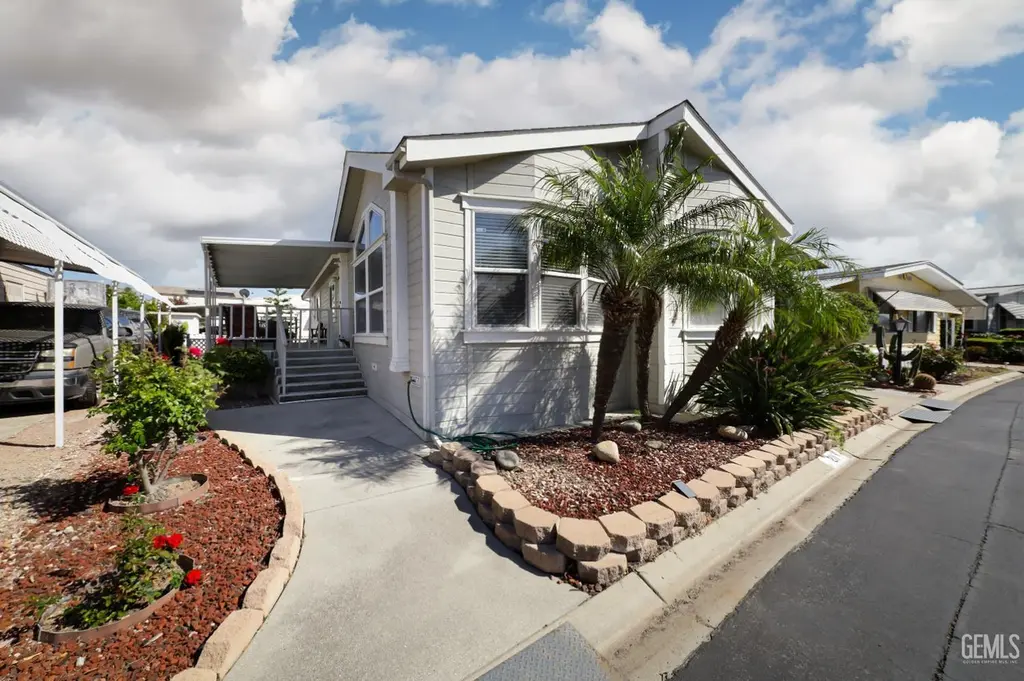
250 E Telegraph Rd #211 · Fillmore, CA
Flood risk 6/10 · Moderate
- FEMA flood zone
- X
- Chance of flooding over 30 yrs
- 0.71%
- Est. flood insurance / yr
- $507 – $1,088
Fire risk 7/10 · Major
- Est. fire insurance / yr
- $659 – $1,223
Heat risk 6/10 · Moderate
- Hot days now (above 98°F)
- 7 days/yr
- Hot days in 30 yrs
- 19 days/yr
Wind risk 1/10 · Minimal
- Chance of severe wind over 30 yrs
- —
Air-quality risk 4/10 · Minor
- Unhealthy air days now
- 5 days/yr
- Unhealthy air days in 30 yrs
- 7 days/yr
Risk factors via First Street. Map © Google.
Why this score? — see what drove the D+ grade
The composite is a weighted blend of 9 inputs, each scored 0–100. Each bar is that input's sub-score; the figure is the points it added to the 100-point composite (weight × sub-score).
- Cash flow +25.0/30.0
- DSCR +8.2/10.0
- 1% rule +5.2/10.0
- Livability +3.7/5.0
- Rent growth +2.5/5.0
- Condition / age +2.5/5.0
- Schools +2.3/10.0
- ARV discount +0.0/15.0
- Appreciation +0.0/10.0
$269,999
🖨 Deal sheet 📄 Offer letter ✓ Due diligence
Listing remarks MLS
This mobile home is located in the El Dorado Family MHP and features 2 bedrooms, 2 full bathrooms and a bonus room that can be used as a den, office or guest room. Outside you will find a well-kept yard with grass, a plum tree and tomato plant. Home also has two storage sheds. Park amenities include a large community room, billiard room, pool, and spa.
Key facts
- Clubhouse
- Bonus room
- Mature plum tree
Tags
Neighborhood map
What this means for you Summary
Snapshot
- This is a 2-bed/2.0-bath manufactured listed at $270k.
Deal economics
- At list price, monthly cash flow is $590 ($7k/yr) — positive.
- The deal already cash-flows at list — no discount required.
- Meets the 1% rule at list price ($3k rent vs $270k).
- Cap rate 8.9% vs local median 1.8% in Fillmore — top-decile yield for the area; either an underpriced asset or a hidden risk that comps aren't pricing in. Stress-test before assuming the spread holds.
Location & tenants
- Location reads 74/100 on livability (#145 in CA, #4,935 nationally) — a middle-class / working-renter tenant base. Strengths: amenities A+, health & safety A+, crime A; Watch: schools F, cost of living F.
- Fillmore Unified (town): math 18% / reading 25% proficiency, ranked #1,196 of 1,400 in CA (top 85%) — low school quality limits family demand, transient renter base, plan for 1-2y turnover; 64% free/reduced lunch — lower-income household profile, screen leases tightly.
- Market conditions: 61 active listings in the ZIP; 3 comparable units currently listed for rent nearby; rentals at typical pace (median 16d on market — plan ~3-4 weeks tenant-placement turnaround); solid renter incomes; 1,759 units permitted in Ventura County in 2024 (1,196 in 5+ unit buildings).
- This rent runs 36% of the median local income ($93k/yr) — at the standard rent-burdened threshold; future hikes will face affordability resistance.
Forward outlook
- Local home prices are declining (-3.0%/yr); year-one equity from $2k of loan paydown is wiped out by about $8k of value loss. Plan a longer hold.
- Ventura County population projected at +4% by 2050 — modest demand growth; plan on rents tracking national, not racing it.
Negotiation context
- Only 2 days on market — expect competitive offers; lowballing is unlikely to land.
- 2 sale attempts since 2y ago with the ask held roughly flat each time — persistent listings suggest the price (not the market) is what's stuck; bring a comps-based counter.
Risks & watch-outs
- Climate carrying-cost: major flood risk; major wildfire risk; extreme-heat days projected 7→19/yr by 2055 (HVAC capex compounding) — expect insurance premiums to compound above CPI over the hold.
Questions for the listing agent
- Is there a deadline driving the sale (1031 exchange, divorce, estate, relocation)? That informs how much negotiation room exists.
- Schools are F-rated, which usually means shorter tenancies and higher turnover. Who's the typical renter profile here, and what's been the actual vacancy rate?
- The area grade is low — what's the realistic commute time and amenity access for the typical tenant pool here? Any planned neighborhood developments (good or bad) we should know about?
- What's the average days-on-market for RENTAL listings here right now (not sales)? A rising rental-DOM trend means longer vacancies and softer asking-rent achievability than the comps imply.
- What's the recent tenant-quality profile in this submarket — average credit score on applications, eviction rate, late-payment / NSF rate, and stable-employment percentage? A property-management company in the area should have these aggregated.
- How much new for-sale + rental construction is in the pipeline within 1–3 miles? Heavy new supply typically softens prices + rents 12–24 months out; constrained supply supports both.
Investment metrics
- 1% rule
- 1.02% ✓
- Cap rate
- 8.91%
- Cash-on-cash
- 9.36%
- DSCR
- 1.42
- GRM
- 8.2
CMA / ARV
- ARV (on-the-fly)
- $194,400
- Comps found
- 10
Show comp detail 10 sales within ~0.75 mi
| Address | Dist | Beds/Ba | Sqft | Sold | Price | $/sf | Match |
|---|---|---|---|---|---|---|---|
| 250 E Telegraph Rd #211 | 0.00mi | 2/2.0 | 1,215 (0%) | 0mo | $264,000 | $217 | 100 |
| 250 E Telegraph Rd #248 | 0.09mi | 3/2.0 (+1) | 1,159 (-5%) | 2mo | $210,000 | $181 | 82 |
| 250 E Telegraph Rd #77 | 0.21mi | 2/2.0 | 1,248 (+3%) | 4mo | $150,000 | $120 | 82 |
| 250 E Telegraph Rd #240 | 0.05mi | 2/2.0 | 1,248 (+3%) | 16mo | $149,000 | $119 | 80 |
| 250 E Telegraph rd #30 Rd #30 | 0.21mi | 3/2.0 (+1) | 1,248 (+3%) | 4mo | $200,000 | $160 | 77 |
| 250 E Telegraph Rd #200 | 0.21mi | 2/2.0 | 1,344 (+11%) | 1mo | $174,600 | $130 | 72 |
| 250 E Telegraph Rd #253 | 0.07mi | 2/— | 1,040 (-14%) | 13mo | $150,000 | $144 | 62 |
| 250 E Telegraph Rd #113 | 0.21mi | 2/— | 1,344 (+11%) | 22mo | $182,500 | $136 | 54 |
| 250-E E Telegraph Rd #149 | 0.21mi | 2/2.0 | 1,368 (+13%) | 22mo | $245,000 | $179 | 51 |
| 250 E Telegraph Rd #188 | 0.21mi | 2/2.0 | 1,040 (-14%) | 20mo | $170,000 | $163 | 50 |
Match score weights: distance 35% · size 25% · config 20% · recency 20%. Top-matched comps best support the ARV.
Projected returns pro-forma
-3.0% appreciation · 3.0% rent growth · sell at horizon
- IRR
- -2.2%
- Equity multiple
- 0.92×
- Total profit
- $-6,315
- Equity at exit
- $40,258
- IRR
- 7.4%
- Equity multiple
- 1.56×
- Total profit
- $42,353
- Equity at exit
- $23,345
Cash invested: $75,600 (down + closing). Projections, not guarantees.
Landlord ↔ Tenant lean methodology
- Overall (STATE)
- 18 Strongly Tenant-Friendly
- State California
- 18 Strongly Tenant-Friendly · D+13
- County
- — inherits STATE
- City
- — inherits STATE
ZIP-level market 93015
- Active inventory
- 61
- Price-to-rent
- 8.2×
Monthly cashflow live
- Estimated rent
- $2,760 medium interval (Pro) →
- Mortgage (P&I)
- −$1,416
- Tax from tax record
- −$62 /mo · $742/yr
- Insurance
- −$112
- HOA
- −$0
- Vacancy / Maint / Mgmt
- −$580
- Net cashflow
- $590
Break-even live
UW: 25.0% down · 7.5% · 30yr · 1.5% tax · 5.0% vac · 8.0% maint · 8.0% mgmt
Financing live
Cash to close
- Down payment
- $67,500
- Closing costs
- $8,100
- Reserves months
- —
- Total cash needed
- —
Loan-product check · same deal, 3 products live
Conventional
25% down · 7.5% · 30yr
- Down + closing
- —
- Monthly P&I
- —
- Monthly cashflow
- —
- DSCR
- —
- Eligible?
- —
Personal DTI + credit; lowest rate.
DSCR
20% down · 8.5% · 30yr
- Down + closing
- —
- Monthly P&I
- —
- Monthly cashflow
- —
- DSCR
- —
- Eligible?
- —
No personal income docs; deal must DSCR.
Hard money
10% down · 12.0% · 12mo
- Down + closing
- —
- Monthly P&I
- —
- Monthly cashflow
- —
- DSCR
- —
- Eligible?
- —
Short-term bridge; refi at stabilization.
Rent comps 3 comps
| Address | Beds | Baths | Sqft | Rent | $/sqft | DOM | Units | Dist |
|---|---|---|---|---|---|---|---|---|
| 152 Main St Fillmore, CA | 2.0 | 1.0 | 750 | $3,500 | $4.67 | 43d | 1 | 0.49mi |
| 147 Sespe Ave Apt B Fillmore, CA | 2.0 | 1.0 | 960 | $2,250 | $2.34 | 15d | 1 | 0.57mi |
| 442 B St Fillmore, CA | 3.0 | 2.0 | 1153 | $3,300 | $2.86 | 1d | 1 | 1.47mi |
Listing history 6 events
-
2026-04-18status Pending
-
2026-04-16$269,999 Active
-
2024-12-13status Pending Sale 354-char remark
Show marketing remark (354 chars)
This mobile home is located in the El Dorado Family MHP and features 2 bedrooms, 2 full bathrooms and a bonus room that can be used as a den, office or guest room. Outside you will find a well-kept yard with grass, a plum tree and tomato plant. Home also has two storage sheds. Park amenities include a large community room, billiard room, pool, and spa.
-
2024-12-13soldstatus $255,000 Closed Sale 354-char remark
Show marketing remark (354 chars)
This mobile home is located in the El Dorado Family MHP and features 2 bedrooms, 2 full bathrooms and a bonus room that can be used as a den, office or guest room. Outside you will find a well-kept yard with grass, a plum tree and tomato plant. Home also has two storage sheds. Park amenities include a large community room, billiard room, pool, and spa.
-
2024-10-28historical Active Under Contract 354-char remark
Show marketing remark (354 chars)
This mobile home is located in the El Dorado Family MHP and features 2 bedrooms, 2 full bathrooms and a bonus room that can be used as a den, office or guest room. Outside you will find a well-kept yard with grass, a plum tree and tomato plant. Home also has two storage sheds. Park amenities include a large community room, billiard room, pool, and spa.
-
2024-09-23$285,600 Active 354-char remark
Show marketing remark (354 chars)
This mobile home is located in the El Dorado Family MHP and features 2 bedrooms, 2 full bathrooms and a bonus room that can be used as a den, office or guest room. Outside you will find a well-kept yard with grass, a plum tree and tomato plant. Home also has two storage sheds. Park amenities include a large community room, billiard room, pool, and spa.
ⓘ Source: listings_history table (triggers on properties + properties_extension) + one-shot
backfill from property_details.listing_events for pre-trigger history.
Tax reassessment forecast CA · Resets to sale price
- Current annual tax
- $742 · $62/mo
- Projected year-2 tax
- $2,052 · $171/mo
- Expected delta
- +$1,310/yr (+$109/mo · 176.4%)
ⓘ Screening estimate from a state-policy table — verify with the county assessor before closing.
Climate risk First Street
- Flood 6/10 Major FEMA zone X · 71% chance over 30 yrs
- Wildfire 7/10 Severe
- Heat 6/10 Major 7 d/yr ≥98°F today · 19 d/yr by 30 yrs out
- Wind 1/10 Low
- Air quality 4/10 Moderate 5 unhealthy d/yr today · 7 by 30 yrs out
Nearby sold comps map
Loading sold comps map…
Walkable amenities ~0.75 mi
Loading nearby amenities…
Taxation est. · year 1
- Rental income
- $33,115
- − Mortgage interest
- −$15,124
- − Property taxes
- −$742
- − Insurance
- −$1,350
- − Repairs & maintenance
- −$2,649
- − Management
- −$2,649
- − Depreciation
- −$7,855
- Taxable income
- $2,746
- Est. tax owed @ 24.0%
- −$659
- After-tax cash flow
- $6,419/yr
For passive investors: Depreciation is non-cash, so a rental often shows a tax loss while cash-flowing — sheltering income. Rental losses are passive: they offset passive income freely, and up to $25,000/yr can offset ordinary (W-2) income if you actively participate and your MAGI is under $100k (phasing out to $0 by $150k); unused losses carry forward. On sale, claimed depreciation is recaptured at up to 25%, and gains may owe capital-gains tax (a 1031 exchange can defer both). Figures are a year-1 estimate at your 24.0% rate — not tax advice; consult a CPA.
Schools (NCES district)
- District
- Fillmore Unified
- NCES district ID
- 0613800
- Math proficiency
- 18% ▼ -1.00%
- Reading proficiency
- 25% ▼ -2.00%
- Median HH income
- $59,326
- Composite
- 23.21/100
- National rank
- #13323
- State rank
- #1196 of 1400 in CA
Livability — Fillmore
- Score
- 74/100
- State rank
- #145
- US rank
- #4935
Category grades
Schools grade is shown separately in the Schools card above.
Census & demographics
- Census place
- Fillmore, CA
- County
- Ventura County · 829,955 people
- City population
- 19,191
- Metro
- Oxnard-Thousand Oaks-Ventura, CA
- Population (ZIP)
- 19,191
- Household income
- $92,777
- Rent vs Own
- Severe rent burden
- 499.0
Population outlook (Ventura County) Hauer SSP2
- Today (2025)
- 895,754 people
- By 2030
- 912,134 · +1.8%
- By 2040
- 931,454 · +4.0%
- By 2050
- 934,609 · +4.3%
- By 2075
- 924,899 · +3.3%
- By 2100
- 864,712 · -3.5%
Race, ethnicity, and origin ACS 2023
- Neighborhood character
- Predominantly Hispanic (72%)
- Race & ethnicity
- Hispanic / Latino 72% Two or more races 23% White 23% Asian 1%
- Hispanic origin (detail)
- Mexican 68%
- Common ancestry
- Slovak 2% Lithuanian 2% Serbian 1%
- Foreign-born
- 22% · Canada
- Languages at home
- 49% English-only · Spanish 50%
Political lean MEDSL · Ventura
- 2024 margin
- D (+15.1) · D 56.1% · R 41.0% · Other 2.9%
- 2008→2024 swing
- +2.8pp toward D · 2008: 12.3pp · 2024: 15.1pp
- All cycles
- 2024: D+15.1 2020: D+21.1 2016: D+16.8 2012: D+5.3 2008: D+12.3
Not yet ingested
- Civics
- —
Market trends
- HPI YoY
- ▼ -1091.27%
- Current HPI
- 297.9157
- Rent YoY
- —
- Metro
- Oxnard-Thousand Oaks-Ventura, CA
- State GDP YoY
- ▲ 3.21%
- F500 in state
- 116
Industry mix (Fortune 500 HQ in CA)
| Industry | F500 HQs | Revenue |
|---|---|---|
| Technology | 27 | $1,492B |
|
||
| Financial Services | 3 | $174B |
|
||
| Retail | 3 | $44B |
|
||
| Insurance | 3 | $26B |
|
||
| Media / Entertainment | 2 | $115B |
|
||
| Pharmaceuticals / Biotech | 2 | $62B |
|
||
Price history
-5.5% since first listed6 events — show timeline
- 2026-04-18 Pending — GEMLS
- 2026-04-16 Listed $269,999 GEMLS
- 2024-12-13 Pending — CRMLS
- 2024-12-13 Sold (MLS) $255,000 CRMLS
- 2024-10-28 Contingent — CRMLS
- 2024-09-23 Listed $285,600 CRMLS
Property tax history
+3.8%/yrLatest (2025): $742 · +60.6% YoY. Source: county tax records.
Cash-flow waterfall
monthlySold comps — $/sqft
last 12 mo · ≤1 miLoading sold comps…