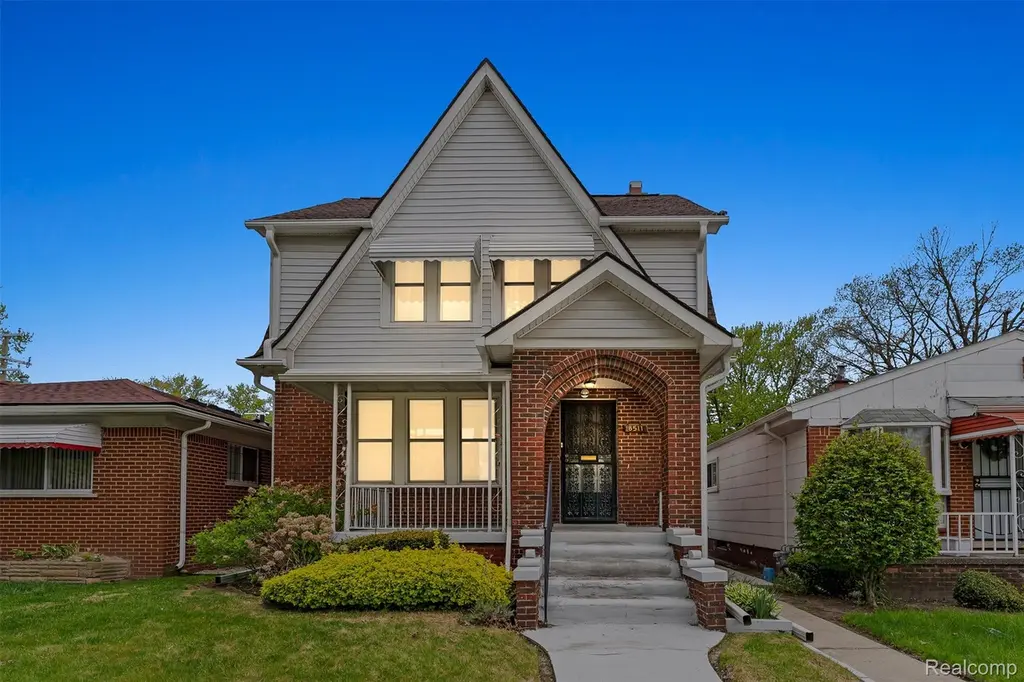
18511 Joseph Campau St · Detroit, MI
Flood risk 1/10 · Minimal
- FEMA flood zone
- X (unshaded)
- Chance of flooding over 30 yrs
- 0.0%
- Est. flood insurance / yr
- $473 – $860
Fire risk 1/10 · Minimal
- Est. fire insurance / yr
- $784 – $1,456
Heat risk 3/10 · Minor
- Hot days now (above 97°F)
- 7 days/yr
- Hot days in 30 yrs
- 15 days/yr
Wind risk 2/10 · Minimal
- Chance of severe wind over 30 yrs
- —
Air-quality risk 4/10 · Minor
- Unhealthy air days now
- 4 days/yr
- Unhealthy air days in 30 yrs
- 6 days/yr
Risk factors via First Street. Map © Google.
Why this score? — see what drove the C+ grade
The composite is a weighted blend of 9 inputs, each scored 0–100. Each bar is that input's sub-score; the figure is the points it added to the 100-point composite (weight × sub-score).
- Cash flow +27.6/30.0
- DSCR +9.7/10.0
- ARV discount +7.5/15.0
- 1% rule +6.9/10.0
- Rent growth +4.2/5.0
- Livability +3.7/5.0
- Condition / age +2.5/5.0
- Schools +1.3/10.0
- Appreciation +0.0/10.0
$105,000
🖨 Deal sheet 📄 Offer letter ✓ Due diligence
Listing remarks MLS
Highest and best. . Due date for offers is Tuesday, May 12th, at 6pm. Look no further than this brick bungalow located in Detroit's established Grixdale area! This 2-bedroom, 2-bath home offers approximately 1,172 sq. ft. of living space with classic character and solid investment potential. Features include hardwood flooring, a finished basement, fireplace, attached garage, and durable brick exterior. This home blends timeless charm with functional space for homeowners or investors alike. Conveniently located near schools, shopping, major roadways, and downtown Detroit access.
Key facts
- Hardwood flooring
- Brick bungalow
- Attached garage
Tags
Property features AI
Exterior
- Parking: Detached 2-car garage
- Utilities: Public water; Public sewer
- Home design: Single-family residence; Two levels; Ground-level entry with steps; Brick construction
- Construction: Block foundation
- Exterior features: Paved road access; Lot approximately 0.06 acres (30 x 87)
Interior
- Bedrooms: 2 total rooms
- Bathrooms: 1 full bathroom; 1 half bathroom
- Heating & cooling: Forced air heating (natural gas); No central cooling
- Interior features: Finished basement
Neighborhood map
What this means for you Summary
Snapshot
- This is a 2-bed/1.0-bath single-family listed at $105k.
Deal economics
- At list price, monthly cash flow is $313 ($4k/yr) — positive.
- The deal already cash-flows at list — no discount required.
- Meets the 1% rule at list price ($1k rent vs $105k).
Location & tenants
- Location reads 73/100 on livability (#218 in MI) — a middle-class / working-renter tenant base. Strengths: amenities A+, commute A+, cost of living A+; Watch: schools F, crime F, employment F.
- Detroit Public Schools Community District (urban): math 10% / reading 24% proficiency, ranked #499 of 540 in MI (top 92%) — low school quality limits family demand, transient renter base, plan for 1-2y turnover; 90% free/reduced lunch — lower-income household profile, screen leases tightly.
- Market conditions: Rents rising fast (+6.7%/yr); 226 active listings in the ZIP; 25 comparable units currently listed for rent nearby; rentals at typical pace (median 18d on market — plan ~3-4 weeks tenant-placement turnaround); lower-income renter base — watch delinquency; 2,639 units permitted in Wayne County in 2024 (1,216 in 5+ unit buildings).
- This rent runs 42% of the median local income ($35k/yr) — at the standard rent-burdened threshold; future hikes will face affordability resistance.
Forward outlook
- Local home prices are declining (-3.0%/yr); year-one equity from $726 of loan paydown is wiped out by about $3k of value loss. Plan a longer hold.
- Wayne County population projected at -17% by 2050 — secular population decline; favor cash flow + early exit over multi-decade hold.
- At projected returns (-3.0% appreciation + 6.7% rent growth), your $29k cash investment doubles in ~7 years — after that, you're playing with house money.
Negotiation context
- Only 12 days on market — expect competitive offers; lowballing is unlikely to land.
- 2 sale attempts with the ask held roughly flat each time — persistent listings suggest the price (not the market) is what's stuck; bring a comps-based counter.
Risks & watch-outs
- Watch-outs: built in 1928 — expect roof / HVAC / electrical / plumbing capex.
Questions for the listing agent
- Built in 1928 — when were the roof, HVAC, electrical panel, plumbing, and water heater last replaced?
- Is there a deadline driving the sale (1031 exchange, divorce, estate, relocation)? That informs how much negotiation room exists.
- Schools are F-rated, which usually means shorter tenancies and higher turnover. Who's the typical renter profile here, and what's been the actual vacancy rate?
- Crime grade is F in this area — have there been break-ins, vandalism, or insurance claims at this property in the last 3 years? What carrier currently insures it and at what premium?
- What's the average days-on-market for RENTAL listings here right now (not sales)? A rising rental-DOM trend means longer vacancies and softer asking-rent achievability than the comps imply.
- What's the recent tenant-quality profile in this submarket — average credit score on applications, eviction rate, late-payment / NSF rate, and stable-employment percentage? A property-management company in the area should have these aggregated.
- How much new for-sale + rental construction is in the pipeline within 1–3 miles? Heavy new supply typically softens prices + rents 12–24 months out; constrained supply supports both.
Investment metrics
- 1% rule
- 1.19% ✓
- Cap rate
- 9.87%
- Cash-on-cash
- 12.78%
- DSCR
- 1.57
- GRM
- 7.0
CMA / ARV
- ARV (median comp)
- $69,969
- List price
- $105,000
- Delta
- 50.07%
- Verdict
- OVERPRICED
- Comps
- 20 within 1.0 mi
Show comp detail 12 sales within ~0.75 mi
| Address | Dist | Beds/Ba | Sqft | Sold | Price | $/sf | Match |
|---|---|---|---|---|---|---|---|
| 19155 Gallagher St | 0.39mi | 3/1.5 (+1) | 1,208 (+3%) | 0mo | $129,900 | $108 | 70 |
| 3952 Stockton St | 0.47mi | 3/1.0 (+1) | 1,149 (-2%) | 1mo | $55,000 | $48 | 69 |
| 19181 Marx St | 0.69mi | 3/1.0 (+1) | 1,152 (-2%) | 1mo | $40,500 | $35 | 59 |
| 19365 Goddard St | 0.61mi | 3/1.0 (+1) | 1,100 (-6%) | 0mo | $97,500 | $89 | 56 |
| 19163 Orleans St | 0.73mi | 2/1.0 | 1,080 (-8%) | 2mo | $32,500 | $30 | 51 |
| 19155 Ryan Rd | 0.62mi | 3/1.0 (+1) | 1,068 (-9%) | 2mo | $45,000 | $42 | 50 |
| 19364 Norwood St | 0.65mi | 2/1.0 | 1,296 (+11%) | 4mo | $20,000 | $15 | 49 |
| 19360 Revere St | 0.61mi | 3/1.0 (+1) | 1,050 (-10%) | 2mo | $78,000 | $74 | 48 |
| 18101 Marx St | 0.57mi | 3/1.5 (+1) | 1,291 (+10%) | 2mo | $37,500 | $29 | 47 |
| 17833 Binder St | 0.55mi | 3/1.0 (+1) | 1,000 (-15%) | 4mo | $46,000 | $46 | 41 |
| 19662 Charest St | 0.72mi | 3/1.0 (+1) | 1,041 (-11%) | 2mo | $69,000 | $66 | 41 |
| 19418 Gallagher St | 0.62mi | 3/1.0 (+1) | 1,336 (+14%) | 4mo | $52,000 | $39 | 39 |
Match score weights: distance 35% · size 25% · config 20% · recency 20%. Top-matched comps best support the ARV.
Projected returns pro-forma
-3.0% appreciation · 6.72% rent growth · sell at horizon
- IRR
- 6.5%
- Equity multiple
- 1.26×
- Total profit
- $7,746
- Equity at exit
- $15,656
- IRR
- 18.8%
- Equity multiple
- 2.83×
- Total profit
- $53,779
- Equity at exit
- $9,078
Cash invested: $29,400 (down + closing). Projections, not guarantees.
Landlord ↔ Tenant lean methodology
- Overall (STATE)
- 62 Landlord-Friendly
- State Michigan
- 62 Landlord-Friendly · EVEN
- County
- — inherits STATE
- City
- — inherits STATE
ZIP-level market 48234
- Home prices YoY
- -11.9%
- Rents YoY
- 6.7%
- Active inventory
- 226
- Price-to-rent
- 7.0×
Monthly cashflow live
- Estimated rent
- $1,245 high interval (Pro) →
- Mortgage (P&I)
- −$551
- Tax from tax record
- −$76 /mo · $912/yr
- Insurance
- −$44
- HOA
- −$0
- Vacancy / Maint / Mgmt
- −$261
- Net cashflow
- $313
Break-even live
UW: 25.0% down · 7.5% · 30yr · 1.5% tax · 5.0% vac · 8.0% maint · 8.0% mgmt
Financing live
Cash to close
- Down payment
- $26,250
- Closing costs
- $3,150
- Reserves months
- —
- Total cash needed
- —
Loan-product check · same deal, 3 products live
Conventional
25% down · 7.5% · 30yr
- Down + closing
- —
- Monthly P&I
- —
- Monthly cashflow
- —
- DSCR
- —
- Eligible?
- —
Personal DTI + credit; lowest rate.
DSCR
20% down · 8.5% · 30yr
- Down + closing
- —
- Monthly P&I
- —
- Monthly cashflow
- —
- DSCR
- —
- Eligible?
- —
No personal income docs; deal must DSCR.
Hard money
10% down · 12.0% · 12mo
- Down + closing
- —
- Monthly P&I
- —
- Monthly cashflow
- —
- DSCR
- —
- Eligible?
- —
Short-term bridge; refi at stabilization.
Rent comps 25 comps
| Address | Beds | Baths | Sqft | Rent | $/sqft | DOM | Units | Dist |
|---|---|---|---|---|---|---|---|---|
| 18666 Joseph Campau St Detroit, MI | 3.0 | 1.0 | 1000 | $1,400 | $1.40 | 17d | 1 | 0.10mi |
| 18084 Goddard St Detroit, MI | 2.0 | 1.5 | 790 | $1,050 | $1.33 | 17d | 1 | 0.28mi |
| 18629 Fleming St Detroit, MI | 3.0 | 1.5 | 900 | $1,150 | $1.28 | 24d | 1 | 0.34mi |
| 18557 Wexford St Detroit, MI | 3.0 | 1.0 | 1216 | $1,250 | $1.03 | 24d | 1 | 0.38mi |
| 18551 Saint Aubin St Detroit, MI | 3.0 | 1.0 | 962 | $1,200 | $1.25 | 17d | 1 | 0.45mi |
| 18882 Marx St Highland Park, MI | 2.0 | 1.0 | 1000 | $1,300 | $1.30 | 44d | 1 | 0.58mi |
| 19360 Revere St Detroit, MI | 3.0 | 1.0 | 1050 | $1,250 | $1.19 | 24d | 1 | 0.58mi |
| 18662 Sunset St Detroit, MI | 2.0 | 1.0 | 726 | $1,250 | $1.72 | 18d | 1 | 0.65mi |
| 19450 Norwood St Detroit, MI | 3.0 | 1.0 | 1000 | $1,200 | $1.20 | 5d | 1 | 0.68mi |
| 18503 Riopelle St Highland Park, MI | 3.0 | 1.0 | 1254 | $1,250 | $1.00 | 5d | 1 | 0.70mi |
| 19694 Gallagher St Detroit, MI | 3.0 | 1.0 | 1000 | $1,150 | $1.15 | 15d | 1 | 0.72mi |
| 20000 Norwood St Detroit, MI | 3.0 | 1.5 | 1150 | $1,200 | $1.04 | 24d | 1 | 0.93mi |
| 19930 Binder St Detroit, MI | 3.0 | 1.0 | 1000 | $1,450 | $1.45 | 17d | 1 | 0.94mi |
| 13929 Arlington St Unit 2 Hamtramck, MI | 2.0 | 1.0 | 700 | $950 | $1.36 | 44d | 1 | 0.94mi |
| 20255 Harned St Detroit, MI | 3.0 | 1.0 | 1000 | $1,374 | $1.37 | 17d | 1 | 1.09mi |
| 19162 Conley St Detroit, MI | 2.0 | 1.0 | 1000 | $1,300 | $1.30 | 44d | 1 | 1.11mi |
| 19450 Fenelon St Detroit, MI | 3.0 | 1.0 | 1062 | $1,384 | $1.30 | 5d | 1 | 1.16mi |
| 18677 Moenart St Detroit, MI | 2.0 | 1.0 | 1470 | $1,200 | $0.82 | 44d | 1 | 1.16mi |
| 18891 Moenart St Detroit, MI | 3.0 | 1.0 | 870 | $1,195 | $1.37 | 17d | 1 | 1.18mi |
| 18891 Moenart St Detroit, MI | 3.0 | 1.0 | 1150 | $1,300 | $1.13 | 2d | 1 | 1.18mi |
| 18884 Bloom St Detroit, MI | 3.0 | 1.0 | 979 | $975 | $1.00 | 22d | 1 | 1.26mi |
| 18884 Bloom St Detroit, MI | 3.0 | 1.0 | 979 | $975 | $1.00 | 44d | 1 | 1.26mi |
| 19361 Moenart St Unit 1 Detroit, MI | 2.0 | 1.0 | 1000 | $1,100 | $1.10 | 24d | 1 | 1.27mi |
| 19260 Bloom St Detroit, MI | 3.0 | 1.0 | 1100 | $1,350 | $1.23 | 4d | 1 | 1.31mi |
| 2034 John B Ave Warren, MI | 3.0 | 1.0 | 920 | $1,261 | $1.37 | 44d | 1 | 1.45mi |
Listing history 2 events
-
2026-05-07$105,000 Active 591-char remark
Show marketing remark (584 chars)
Highest and best. . Due date for offers is Tuesday, May 12th, at 6pm. Look no further than this brick bungalow located in Detroit's established Grixdale area! This 2-bedroom, 2-bath home offers approximately 1,172 sq. ft. of living space with classic character and solid investment potential. Features include hardwood flooring, a finished basement, fireplace, attached garage, and durable brick exterior. This home blends timeless charm with functional space for homeowners or investors alike. Conveniently located near schools, shopping, major roadways, and downtown Detroit access.
-
2026-05-07$105,000 Active 584-char remark
Show marketing remark (584 chars)
Highest and best. . Due date for offers is Tuesday, May 12th, at 6pm. Look no further than this brick bungalow located in Detroit's established Grixdale area! This 2-bedroom, 2-bath home offers approximately 1,172 sq. ft. of living space with classic character and solid investment potential. Features include hardwood flooring, a finished basement, fireplace, attached garage, and durable brick exterior. This home blends timeless charm with functional space for homeowners or investors alike. Conveniently located near schools, shopping, major roadways, and downtown Detroit access.
ⓘ Source: listings_history table (triggers on properties + properties_extension) + one-shot
backfill from property_details.listing_events for pre-trigger history.
Tax reassessment forecast MI · Partial reset (capped growth)
- Current annual tax
- $912 · $76/mo
- Projected year-2 tax
- $1,265 · $105/mo
- Expected delta
- +$352/yr (+$29/mo · 38.6%)
ⓘ Screening estimate from a state-policy table — verify with the county assessor before closing.
Climate risk First Street
- Flood 1/10 Low FEMA zone X (unshaded) · 0% chance over 30 yrs
- Wildfire 1/10 Low
- Heat 3/10 Moderate 7 d/yr ≥97°F today · 15 d/yr by 30 yrs out
- Wind 2/10 Low
- Air quality 4/10 Moderate 4 unhealthy d/yr today · 6 by 30 yrs out
Nearby sold comps map
Loading sold comps map…
Walkable amenities ~0.75 mi
Loading nearby amenities…
Taxation est. · year 1
- Rental income
- $14,940
- − Mortgage interest
- −$5,882
- − Property taxes
- −$912
- − Insurance
- −$525
- − Repairs & maintenance
- −$1,195
- − Management
- −$1,195
- − Depreciation
- −$3,055
- Taxable income
- $2,176
- Est. tax owed @ 24.0%
- −$522
- After-tax cash flow
- $3,235/yr
For passive investors: Depreciation is non-cash, so a rental often shows a tax loss while cash-flowing — sheltering income. Rental losses are passive: they offset passive income freely, and up to $25,000/yr can offset ordinary (W-2) income if you actively participate and your MAGI is under $100k (phasing out to $0 by $150k); unused losses carry forward. On sale, claimed depreciation is recaptured at up to 25%, and gains may owe capital-gains tax (a 1031 exchange can defer both). Figures are a year-1 estimate at your 24.0% rate — not tax advice; consult a CPA.
Schools (NCES district)
- District
- Detroit Public Schools Community District
- NCES district ID
- 2601103
- Math proficiency
- 10% ▼ -2.00%
- Reading proficiency
- 24% ▲ 6.00%
- Median HH income
- $25,815
- Composite
- 13.06/100
- National rank
- #9564
- State rank
- #499 of 540 in MI
Livability — Detroit
- Score
- 73/100
- State rank
- #218
- US rank
- #5427
Category grades
Schools grade is shown separately in the Schools card above.
Census & demographics
- Census place
- Detroit, MI
- County
- Wayne County · 1,562,939 people
- City population
- 572,865
- Metro
- Detroit-Warren-Dearborn, MI
- Population (ZIP)
- 32,760
- Household income
- $35,322
- Rent vs Own
- Severe rent burden
- 2372.0
Population outlook (Wayne County) Hauer SSP2
- Today (2025)
- 1,675,273 people
- By 2030
- 1,620,300 · -3.3%
- By 2040
- 1,502,341 · -10.3%
- By 2050
- 1,384,039 · -17.4%
- By 2075
- 1,124,592 · -32.9%
- By 2100
- 881,193 · -47.4%
Race, ethnicity, and origin ACS 2023
- Neighborhood character
- Predominantly Black (94%)
- Race & ethnicity
- Black 94% White 3% Two or more races 1%
- Common ancestry
- Romanian 1%
- Foreign-born
- 2% · Canada, Vietnam, Philippines
- Languages at home
- 97% English-only · French/Haitian/Cajun 1%
Political lean MEDSL · Wayne
- 2024 margin
- Strong D (+29.0) · D 62.7% · R 33.7% · Other 3.6%
- 2008→2024 swing
- -20.5pp toward R · 2008: 49.5pp · 2024: 29.0pp
- All cycles
- 2024: D+29.0 2020: D+38.1 2016: D+37.3 2012: D+46.9 2008: D+49.5
Not yet ingested
- Civics
- —
Market trends
- HPI YoY
- ▼ -44.65%
- Current HPI
- 328.8978
- Rent YoY
- ▲ 6.72%
- Metro
- Detroit-Warren-Dearborn, MI
- State GDP YoY
- ▲ 1.37%
- F500 in state
- 28
Industry mix (Fortune 500 HQ in MI)
| Industry | F500 HQs | Revenue |
|---|---|---|
| Automotive Parts | 3 | $48B |
|
||
| Automotive | 2 | $372B |
|
||
| Chemicals | 1 | $45B |
|
||
| Automotive Retail | 1 | $29B |
|
||
| Healthcare / Medical Devices | 1 | $23B |
|
||
| Automotive Technology | 1 | $20B |
|
||
Price history
+11.9% since first listed6 events — show timeline
- 2026-05-22 Sold (MLS) $117,500 MiRealSource-MiMLS
- 2026-05-22 Sold (MLS) $117,500 REALCOMP
- 2026-05-19 Pending — MiRealSource-MiMLS
- 2026-05-19 Pending — REALCOMP
- 2026-05-07 Listed $105,000 MiRealSource-MiMLS
- 2026-05-07 Listed $105,000 REALCOMP
Property tax history
-1.3%/yrLatest (2025): $912 · -31.1% YoY. Source: county tax records.
Cash-flow waterfall
monthlySold comps — $/sqft
last 12 mo · ≤1 miLoading sold comps…