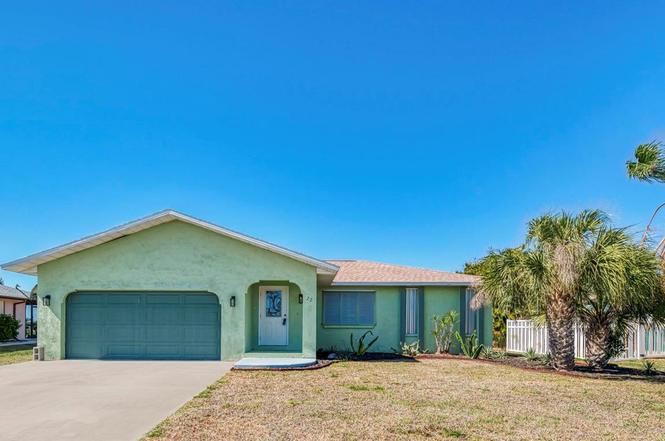
22 Oakland Hills Ct · Rotonda, FL
Flood risk 9/10 · Severe
- FEMA flood zone
- X (shaded)
- Chance of flooding over 30 yrs
- 0.99%
- Est. flood insurance / yr
- $507 – $1,088
Fire risk 3/10 · Minor
- Est. fire insurance / yr
- $947 – $1,759
Heat risk 10/10 · Severe
- Hot days now (above 107°F)
- 7 days/yr
- Hot days in 30 yrs
- 29 days/yr
Wind risk 10/10 · Severe
- Chance of severe wind over 30 yrs
- 99.0%
Air-quality risk 2/10 · Minimal
- Unhealthy air days now
- 1 days/yr
- Unhealthy air days in 30 yrs
- 1 days/yr
Risk factors via First Street. Map © Google.
Why this score? — see what drove the C+ grade
The composite is a weighted blend of 9 inputs, each scored 0–100. Each bar is that input's sub-score; the figure is the points it added to the 100-point composite (weight × sub-score).
- Cash flow +21.1/30.0
- ARV discount +10.6/15.0
- DSCR +6.7/10.0
- Appreciation +5.6/10.0
- 1% rule +5.4/10.0
- Schools +4.6/10.0
- Livability +3.4/5.0
- Condition / age +2.5/5.0
- Rent growth +2.4/5.0
$234,999
🖨 Deal sheet 📄 Offer letter ✓ Due diligence
Listing remarks
Enjoy peaceful mornings and beautiful fairway views in this well-maintained Florida home overlooking the Oakland Hills Golf Course, perfectly positioned along the 1st hole. This prime golf course home offers wide green views and a calm setting you will love coming home to every day. The chain-link fenced backyard provides both privacy and function, complete with two man gates and oversized access. It’s perfect for pets, outdoor projects, or extra storage needs. There is plenty of room to create the outdoor space you’ve always wanted while enjoying open golf course views right behind you. Inside, you’ll find new laminate flooring throughout the entire home, giving every roo
Key facts
- Oversized access
- Golf course views
- Two man gates
Tags
Property features AI
Finance
- Other: Homestead exemption indicated; No lease restrictions indicated; Home warranty included; Public records used for living area and building area
- HOA & community: Has HOA (Association: Derrick Hedges); Annual association fee: $190 (includes common area taxes, escrow reserves fund, management); Monthly HOA amount: $15.83; Association amenities include a park; Association fee required; Community features: clubhouse, deed restrictions, golf; Pets allowed
Exterior
- Parking: Attached 2-car garage (25 x 21); Driveway parking; Guest parking
- Security: Hurricane shutters
- Utilities: Public water; Public sewer; Electricity connected; Water connected; Sewer connected
- Home design: Single family residence; Residential property; One story; Southeast facing; Completed condition; Accessible hallways and grip-accessible features
- Construction: Block and stucco construction; Shingle roof; Slab foundation; Built on one level
- Exterior features: Covered screened patio/porch; Hurricane shutters; Exterior lighting; Rain gutters; Sliding doors; Irrigation equipment; Mature landscaping; On golf course; Greenbelt; Landscaped
Interior
- Kitchen: Dishwasher; Range; Range hood; Refrigerator; Disposal
- Bedrooms: 3 bedrooms
- Flooring: Laminate flooring; Tile flooring
- Bathrooms: 2 full bathrooms
- Heating & cooling: Central heating; Central air; Mini-split unit(s)
- Interior features: Ceiling fans; Thermostat; Window treatments; Aluminum window frames
- Laundry & utility: Washer hookup; Dryer hookup (electric); Laundry located in garage
Neighborhood map
What this means for you Summary
Snapshot
- This is a 2-bed/2.0-bath single-family listed at $235k.
Deal economics
- At list price, monthly cash flow is $268 ($3k/yr) — positive.
- The deal already cash-flows at list — no discount required.
- Meets the 1% rule at list price ($2k rent vs $235k).
- Recommended offer: $221k (6.0% below list) — sets the bar for market timing.
Location & tenants
- Location reads 67/100 on livability (#548 in FL) — a middle-class / working-renter tenant base. Strengths: crime A+, housing A-, cost of living B+; Watch: amenities F, commute F, health & safety D-.
- Charlotte (suburban): math 54% / reading 54% proficiency, ranked #22 of 73 in FL (top 30%) — acceptable for families but not a draw, mixed tenant base, ~2y average lease.
- Zoned schools: Vineland Elementary School (math 74% / reading 67%, grade A-, #333 of 2,144 statewide, top 16%, 579 students, 45% FRL); Lemon Bay High School (math 50% / reading 56%, grade C-, #148 of 667 statewide, top 23%, 1,360 students, 28% FRL) — zoned schools average 37% FRL vs 54% district-wide (17 pts lower); this property's tenant base skews higher-income than the district average.
- Market conditions: Rents soft (-0.2%/yr); 863 active listings in the ZIP; 26 comparable units currently listed for rent nearby; rentals at typical pace (median 21d on market — plan ~3-4 weeks tenant-placement turnaround); solid renter incomes; 4,585 units permitted in Charlotte County in 2024 (703 in 5+ unit buildings).
Forward outlook
- In year one you build about $5k of equity ($2k loan paydown + $3k appreciation (1.2% local appreciation)).
- Charlotte County population projected at +24% by 2050 — long-run rental-demand tailwind backs the buy-and-hold thesis.
- At projected returns (1.2% appreciation + 0.0% rent growth), your $66k cash investment doubles in ~9 years — after that, you're playing with house money.
- By year 7, paydown + projected appreciation supports a ~$30k cash-out refi (75% LTV) — recoverable capital for the next deal without selling this one.
Negotiation context
- It's been on market 77 days — a 6% lower offer ($221k) is reasonable based on typical stale-listing flexibility.
- 3 sale attempts since 5y ago with the ask held roughly flat each time — persistent listings suggest the price (not the market) is what's stuck; bring a comps-based counter.
- Current owner paid $190k; 24% above their basis — modest negotiation headroom, anchor on the comps not their cost.
Risks & watch-outs
- Watch-outs: flood insurance adds $66/mo.
- Climate carrying-cost: severe flood risk; severe wind risk, 99% chance of damaging wind over 30y; extreme-heat days projected 7→29/yr by 2055 (HVAC capex compounding) — expect insurance premiums to compound above CPI over the hold.
Questions for the listing agent
- It's been on market 77 days. Have you received any prior offers? Is the seller open to a 6% concession, seller financing, or rate buy-down credit?
- What's the actual annual flood-insurance premium (NFIP or private), and is the property in a SFHA with mandatory coverage?
- What does the HOA fee cover, when was the last increase, and are there any pending special assessments or reserve-fund shortfalls?
- Why hasn't it sold? Are there any deal-killer items the seller is aware of (foundation, flood, title, zoning, code violations)?
- Is there a deadline driving the sale (1031 exchange, divorce, estate, relocation)? That informs how much negotiation room exists.
- Schools are D-rated, which usually means shorter tenancies and higher turnover. Who's the typical renter profile here, and what's been the actual vacancy rate?
- What's the average days-on-market for RENTAL listings here right now (not sales)? A rising rental-DOM trend means longer vacancies and softer asking-rent achievability than the comps imply.
- What's the recent tenant-quality profile in this submarket — average credit score on applications, eviction rate, late-payment / NSF rate, and stable-employment percentage? A property-management company in the area should have these aggregated.
- How much new for-sale + rental construction is in the pipeline within 1–3 miles? Heavy new supply typically softens prices + rents 12–24 months out; constrained supply supports both.
Investment metrics
- 1% rule
- 1.04% ✓
- Cap rate
- 8.00%
- Cash-on-cash
- 6.10%
- DSCR
- 1.27
- GRM
- 8.0
CMA / ARV
- ARV (on-the-fly)
- $252,300
- Comps found
- 10
Show comp detail 10 sales within ~0.75 mi
| Address | Dist | Beds/Ba | Sqft | Sold | Price | $/sf | Match |
|---|---|---|---|---|---|---|---|
| 73 Caddy Rd | 0.39mi | 2/2.0 | 1,482 (+2%) | 14mo | $250,000 | $169 | 66 |
| 65 Annapolis Ln | 0.36mi | 3/2.0 (+1) | 1,445 (-0%) | 13mo | $284,000 | $197 | 66 |
| 180 Caddy Rd | 0.62mi | 2/2.0 | 1,438 (-1%) | 20mo | $199,500 | $139 | 53 |
| 139 Rotonda Cir | 0.47mi | 2/2.0 | 1,319 (-9%) | 16mo | $282,000 | $214 | 50 |
| 47 Caddy Rd | 0.22mi | 2/2.0 | 1,240 (-14%) | 22mo | $335,000 | $270 | 47 |
| 6689 Gasparilla Pines Blvd | 0.64mi | 2/2.0 | 1,312 (-10%) | 11mo | $210,000 | $160 | 45 |
| 192 Annapolis Ln | 0.73mi | 2/2.0 | 1,270 (-12%) | 1mo | $140,000 | $110 | 45 |
| 117 Caddy Rd | 0.71mi | 2/2.0 | 1,559 (+8%) | 20mo | $272,000 | $174 | 37 |
| 193 Caddy Rd | 0.60mi | 3/2.0 (+1) | 1,270 (-12%) | 23mo | $247,000 | $194 | 27 |
| 198 Annapolis Ln | 0.70mi | 3/2.0 (+1) | 1,649 (+14%) | 21mo | $245,000 | $149 | 22 |
Match score weights: distance 35% · size 25% · config 20% · recency 20%. Top-matched comps best support the ARV.
Projected returns pro-forma
1.25% appreciation · 0.0% rent growth · sell at horizon
- IRR
- 5.2%
- Equity multiple
- 1.26×
- Total profit
- $17,233
- Equity at exit
- $83,297
- IRR
- 7.4%
- Equity multiple
- 1.87×
- Total profit
- $57,244
- Equity at exit
- $113,110
Cash invested: $65,800 (down + closing). Projections, not guarantees.
Landlord ↔ Tenant lean methodology
- Overall (STATE)
- 87 Strongly Landlord-Friendly
- State Florida
- 87 Strongly Landlord-Friendly · R+3
- County
- — inherits STATE
- City
- — inherits STATE
ZIP-level market 33947
- Home prices YoY
- 0.4%
- Rents YoY
- -0.2%
- Active inventory
- 863
- Price-to-rent
- 8.0×
Monthly cashflow live
- Estimated rent
- $2,446 high interval (Pro) →
- Mortgage (P&I)
- −$1,232
- Tax from tax record
- −$253 /mo · $3,031/yr
- Insurance
- −$98
- Flood insurance flood zone
- −$66 /mo · $798/yr
- HOA
- −$15
- Vacancy / Maint / Mgmt
- −$514
- Net cashflow
- $268
Break-even live
UW: 25.0% down · 7.5% · 30yr · 1.5% tax · 5.0% vac · 8.0% maint · 8.0% mgmt
Financing live
Cash to close
- Down payment
- $58,750
- Closing costs
- $7,050
- Reserves months
- —
- Total cash needed
- —
Loan-product check · same deal, 3 products live
Conventional
25% down · 7.5% · 30yr
- Down + closing
- —
- Monthly P&I
- —
- Monthly cashflow
- —
- DSCR
- —
- Eligible?
- —
Personal DTI + credit; lowest rate.
DSCR
20% down · 8.5% · 30yr
- Down + closing
- —
- Monthly P&I
- —
- Monthly cashflow
- —
- DSCR
- —
- Eligible?
- —
No personal income docs; deal must DSCR.
Hard money
10% down · 12.0% · 12mo
- Down + closing
- —
- Monthly P&I
- —
- Monthly cashflow
- —
- DSCR
- —
- Eligible?
- —
Short-term bridge; refi at stabilization.
Rent comps 26 comps
| Address | Beds | Baths | Sqft | Rent | $/sqft | DOM | Units | Dist |
|---|---|---|---|---|---|---|---|---|
| 60 Golfview Rd Rotonda West, FL | 3.0 | 2.0 | 1336 | $5,550 | $4.15 | 21d | 1 | 0.31mi |
| 93 Boundary Blvd #303 Rotonda West, FL | 2.0 | 2.0 | 1228 | $2,800 | $2.28 | 13d | 1 | 0.34mi |
| 18 Golfview Ct Rotonda West, FL | 3.0 | 2.0 | 1686 | $3,000 | $1.78 | 21d | 1 | 0.35mi |
| 113 Boundary Blvd Unit B 1 Rotonda West, FL | 3.0 | 2.0 | 1325 | $1,695 | $1.28 | 21d | 1 | 0.41mi |
| 113 Boundary Blvd #2 Rotonda West, FL | 3.0 | 2.0 | 1323 | $1,625 | $1.23 | 13d | 1 | 0.41mi |
| 37 Oakland Hills Pl Rotonda West, FL | 3.0 | 2.0 | 1321 | $4,000 | $3.03 | 21d | 1 | 0.46mi |
| 65 Oakland Hills Pl Rotonda West, FL | 2.0 | 2.0 | 1444 | $4,500 | $3.12 | 21d | 1 | 0.46mi |
| 98 Caddy Rd Rotonda West, FL | 2.0 | 2.0 | 1167 | $4,000 | $3.43 | 21d | 1 | 0.55mi |
| 230 Annapolis Ln Rotonda West, FL | 3.0 | 2.0 | 1768 | $1,800 | $1.02 | 21d | 1 | 0.64mi |
| 239 Annapolis Ln Rotonda West, FL | 3.0 | 2.0 | 1747 | $2,000 | $1.14 | 21d | 1 | 0.67mi |
| 118 Caddy Rd Rotonda West, FL | 3.0 | 2.0 | 1828 | $2,795 | $1.53 | 21d | 1 | 0.70mi |
| 173 Rotonda Cir Rotonda West, FL | 3.0 | 2.0 | 1350 | $3,200 | $2.37 | 21d | 1 | 0.73mi |
| 199 Rotonda Blvd W Unit C Rotonda West, FL | 2.0 | 2.0 | 974 | $1,475 | $1.51 | 13d | 1 | 0.76mi |
| 195 Rotonda Blvd W Unit A Rotonda West, FL | 3.0 | 2.0 | 1162 | $1,850 | $1.59 | 21d | 1 | 0.76mi |
| 100 Rotonda Lakes Cir Rotonda West, FL | 1.0–3.0 | 1.0–2.0 | 1024 | $1,126 | $1.10 | 13d | 1 | 0.78mi |
| 284 Rotonda Blvd W Rotonda West, FL | 2.0 | 2.0 | 897 | $1,475 | $1.64 | 21d | 1 | 0.83mi |
| 87 Mark Twain Ln Rotonda West, FL | 3.0 | 2.0 | 1235 | $2,500 | $2.02 | 21d | 1 | 0.84mi |
| 42 Mark Twain Ln Rotonda West, FL | 3.0 | 2.5 | 1677 | $2,800 | $1.67 | 21d | 1 | 0.84mi |
| 260 Rotonda Blvd W Unit 2 Rotonda West, FL | 3.0 | 2.0 | 1047 | $1,500 | $1.43 | 21d | 1 | 0.85mi |
| 6800 Placida Rd #283 Englewood, FL | 2.0 | 2.0 | 1092 | $1,500 | $1.37 | 21d | 1 | 1.05mi |
| 226 Boundary Blvd Rotonda West, FL | 2.0 | 2.0 | 1200 | $1,495 | $1.25 | 13d | 1 | 1.07mi |
| 36 Bunker Cir Rotonda West, FL | 2.0 | 2.0 | 1533 | $3,999 | $2.61 | 21d | 1 | 1.24mi |
| 181 Bunker Rd Rotonda West, FL | 2.0 | 2.0 | 1355 | $4,600 | $3.39 | 21d | 1 | 1.28mi |
| 10045 Links Ln #203 Rotonda West, FL | 2.0 | 2.0 | 1543 | $1,450 | $0.94 | 13d | 1 | 1.35mi |
| 278 Boundary Blvd Unit B Rotonda West, FL | 2.0 | 2.0 | 1138 | $1,625 | $1.43 | 21d | 1 | 1.38mi |
| 289 Boundary Blvd Unit 202 Rotonda West, FL | 3.0 | 2.0 | 1168 | $1,645 | $1.41 | 21d | 1 | 1.45mi |
HOA detail
- Monthly dues
- $15 · $180/yr
Listing history 10 events
-
2026-05-19status Pending
-
2026-04-07status Active
-
2026-04-01status Pending
-
2026-02-25$234,999 Active
-
2021-01-06soldstatus $190,000
-
2021-01-04$190,000
-
2021-01-04price $190,000
-
2021-01-04soldstatus $190,000
-
2002-02-23soldstatus $125,200
-
1980-10-01soldstatus $15,300
ⓘ Source: listings_history table (triggers on properties + properties_extension) + one-shot
backfill from property_details.listing_events for pre-trigger history.
Tax reassessment forecast FL · Resets to sale price
- Current annual tax
- $3,031 · $253/mo
- Projected year-2 tax
- $3,031 · $253/mo
- Expected delta
- $0/yr ($0/mo · 0.0%)
ⓘ Screening estimate from a state-policy table — verify with the county assessor before closing.
Climate risk First Street
- Flood 9/10 Extreme FEMA zone X (shaded) · 99% chance over 30 yrs
- Wildfire 3/10 Moderate
- Heat 10/10 Extreme 7 d/yr ≥107°F today · 29 d/yr by 30 yrs out
- Wind 10/10 Extreme 99% chance of damaging wind over 30 yrs
- Air quality 2/10 Low 1 unhealthy d/yr today · 1 by 30 yrs out
Nearby sold comps map
Loading sold comps map…
Walkable amenities ~0.75 mi
Loading nearby amenities…
Taxation est. · year 1
- Rental income
- $29,349
- − Mortgage interest
- −$13,164
- − Property taxes
- −$3,031
- − Insurance
- −$1,972
- − Repairs & maintenance
- −$2,348
- − Management
- −$2,348
- − HOA
- −$180
- − Depreciation
- −$6,836
- Taxable loss
- −$530
- Est. tax savings @ 24.0%
- +$127
- After-tax cash flow
- $3,341/yr
For passive investors: Depreciation is non-cash, so a rental often shows a tax loss while cash-flowing — sheltering income. Rental losses are passive: they offset passive income freely, and up to $25,000/yr can offset ordinary (W-2) income if you actively participate and your MAGI is under $100k (phasing out to $0 by $150k); unused losses carry forward. On sale, claimed depreciation is recaptured at up to 25%, and gains may owe capital-gains tax (a 1031 exchange can defer both). Figures are a year-1 estimate at your 24.0% rate — not tax advice; consult a CPA.
Schools (NCES district)
- District
- Charlotte
- NCES district ID
- 1200240
- Math proficiency
- 54% ▼ -6.00%
- Reading proficiency
- 54% ▼ -1.00%
- Median HH income
- $44,864
- Composite
- 45.62/100
- National rank
- #2586
- State rank
- #22 of 73 in FL
Livability — Rotonda
- Score
- 67/100
- State rank
- #548
- US rank
- #10359
Category grades
Schools grade is shown separately in the Schools card above.
Census & demographics
- Census place
- Rotonda, FL
- County
- Charlotte County · 196,994 people
- City population
- 10,490
- Metro
- Punta Gorda, FL
- Population (ZIP)
- 10,447
- Household income
- $80,091
- Rent vs Own
- Severe rent burden
- 91.0
Population outlook (Charlotte County) Hauer SSP2
- Today (2025)
- 198,646 people
- By 2030
- 210,507 · +6.0%
- By 2040
- 230,857 · +16.2%
- By 2050
- 247,148 · +24.4%
- By 2075
- 281,777 · +41.8%
- By 2100
- 293,609 · +47.8%
Race, ethnicity, and origin ACS 2023
- Neighborhood character
- Predominantly White (96%)
- Race & ethnicity
- White 96% Hispanic / Latino 2% Two or more races 2%
- Common ancestry
- Romanian 5% Lithuanian 4% Slovak 4%
- Foreign-born
- 8% · Canada, Vietnam
- Languages at home
- 93% English-only · Russian/Polish/Slavic 3% Spanish 2% German/W. Germanic 1%
Political lean MEDSL · Charlotte
- 2024 margin
- Solid R (+34.0) · D 32.7% · R 66.7%
- 2008→2024 swing
- -26.7pp toward R · 2008: -7.2pp · 2024: -34.0pp
- All cycles
- 2024: R+34.0 2020: R+26.6 2016: R+27.8 2012: R+14.3 2008: R+7.2
Not yet ingested
- Civics
- —
Market trends
- HPI YoY
- ▲ 1.25%
- Current HPI
- 311.3231
- Rent YoY
- ▼ -0.22%
- Metro
- Punta Gorda, FL
- State GDP YoY
- ▲ 3.28%
- F500 in state
- 36
Industry mix (Fortune 500 HQ in FL)
| Industry | F500 HQs | Revenue |
|---|---|---|
| Industrial Technology | 2 | $29B |
|
||
| Insurance | 2 | $17B |
|
||
| Retail | 1 | $60B |
|
||
| Technology Distribution | 1 | $58B |
|
||
| Homebuilding | 1 | $35B |
|
||
| Technology Manufacturing | 1 | $35B |
|
||
Price history
+1435.9% since first listed10 events — show timeline
- 2026-05-19 Pending — Stellar MLS as Distributed by MLS Grid
- 2026-04-07 Relisted — Stellar MLS as Distributed by MLS Grid
- 2026-04-01 Pending — Stellar MLS as Distributed by MLS Grid
- 2026-02-25 Listed $234,999 Stellar MLS as Distributed by MLS Grid
- 2021-01-06 Sold (Public Records) $190,000 Public Records
- 2021-01-04 Sold (MLS) $190,000 Stellar MLS as Distributed by MLS Grid
- 2021-01-04 Price Changed $190,000 Stellar MLS as Distributed by MLS Grid
- 2021-01-04 Listed $190,000 Stellar MLS as Distributed by MLS Grid
- 2002-02-23 Sold (Public Records) $125,200 Public Records
- 1980-10-01 Sold (Public Records) $15,300 Public Records
Property tax history
+9.3%/yrLatest (2025): $3,031 · -8.2% YoY. Source: county tax records.
Cash-flow waterfall
monthlySold comps — $/sqft
last 12 mo · ≤1 miLoading sold comps…