34555 S K Field Rd · Black Canyon City, AZ
Flood risk 6/10 · Moderate
- FEMA flood zone
- X (shaded)
- Chance of flooding over 30 yrs
- 0.71%
- Est. flood insurance / yr
- $507 – $1,088
Fire risk 7/10 · Major
- Est. fire insurance / yr
- $610 – $1,132
Heat risk 8/10 · Major
- Hot days now (above 109°F)
- 7 days/yr
- Hot days in 30 yrs
- 18 days/yr
Wind risk 1/10 · Minimal
- Chance of severe wind over 30 yrs
- —
Air-quality risk 2/10 · Minimal
- Unhealthy air days now
- 1 days/yr
- Unhealthy air days in 30 yrs
- 1 days/yr
Risk factors via First Street. Map © Google.
Why this score? — see what drove the B grade
The composite is a weighted blend of 9 inputs, each scored 0–100. Each bar is that input's sub-score; the figure is the points it added to the 100-point composite (weight × sub-score).
- Cash flow +28.6/30.0
- DSCR +10.0/10.0
- Appreciation +10.0/10.0
- ARV discount +7.5/15.0
- 1% rule +6.6/10.0
- Livability +2.9/5.0
- Schools +2.8/10.0
- Rent growth +2.5/5.0
- Condition / age +2.5/5.0
$149,900
🖨 Deal sheet 📄 Offer letter ✓ Due diligence
Listing remarks
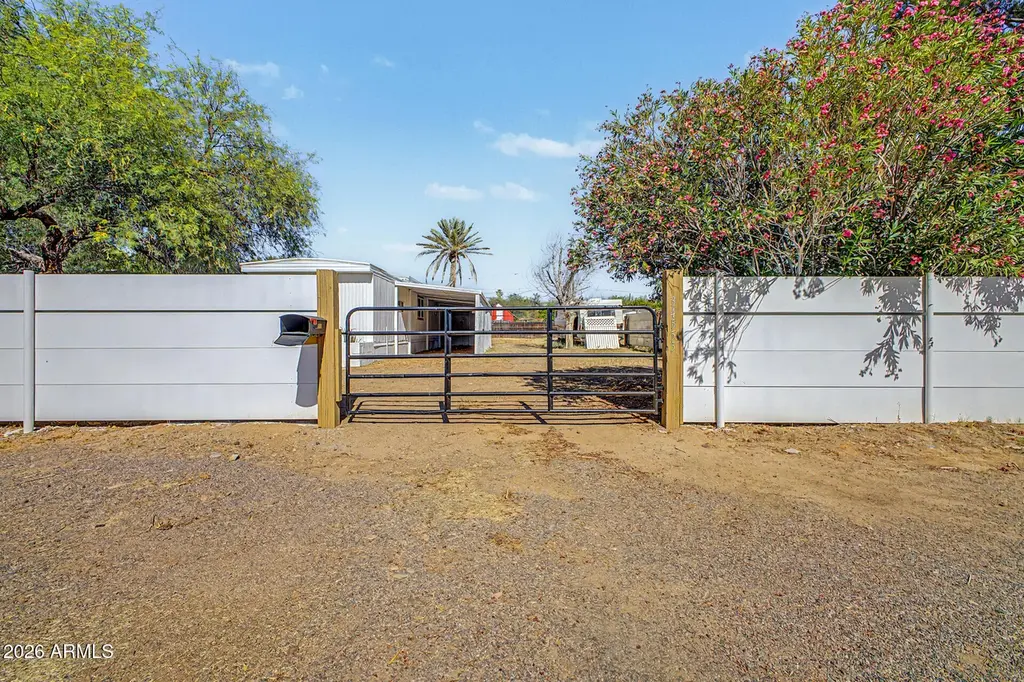
Home, sweet home! Seize the chance to own this fully fenced property, complete with an RV gate, an attached carport, and an inviting covered patio for outdoor relaxation. Inside, you'll find a serene living room with a soothing palette and attractive wood-look flooring. The eat-in kitchen comes with flat-panel wood cabinetry and a two-tier peninsula with a breakfast bar for quick meals. Both bedrooms are cozy and well-sized, offering soft carpeting and a private retreat for a good night's sleep. Venture out onto the vast outdoor space, featuring abundant space for crafting your dream oasis and breathtaking mountain views that provide a picturesque backdrop. Make this yours today!
Key facts
- Attached carport
- Covered patio
- Rv gate
Tags
Property features AI
Finance
- HOA & community: No association fees
Exterior
- Parking: 2 covered parking spaces; RV access and RV gate; 2-car carport
- Utilities: City water; Septic (installed and connected)
- Home design: Manufactured/mobile home; Fee simple ownership; Asphalt road surface
- Construction: Aluminum siding, steel and wood frame construction; Painted exterior; Rolled/hot mop roof
- Exterior features: Chain link and wood fencing; East/West exposure; Dirt front and dirt back; City-maintained road access; Mountain views
Interior
- Kitchen: Disposal; Laminate countertops
- Bedrooms: Up to 2 possible bedrooms
- Flooring: Carpet; Laminate
- Bathrooms: 1 full bathroom
- Heating & cooling: Electric heating; Central air; Ceiling fan(s)
- Interior features: High-speed internet available; Eat-in kitchen; Breakfast bar; No interior steps; Laminate counters
- Laundry & utility: Washer/dryer hook-ups only
Neighborhood map
What this means for you Summary
Snapshot
- This is a 2-bed/1.0-bath manufactured listed at $150k.
Deal economics
- At list price, monthly cash flow is $493 ($6k/yr) — positive.
- The deal already cash-flows at list — no discount required.
- Meets the 1% rule at list price ($2k rent vs $150k).
- Recommended offer: $148k (1.5% below list) — sets the bar for market timing.
Location & tenants
- Location reads 58/100 on livability (#213 in AZ) — a working-class tenant base; expect higher turnover. Strengths: cost of living A+, housing A+, crime A; Watch: amenities F, commute F, employment F.
- Canon Elementary District (4484) (rural): math 25% / reading 35% proficiency, ranked #294 of 501 in AZ (top 59%) — families likely to look elsewhere, expect single-tenant / working-renter base with shorter leases; 65% free/reduced lunch — lower-income household profile, screen leases tightly.
- Zoned schools: Canon School (math 17% / reading 17%, grade F, #814 of 1,109 statewide, top 76%, 131 students, 93% FRL) — zoned schools average 93% FRL vs 65% district-wide (28 pts higher); higher-poverty schools than district average — tighter screening recommended.
- Zoned-school proficiency averages 17% at this address vs 30% district-wide (-13 pts) — the specific schools serving this property underperform the Canon Elementary District (4484) average; the district grade overstates school quality for this exact location.
- Market conditions: 45 active listings in the ZIP; 2,062 units permitted in Yavapai County in 2024 (98 in 5+ unit buildings).
Forward outlook
- In year one you build about $16k of equity ($1k loan paydown + $15k appreciation (10.0% local appreciation)).
- Yavapai County population projected at +10% by 2050 — modest demand growth; plan on rents tracking national, not racing it.
- At projected returns (10.0% appreciation + 3.0% rent growth), your $42k cash investment doubles in ~2 years — after that, you're playing with house money.
- By year 3, paydown + projected appreciation supports a ~$41k cash-out refi (75% LTV) — recoverable capital for the next deal without selling this one.
Negotiation context
- It's been on market 19 days — a 2% lower offer ($148k) is reasonable based on typical stale-listing flexibility.
- 2 sale attempts with the ask held roughly flat each time — persistent listings suggest the price (not the market) is what's stuck; bring a comps-based counter.
- Current owner paid $49k; list at $150k implies a 206% gain — meaningful room to come down on a strong offer.
Risks & watch-outs
- Climate carrying-cost: major flood risk; major wildfire risk; extreme-heat days projected 7→18/yr by 2055 (HVAC capex compounding) — expect insurance premiums to compound above CPI over the hold.
Questions for the listing agent
- Built in 1968 — when were the roof, HVAC, electrical panel, plumbing, and water heater last replaced?
- Is there a deadline driving the sale (1031 exchange, divorce, estate, relocation)? That informs how much negotiation room exists.
- Schools are F-rated, which usually means shorter tenancies and higher turnover. Who's the typical renter profile here, and what's been the actual vacancy rate?
- What's the average days-on-market for RENTAL listings here right now (not sales)? A rising rental-DOM trend means longer vacancies and softer asking-rent achievability than the comps imply.
- What's the recent tenant-quality profile in this submarket — average credit score on applications, eviction rate, late-payment / NSF rate, and stable-employment percentage? A property-management company in the area should have these aggregated.
- How much new for-sale + rental construction is in the pipeline within 1–3 miles? Heavy new supply typically softens prices + rents 12–24 months out; constrained supply supports both.
Investment metrics
- 1% rule
- 1.16% ✓
- Cap rate
- 10.24%
- Cash-on-cash
- 14.08%
- DSCR
- 1.63
- GRM
- 7.2
CMA / ARV
- ARV (on-the-fly)
- $79,296
- Comps found
- 2
Show comp detail 2 sales within ~0.75 mi
| Address | Dist | Beds/Ba | Sqft | Sold | Price | $/sf | Match |
|---|---|---|---|---|---|---|---|
| 34483 S Bertha St | 0.07mi | 2/1.0 | 721 (+7%) | 13mo | $85,000 | $118 | 74 |
| 18749 E Wanda Dr | 0.13mi | 2/1.0 | 745 (+11%) | 14mo | $75,000 | $101 | 64 |
Match score weights: distance 35% · size 25% · config 20% · recency 20%. Top-matched comps best support the ARV.
Projected returns pro-forma
10.0% appreciation · 3.0% rent growth · sell at horizon
- IRR
- 34.6%
- Equity multiple
- 3.69×
- Total profit
- $112,941
- Equity at exit
- $135,042
- IRR
- 29.8%
- Equity multiple
- 8.33×
- Total profit
- $307,786
- Equity at exit
- $291,223
Cash invested: $41,972 (down + closing). Projections, not guarantees.
Landlord ↔ Tenant lean methodology
- Overall (STATE)
- 87 Strongly Landlord-Friendly
- State Arizona
- 87 Strongly Landlord-Friendly · R+3
- County
- — inherits STATE
- City
- — inherits STATE
ZIP-level market 85324
- Home prices YoY
- 7.5%
- Active inventory
- 45
- Price-to-rent
- 7.2×
Monthly cashflow live
- Estimated rent
- $1,739 medium interval (Pro) →
- Mortgage (P&I)
- −$786
- Tax from tax record
- −$33 /mo · $391/yr
- Insurance
- −$62
- HOA
- −$0
- Vacancy / Maint / Mgmt
- −$365
- Net cashflow
- $493
Break-even live
UW: 25.0% down · 7.5% · 30yr · 1.5% tax · 5.0% vac · 8.0% maint · 8.0% mgmt
Financing live
Cash to close
- Down payment
- $37,475
- Closing costs
- $4,497
- Reserves months
- —
- Total cash needed
- —
Loan-product check · same deal, 3 products live
Conventional
25% down · 7.5% · 30yr
- Down + closing
- —
- Monthly P&I
- —
- Monthly cashflow
- —
- DSCR
- —
- Eligible?
- —
Personal DTI + credit; lowest rate.
DSCR
20% down · 8.5% · 30yr
- Down + closing
- —
- Monthly P&I
- —
- Monthly cashflow
- —
- DSCR
- —
- Eligible?
- —
No personal income docs; deal must DSCR.
Hard money
10% down · 12.0% · 12mo
- Down + closing
- —
- Monthly P&I
- —
- Monthly cashflow
- —
- DSCR
- —
- Eligible?
- —
Short-term bridge; refi at stabilization.
Listing history 15 events
-
2026-06-19days on market $149,900 Active 19 DOM
-
2026-06-18days on market $149,900 Active 18 DOM
-
2026-06-17days on market $149,900 Active 17 DOM
-
2026-06-16days on market $149,900 Active 16 DOM
-
2026-06-15days on market $149,900 Active 15 DOM
-
2026-06-14days on market $149,900 Active 13 DOM
-
2026-06-12days on market $149,900 Active 12 DOM
-
2026-06-09days on market $149,900 Active 9 DOM
-
2026-06-08days on market $149,900 Active 8 DOM
-
2026-06-07days on market $149,900 Active 7 DOM
-
2026-06-07days on market $149,900 Active 6 DOM
-
2026-06-04days on market $149,900 Active 3 DOM
-
2026-06-02days on market $149,900 Active 2 DOM
-
2026-06-01remarks 688-char remark
-
2026-06-01$149,900 Active 1 DOM
ⓘ Source: listings_history table (triggers on properties + properties_extension) + one-shot
backfill from property_details.listing_events for pre-trigger history.
Tax reassessment forecast AZ · Resets to sale price
- Current annual tax
- $391 · $33/mo
- Projected year-2 tax
- $989 · $82/mo
- Expected delta
- +$598/yr (+$50/mo · 153.1%)
ⓘ Screening estimate from a state-policy table — verify with the county assessor before closing.
Climate risk First Street
- Flood 6/10 Major FEMA zone X (shaded) · 71% chance over 30 yrs
- Wildfire 7/10 Severe
- Heat 8/10 Severe 7 d/yr ≥109°F today · 18 d/yr by 30 yrs out
- Wind 1/10 Low
- Air quality 2/10 Low 1 unhealthy d/yr today · 1 by 30 yrs out
Nearby sold comps map
Loading sold comps map…
Walkable amenities ~0.75 mi
Loading nearby amenities…
Taxation est. · year 1
- Rental income
- $20,866
- − Mortgage interest
- −$8,397
- − Property taxes
- −$391
- − Insurance
- −$750
- − Repairs & maintenance
- −$1,669
- − Management
- −$1,669
- − Depreciation
- −$4,361
- Taxable income
- $3,629
- Est. tax owed @ 24.0%
- −$871
- After-tax cash flow
- $5,039/yr
For passive investors: Depreciation is non-cash, so a rental often shows a tax loss while cash-flowing — sheltering income. Rental losses are passive: they offset passive income freely, and up to $25,000/yr can offset ordinary (W-2) income if you actively participate and your MAGI is under $100k (phasing out to $0 by $150k); unused losses carry forward. On sale, claimed depreciation is recaptured at up to 25%, and gains may owe capital-gains tax (a 1031 exchange can defer both). Figures are a year-1 estimate at your 24.0% rate — not tax advice; consult a CPA.
Schools (NCES district)
- District
- Canon Elementary District (4484)
- NCES district ID
- 0401650
- Math proficiency
- 25% ▲ 5.00%
- Reading proficiency
- 35% ▬ 0.00%
- Median HH income
- $37,755
- Composite
- 27.85/100
- National rank
- #12286
- State rank
- #294 of 501 in AZ
Livability — Black Canyon City
- Score
- 58/100
- State rank
- #213
- US rank
- #21226
Category grades
Schools grade is shown separately in the Schools card above.
Census & demographics
- Census place
- Black Canyon City, AZ
- Population (ZIP)
- 2,297
Population outlook (Yavapai County) Hauer SSP2
- Today (2025)
- 241,389 people
- By 2030
- 249,523 · +3.4%
- By 2040
- 259,966 · +7.7%
- By 2050
- 264,736 · +9.7%
- By 2075
- 269,334 · +11.6%
- By 2100
- 256,505 · +6.3%
Race, ethnicity, and origin ACS 2023
- Neighborhood character
- Predominantly White (91%)
- Race & ethnicity
- White 91% Two or more races 7% Hispanic / Latino 3%
- Common ancestry
- Iranian 5% Serbian 3% Lithuanian 2%
- Foreign-born
- 1% · Canada
Political lean MEDSL · Yavapai
- 2024 margin
- Solid R (+33.9) · D 32.6% · R 66.5%
- 2008→2024 swing
- -9.5pp toward R · 2008: -24.4pp · 2024: -33.9pp
- All cycles
- 2024: R+33.9 2020: R+29.3 2016: R+31.4 2012: R+30.7 2008: R+24.4
Not yet ingested
- Civics
- —
Market trends
- HPI YoY
- ▲ 29.16%
- Current HPI
- 417.6032
- Rent YoY
- —
- Metro
- —
- State GDP YoY
- ▲ 4.54%
- F500 in state
- 20
Industry mix (Fortune 500 HQ in AZ)
| Industry | F500 HQs | Revenue |
|---|---|---|
| Technology | 2 | $13B |
|
||
| Mining / Metals | 1 | $23B |
|
||
| Environmental Services | 1 | $16B |
|
||
| Metals / Steel | 1 | $14B |
|
||
| Technology Distribution | 1 | $9B |
|
||
| Homebuilding | 1 | $8B |
|
||
Price history
+399.7% since first listed7 events — show timeline
- 2026-05-31 Listed $149,900 ARMLS
- 2026-04-27 Listing Removed — ARMLS
- 2025-12-26 Listed $188,000 ARMLS
- 2025-05-15 Sold (Public Records) $49,000 Public Records
- 2005-08-05 Sold (Public Records) $48,000 Public Records
- 2005-08-05 Sold (Public Records) $48,000 Public Records
- 2000-02-25 Sold (Public Records) $30,000 Public Records
Property tax history
+6.0%/yrLatest (2025): $391 · +55.2% YoY. Source: county tax records.
Cash-flow waterfall
monthlySold comps — $/sqft
last 12 mo · ≤1 miLoading sold comps…