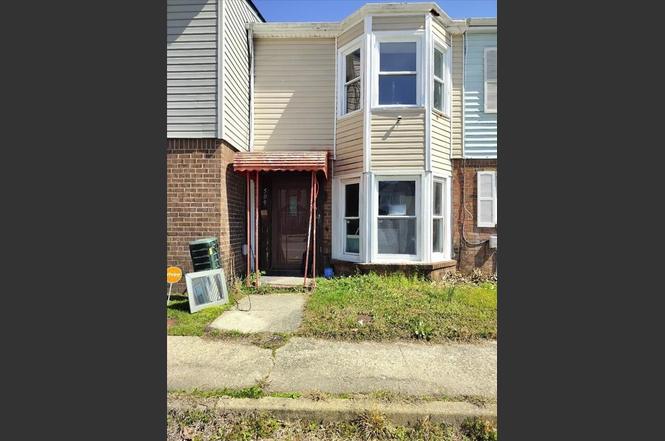
509 Harbour North Dr · Chesapeake, VA
Flood risk 4/10 · Minor
- FEMA flood zone
- AE
- Chance of flooding over 30 yrs
- 0.13%
- Est. flood insurance / yr
- $1,737 – $8,500
Fire risk 1/10 · Minimal
- Est. fire insurance / yr
- $666 – $1,236
Heat risk 9/10 · Severe
- Hot days now (above 107°F)
- 7 days/yr
- Hot days in 30 yrs
- 16 days/yr
Wind risk 8/10 · Major
- Chance of severe wind over 30 yrs
- 80.0%
Air-quality risk 5/10 · Moderate
- Unhealthy air days now
- 6 days/yr
- Unhealthy air days in 30 yrs
- 7 days/yr
Risk factors via First Street. Map © Google.
Why this score? — see what drove the C+ grade
The composite is a weighted blend of 9 inputs, each scored 0–100. Each bar is that input's sub-score; the figure is the points it added to the 100-point composite (weight × sub-score).
- Cash flow +21.5/30.0
- ARV discount +12.4/15.0
- DSCR +6.9/10.0
- Schools +5.8/10.0
- 1% rule +4.8/10.0
- Rent growth +4.4/5.0
- Livability +3.5/5.0
- Condition / age +2.5/5.0
- Appreciation +0.0/10.0
$195,000
🖨 Deal sheet (PDF) 📄 Offer letter ✓ Due diligence
Listing remarks
Affordable home in Great Bridge minutes to Greenbrier mall $10K+ below fair market for TLC. Central heat pump less than 5 years old. Stainless appliances with new counter-depth energy saving refrigerator. Home has Living room, large combo Family room and dining room, a laundry room and a half bath on first floor. 2nd floor has 2 over-size bedrooms and a full bath.
Key facts
- Stainless appliances
- Living room
- Family room
Tags
Property features AI
Finance
- HOA & community: No HOA fees reported
Exterior
- Parking: 2 parking spaces
- Utilities: City/County water; City/County sewer; Electric water heater; Electric power
- Home design: Attached townhouse; 2 stories; Two living levels; Slab foundation
- Construction: Brick and shingle siding; Asphalt shingle roof
- Exterior features: Patio; Back fenced yard
Interior
- Kitchen: Dishwasher; Electric range; Refrigerator; Energy Star appliances
- Bedrooms: Master bedroom on 2nd floor
- Flooring: Vinyl
- Bathrooms: 1 full bathroom; 1 half bathroom
- Heating & cooling: Heat pump heating; Central air conditioning
- Interior features: Cable hookup; Ceiling fan; Vinyl flooring; Utility closet; Utility room; 8 total rooms
- Laundry & utility: Utility room (laundry/utility area)
Neighborhood map
What this means for you Summary
Snapshot
- This is a 2-bed/2.0-bath townhouse listed at $195k.
Deal economics
- At list price, monthly cash flow is $-133 ($-2k/yr) — negative.
- To cash-flow at today's rent, offer at most $172k (12.0% below list).
- To meet the 1% rule (rent ≥ 1% of price), the offer needs to be $191k (2.3% below list).
- Recommended offer: $172k (12.0% below list) — sets the bar for cash-flow.
- Cap rate 8.1% vs local median 3.7% in Chesapeake — top-decile yield for the area; either an underpriced asset or a hidden risk that comps aren't pricing in. Stress-test before assuming the spread holds.
Location & tenants
- Location reads 70/100 on livability (#236 in VA) — a middle-class / working-renter tenant base. Strengths: employment A+, housing A+; Watch: crime C-, cost of living C-, amenities F.
- Chesapeake City Public School District (suburban): math 58% / reading 74% proficiency, ranked #31 of 131 in VA (top 24%) — acceptable for families but not a draw, mixed tenant base, ~2y average lease.
- Zoned schools: Deep Creek Elementary (math 66% / reading 72%, grade A-, #351 of 1,108 statewide, top 32%, 763 students, 45% FRL); Crestwood Middle (math 35% / reading 61%, grade C-, #247 of 342 statewide, top 74%, 553 students, 71% FRL); Great Bridge High (math 60% / reading 87%, grade B+, #124 of 319 statewide, top 40%, 1,624 students, 25% FRL) — zoned schools average 47% FRL vs 28% district-wide (19 pts higher); higher-poverty schools than district average — tighter screening recommended.
- Market conditions: Rents rising fast (+7.8%/yr); 286 active listings in the ZIP; 9 comparable units currently listed for rent nearby; rentals at typical pace (median 19d on market — plan ~3-4 weeks tenant-placement turnaround); solid renter incomes; 597 units permitted in Chesapeake city in 2024 (0 in 5+ unit buildings).
Forward outlook
- Local home prices are declining (-3.0%/yr); year-one equity from $1k of loan paydown is wiped out by about $6k of value loss. Plan a longer hold.
- Chesapeake County population projected at +21% by 2050 — long-run rental-demand tailwind backs the buy-and-hold thesis.
Negotiation context
- Only 10 days on market — expect competitive offers; lowballing is unlikely to land.
- 2 sale attempts since 6y ago with the ask held roughly flat each time — persistent listings suggest the price (not the market) is what's stuck; bring a comps-based counter.
- Current owner paid $45k; list at $195k implies a 333% gain — meaningful room to come down on a strong offer.
Risks & watch-outs
- Watch-outs: flood insurance adds $427/mo.
- Climate carrying-cost: in FEMA flood zone AE (mandatory federal flood insurance); severe wind risk, 80% chance of damaging wind over 30y; extreme-heat days projected 7→16/yr by 2055 (HVAC capex compounding) — expect insurance premiums to compound above CPI over the hold.
Questions for the listing agent
- What do current leases actually rent for vs. the listed asking? Can we see a recent rent roll and the last 12 months of T-12 income?
- Built in 1970 — when were the roof, HVAC, electrical panel, plumbing, and water heater last replaced?
- What's the actual annual flood-insurance premium (NFIP or private), and is the property in a SFHA with mandatory coverage?
- Is there a deadline driving the sale (1031 exchange, divorce, estate, relocation)? That informs how much negotiation room exists.
- Schools are A-rated — typically a magnet for longer-tenancy family renters. What's the average tenant stay here, and is there a school-zone premium baked into asking?
- What's the average days-on-market for RENTAL listings here right now (not sales)? A rising rental-DOM trend means longer vacancies and softer asking-rent achievability than the comps imply.
- What's the recent tenant-quality profile in this submarket — average credit score on applications, eviction rate, late-payment / NSF rate, and stable-employment percentage? A property-management company in the area should have these aggregated.
- How much new for-sale + rental construction is in the pipeline within 1–3 miles? Heavy new supply typically softens prices + rents 12–24 months out; constrained supply supports both.
Investment metrics
- 1% rule
- 0.98% ✗
- Cap rate
- 8.10%
- Cash-on-cash
- 6.46%
- DSCR
- 1.29
- GRM
- 8.5
CMA / ARV
- ARV (on-the-fly)
- $218,832
- Comps found
- 12
Show comp detail 12 sales within ~0.75 mi
| Address | Dist | Beds/Ba | Sqft | Sold | Price | $/sf | Match |
|---|---|---|---|---|---|---|---|
| 614 Harbour Dr N | 0.03mi | 3/1.5 (+1) | 1,226 (+5%) | 2mo | $230,000 | $188 | 81 |
| 705 Harbour North Dr | 0.05mi | 3/1.5 (+1) | 1,227 (+5%) | 1mo | $210,000 | $171 | 81 |
| 405 Harbour North Dr | 0.04mi | 3/1.5 (+1) | 1,216 (+4%) | 4mo | $215,500 | $177 | 80 |
| 809 Harbour North Dr | 0.06mi | 3/1.5 (+1) | 1,226 (+5%) | 5mo | $228,500 | $186 | 77 |
| 600 Rue Saint La Rogue | 0.72mi | 2/2.5 | 1,158 (-0%) | 2mo | $235,000 | $203 | 62 |
| 508 Rue Saint La Rogue | 0.74mi | 2/2.5 | 1,158 (-0%) | 3mo | $210,000 | $181 | 60 |
| 818 Rue Marseille | 0.71mi | 2/2.5 | 1,140 (-2%) | 3mo | $227,500 | $200 | 59 |
| 924 Wickford Dr | 0.69mi | 2/1.5 | 1,193 (+2%) | 4mo | $248,000 | $208 | 58 |
| 417 Cobblewood Arch | 0.45mi | 3/2.0 (+1) | 1,040 (-11%) | 2mo | $295,000 | $284 | 55 |
| 420 Cobblewood Arch | 0.45mi | 3/2.0 (+1) | 1,284 (+10%) | 4mo | $236,000 | $184 | 54 |
| 836 Wickford Dr | 0.66mi | 2/2.0 | 1,279 (+10%) | 2mo | $230,000 | $180 | 51 |
| 1013 Wickford Ct | 0.71mi | 3/1.5 (+1) | 1,280 (+10%) | 3mo | $259,900 | $203 | 40 |
Match score weights: distance 35% · size 25% · config 20% · recency 20%. Top-matched comps best support the ARV.
Projected returns pro-forma
-3.0% appreciation · 7.78% rent growth · sell at horizon
- IRR
- -14.7%
- Equity multiple
- 0.45×
- Total profit
- $-30,229
- Equity at exit
- $29,075
- IRR
- 1.5%
- Equity multiple
- 1.13×
- Total profit
- $7,168
- Equity at exit
- $16,860
Cash invested: $54,600 (down + closing). Projections, not guarantees.
Landlord ↔ Tenant lean methodology
- Overall (STATE)
- 55 Moderately Landlord-Leaning
- State Virginia
- 55 Moderately Landlord-Leaning · D+2
- County
- — inherits STATE
- City
- — inherits STATE
ZIP-level market 23320
- Rents YoY
- 7.8%
- Active inventory
- 286
- Price-to-rent
- 8.5×
Monthly cashflow live
- Estimated rent
- $1,906 high interval (Pro) →
- Mortgage (P&I)
- −$1,023
- Tax from tax record
- −$108 /mo · $1,292/yr
- Insurance
- −$81
- Flood insurance flood zone
- −$427 /mo · $5,118/yr
- HOA
- −$0
- Vacancy / Maint / Mgmt
- −$400
- Net cashflow
- $-133
Break-even live
Sensitivity live
| Price | -10% $-22 | -5% $-77 | +0% $-133 | +5% $-188 | +10% $-243 |
|---|---|---|---|---|---|
| Rent | -10% $-283 | -5% $-208 | +0% $-133 | +5% $-57 | +10% $18 |
| Rate | -1.0pp $-34 | -0.5pp $-83 | base $-133 | +0.5pp $-183 | +1.0pp $-235 |
UW: 25.0% down · 7.5% · 30yr · 1.5% tax · 5.0% vac · 8.0% maint · 8.0% mgmt
Financing live
Cash to close
- Down payment
- $48,750
- Closing costs
- $5,850
- Reserves months
- —
- Total cash needed
- —
Loan-product check · same deal, 3 products live
Conventional
25% down · 7.5% · 30yr
- Down + closing
- —
- Monthly P&I
- —
- Monthly cashflow
- —
- DSCR
- —
- Eligible?
- —
Personal DTI + credit; lowest rate.
DSCR
20% down · 8.5% · 30yr
- Down + closing
- —
- Monthly P&I
- —
- Monthly cashflow
- —
- DSCR
- —
- Eligible?
- —
No personal income docs; deal must DSCR.
Hard money
10% down · 12.0% · 12mo
- Down + closing
- —
- Monthly P&I
- —
- Monthly cashflow
- —
- DSCR
- —
- Eligible?
- —
Short-term bridge; refi at stabilization.
Rent comps 9 comps
| Address | Beds | Baths | Sqft | Rent | $/sqft | DOM | Units | Dist |
|---|---|---|---|---|---|---|---|---|
| 906 Wickford Dr Chesapeake, VA | 3.0 | 1.5 | 1300 | $1,950 | $1.50 | 19d | 1 | 0.68mi |
| 921 Wickford Dr Chesapeake, VA | 2.0 | 2.0 | 1060 | $1,400 | $1.32 | 0d | 1 | 0.72mi |
| 824 Huntly Dr Chesapeake, VA | 3.0 | 1.5 | 1268 | $1,750 | $1.38 | 18d | 1 | 0.85mi |
| 208 Crosswinds Dr Chesapeake, VA | 1.0–2.0 | 1.0–2.0 | 819 | $1,910 | $2.33 | 9d | 2 | 1.32mi |
| 208 Crosswinds Dr Unit 00 217104 Chesapeake, VA | 2.0 | 2.0 | 971 | $1,910 | $1.97 | 5d | 1 | 1.33mi |
| 103 Duffield Pl Chesapeake, VA | 3.0 | 2.0 | 1372 | $2,200 | $1.60 | 25d | 1 | 1.37mi |
| 1240 Basswood Ct Chesapeake, VA | 3.0 | 1.5 | 1296 | $1,925 | $1.49 | 16d | 1 | 1.38mi |
| 1222 Corkwood Cir Chesapeake, VA | 3.0 | 2.5 | 1185 | $2,200 | $1.86 | 25d | 1 | 1.41mi |
| 218 Fireweed Ct Chesapeake, VA | 2.0 | 2.5 | 1144 | $1,850 | $1.62 | 22d | 1 | 1.41mi |
Listing history 7 events
-
2026-06-21days on market $195,000 Active 10 DOM
-
2026-06-18days on market $195,000 Active 7 DOM
-
2026-06-17days on market $195,000 Active 6 DOM
-
2026-06-16days on market $195,000 Active 5 DOM
-
2026-06-15days on market $195,000 Active 4 DOM
-
2026-06-13remarks 366-char remark
-
2026-06-13$195,000 Active 2 DOM
ⓘ Source: listings_history table (triggers on properties + properties_extension) + one-shot
backfill from property_details.listing_events for pre-trigger history.
Tax reassessment forecast VA · Resets to sale price
- Current annual tax
- $1,292 · $108/mo
- Projected year-2 tax
- $1,599 · $133/mo
- Expected delta
- +$307/yr (+$26/mo · 23.8%)
ⓘ Screening estimate from a state-policy table — verify with the county assessor before closing.
Climate risk First Street
- Flood 4/10 Moderate FEMA zone AE · 13% chance over 30 yrs
- Wildfire 1/10 Low
- Heat 9/10 Extreme 7 d/yr ≥107°F today · 16 d/yr by 30 yrs out
- Wind 8/10 Severe 80% chance of damaging wind over 30 yrs
- Air quality 5/10 Major 6 unhealthy d/yr today · 7 by 30 yrs out
Nearby sold comps map
Loading sold comps map…
Walkable amenities ~0.75 mi
Loading nearby amenities…
Taxation est. · year 1
- Rental income
- $22,868
- − Mortgage interest
- −$10,923
- − Property taxes
- −$1,292
- − Insurance
- −$6,094
- − Repairs & maintenance
- −$1,829
- − Management
- −$1,829
- − Depreciation
- −$5,673
- Taxable loss
- −$4,772
- Est. tax savings @ 24.0%
- +$1,145
- After-tax cash flow
- $-446/yr
For passive investors: Depreciation is non-cash, so a rental often shows a tax loss while cash-flowing — sheltering income. Rental losses are passive: they offset passive income freely, and up to $25,000/yr can offset ordinary (W-2) income if you actively participate and your MAGI is under $100k (phasing out to $0 by $150k); unused losses carry forward. On sale, claimed depreciation is recaptured at up to 25%, and gains may owe capital-gains tax (a 1031 exchange can defer both). Figures are a year-1 estimate at your 24.0% rate — not tax advice; consult a CPA.
Schools (NCES district)
- District
- Chesapeake City Public School District
- NCES district ID
- 5100810
- Math proficiency
- 58% ▼ -29.00%
- Reading proficiency
- 74% ▼ -7.00%
- Median HH income
- $69,356
- Composite
- 57.84/100
- National rank
- #1047
- State rank
- #31 of 131 in VA
Livability — Chesapeake
- Score
- 70/100
- State rank
- #236
- US rank
- #7942
Category grades
Schools grade is shown separately in the Schools card above.
Census & demographics
- Census place
- Chesapeake, VA
- County
- Chesapeake City · 253,091 people
- City population
- 253,091
- Metro
- Virginia Beach-Norfolk-Newport News, VA-NC
- Population (ZIP)
- 59,108
- Household income
- $84,305
- Rent vs Own
- Severe rent burden
- 2714.0
Population outlook (Chesapeake County) Hauer SSP2
- Today (2025)
- 263,804 people
- By 2030
- 276,798 · +4.9%
- By 2040
- 299,906 · +13.7%
- By 2050
- 318,284 · +20.7%
- By 2075
- 362,137 · +37.3%
- By 2100
- 372,225 · +41.1%
Race, ethnicity, and origin ACS 2023
- Neighborhood character
- Diverse neighborhood (Simpson 0.66)
- Race & ethnicity
- White 49% Black 29% Hispanic / Latino 10% Two or more races 8% Asian 5%
- Hispanic origin (detail)
- Mexican 3% Puerto Rican 1%
- Common ancestry
- Lithuanian 2% Romanian 2% Italian 2%
- Foreign-born
- 9% · Canada
- Languages at home
- 89% English-only · Spanish 6% Tagalog/Filipino 2% French/Haitian/Cajun 1%
Political lean MEDSL · Chesapeake
- 2024 margin
- Toss-up / Even · D 51.3% · R 47.5% · Other 1.2%
- 2008→2024 swing
- +2.5pp toward D · 2008: 1.3pp · 2024: 3.8pp
- All cycles
- 2024: D+3.8 2020: D+6.5 2016: R+1.3 2012: D+1.1 2008: D+1.3
Not yet ingested
- Civics
- —
Market trends
- HPI YoY
- ▼ -241.43%
- Current HPI
- 285.5792
- Rent YoY
- ▲ 7.78%
- Metro
- Virginia Beach-Norfolk-Newport News, VA-NC
- State GDP YoY
- ▲ 2.40%
- F500 in state
- 50
Industry mix (Fortune 500 HQ in VA)
| Industry | F500 HQs | Revenue |
|---|---|---|
| Aerospace / Defense | 4 | $236B |
|
||
| Technology / Defense | 3 | $32B |
|
||
| Financial Services | 2 | $176B |
|
||
| Utilities | 2 | $27B |
|
||
| Insurance | 2 | $25B |
|
||
| Technology | 2 | $15B |
|
||
Price history
+267.9% since first listed4 events — show timeline
- 2026-06-10 Listed $195,000 REINMLS
- 2021-02-18 Sold (Public Records) $45,000 Public Records
- 2020-11-07 Listing Removed — REINMLS
- 2020-10-30 Listed $53,000 REINMLS
Property tax history
+5.4%/yrLatest (2025): $1,292 · +11.3% YoY. Source: county tax records.
Cash-flow waterfall
monthlySold comps — $/sqft
last 12 mo · ≤1 miLoading sold comps…