10608 Hicksboro Rd · Stovall, NC
Flood risk 1/10 · Minimal
- FEMA flood zone
- X (unshaded)
- Chance of flooding over 30 yrs
- 0.0%
- Est. flood insurance / yr
- $507 – $1,088
Fire risk 4/10 · Minor
- Est. fire insurance / yr
- $906 – $1,684
Heat risk 6/10 · Moderate
- Hot days now (above 104°F)
- 7 days/yr
- Hot days in 30 yrs
- 17 days/yr
Wind risk 6/10 · Moderate
- Chance of severe wind over 30 yrs
- 27.0%
Air-quality risk 1/10 · Minimal
- Unhealthy air days now
- 0 days/yr
- Unhealthy air days in 30 yrs
- 0 days/yr
Risk factors via First Street. Map © Google.
Why this score? — see what drove the D grade
The composite is a weighted blend of 9 inputs, each scored 0–100. Each bar is that input's sub-score; the figure is the points it added to the 100-point composite (weight × sub-score).
- Cash flow +15.3/30.0
- ARV discount +7.5/15.0
- DSCR +4.7/10.0
- 1% rule +4.2/10.0
- Livability +3.4/5.0
- Rent growth +2.5/5.0
- Condition / age +2.5/5.0
- Schools +1.9/10.0
- Appreciation +0.0/10.0
$165,000
🖨 Deal sheet (PDF) 📄 Offer letter ✓ Due diligence
Listing remarks
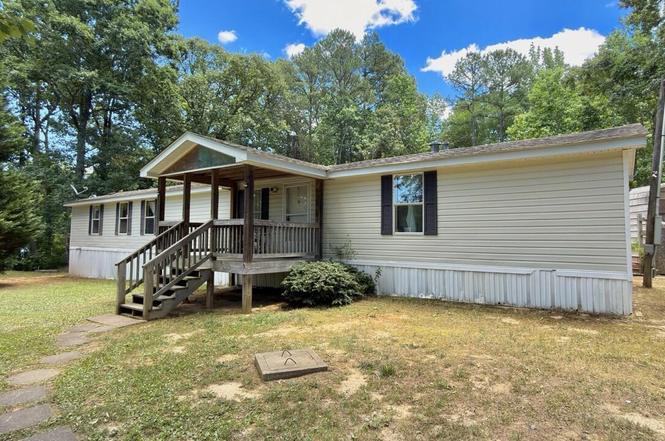
Here's an MLS-friendly public remark that highlights the property's strengths while clearly disclosing the manufactured home status: Welcome to this charming, move-in-ready manufactured home situated on 1.63 beautiful acres in Oxford! Inside, you'll find updated flooring throughout and a beautifully renovated main bathroom, giving the home a fresh and inviting feel. Enjoy relaxing on the spacious covered front porch, perfect for your morning coffee or evening sunsets. The property also features a detached garage, a storage shed, and plenty of room for gardening, recreation, or simply enjoying the privacy of country living. Important: This manufactured home is not on a permanent foundation,
Key facts
- Storage shed
- Updated flooring
- Room for gardening
Tags
Property features AI
Finance
- Other: Lot approximately 1.63 acres; Living area reported as 1,064
- HOA & community: No homeowners association
Exterior
- Parking: 2-car garage; 4 open parking spaces
- Utilities: Public water; Public sewer
- Home design: Manufactured house; One level
- Construction: Vinyl siding and wood siding; Shingle roof; Foundation: Other / See remarks; Built as a manufactured home
- Exterior features: Front porch; Exterior storage
Interior
- Bedrooms: 3 bedrooms (all on the main level)
- Flooring: Luxury vinyl and vinyl
- Bathrooms: 2 full bathrooms
- Heating & cooling: No heating system listed; Central air conditioning
- Interior features: Luxury vinyl and vinyl flooring
Neighborhood map
What this means for you Summary
Snapshot
- This is a 3-bed/2.0-bath manufactured listed at $165k.
Deal economics
- At list price, monthly cash flow is $59 ($708/yr) — positive.
- The deal already cash-flows at list — no discount required.
- To meet the 1% rule (rent ≥ 1% of price), the offer needs to be $152k (8.0% below list).
- Recommended offer: $152k (8.0% below list) — sets the bar for 1% rule.
Location & tenants
- Location reads 67/100 on livability (#231 in NC) — a middle-class / working-renter tenant base. Strengths: cost of living A+, housing A+, health & safety A+; Watch: schools F, crime F, amenities F.
- Vance County Schools (rural): math 20% / reading 27% proficiency, ranked #166 of 178 in NC (top 93%) — low school quality limits family demand, transient renter base, plan for 1-2y turnover; 81% free/reduced lunch — lower-income household profile, screen leases tightly.
- Market conditions: 260 active listings in the ZIP; 73 units permitted in Vance County in 2024 (0 in 5+ unit buildings).
Forward outlook
- Local home prices are declining (-3.0%/yr); year-one equity from $1k of loan paydown is wiped out by about $5k of value loss. Plan a longer hold.
- Vance County population projected at -23% by 2050 — secular population decline; favor cash flow + early exit over multi-decade hold.
Negotiation context
- Only 4 days on market — expect competitive offers; lowballing is unlikely to land.
Risks & watch-outs
- Climate carrying-cost: major wind risk, 27% chance of damaging wind over 30y; extreme-heat days projected 7→17/yr by 2055 (HVAC capex compounding) — expect insurance premiums to compound above CPI over the hold.
Questions for the listing agent
- Is there a deadline driving the sale (1031 exchange, divorce, estate, relocation)? That informs how much negotiation room exists.
- Schools are F-rated, which usually means shorter tenancies and higher turnover. Who's the typical renter profile here, and what's been the actual vacancy rate?
- Crime grade is F in this area — have there been break-ins, vandalism, or insurance claims at this property in the last 3 years? What carrier currently insures it and at what premium?
- The area grade is low — what's the realistic commute time and amenity access for the typical tenant pool here? Any planned neighborhood developments (good or bad) we should know about?
- What's the average days-on-market for RENTAL listings here right now (not sales)? A rising rental-DOM trend means longer vacancies and softer asking-rent achievability than the comps imply.
- What's the recent tenant-quality profile in this submarket — average credit score on applications, eviction rate, late-payment / NSF rate, and stable-employment percentage? A property-management company in the area should have these aggregated.
- How much new for-sale + rental construction is in the pipeline within 1–3 miles? Heavy new supply typically softens prices + rents 12–24 months out; constrained supply supports both.
Investment metrics
- 1% rule
- 0.92% ✗
- Cap rate
- 6.72%
- Cash-on-cash
- 1.53%
- DSCR
- 1.07
- GRM
- 9.1
CMA / ARV
No comps found within radius.
Projected returns pro-forma
-3.0% appreciation · 3.0% rent growth · sell at horizon
- IRR
- -13.8%
- Equity multiple
- 0.50×
- Total profit
- $-22,957
- Equity at exit
- $24,602
- IRR
- -5.0%
- Equity multiple
- 0.67×
- Total profit
- $-15,059
- Equity at exit
- $14,266
Cash invested: $46,200 (down + closing). Projections, not guarantees.
Landlord ↔ Tenant lean methodology
- Overall (STATE)
- 85 Strongly Landlord-Friendly
- State North Carolina
- 85 Strongly Landlord-Friendly · R+3
- County
- — inherits STATE
- City
- — inherits STATE
ZIP-level market 27565
- Active inventory
- 260
- Price-to-rent
- 9.1×
Monthly cashflow live
- Estimated rent
- $1,518 medium interval (Pro) →
- Mortgage (P&I)
- −$865
- Tax est. 1.5%
- −$206 /mo · $2,475/yr
- Insurance
- −$69
- HOA
- −$0
- Vacancy / Maint / Mgmt
- −$319
- Net cashflow
- $59
Break-even live
Sensitivity live
| Price | -10% $173 | -5% $116 | +0% $59 | +5% $2 | +10% $-55 |
|---|---|---|---|---|---|
| Rent | -10% $-61 | -5% $-1 | +0% $59 | +5% $119 | +10% $179 |
| Rate | -1.0pp $142 | -0.5pp $101 | base $59 | +0.5pp $16 | +1.0pp $-27 |
UW: 25.0% down · 7.5% · 30yr · 1.5% tax · 5.0% vac · 8.0% maint · 8.0% mgmt
Financing live
Cash to close
- Down payment
- $41,250
- Closing costs
- $4,950
- Reserves months
- —
- Total cash needed
- —
Loan-product check · same deal, 3 products live
Conventional
25% down · 7.5% · 30yr
- Down + closing
- —
- Monthly P&I
- —
- Monthly cashflow
- —
- DSCR
- —
- Eligible?
- —
Personal DTI + credit; lowest rate.
DSCR
20% down · 8.5% · 30yr
- Down + closing
- —
- Monthly P&I
- —
- Monthly cashflow
- —
- DSCR
- —
- Eligible?
- —
No personal income docs; deal must DSCR.
Hard money
10% down · 12.0% · 12mo
- Down + closing
- —
- Monthly P&I
- —
- Monthly cashflow
- —
- DSCR
- —
- Eligible?
- —
Short-term bridge; refi at stabilization.
Listing history 3 events
-
2026-06-21days on market $165,000 Active 4 DOM
-
2026-06-17remarks 699-char remark
-
2026-06-17$165,000 Active 1 DOM
ⓘ Source: listings_history table (triggers on properties + properties_extension) + one-shot
backfill from property_details.listing_events for pre-trigger history.
Climate risk First Street
- Flood 1/10 Low FEMA zone X (unshaded) · 0% chance over 30 yrs
- Wildfire 4/10 Moderate
- Heat 6/10 Major 7 d/yr ≥104°F today · 17 d/yr by 30 yrs out
- Wind 6/10 Major 27% chance of damaging wind over 30 yrs
- Air quality 1/10 Low 0 unhealthy d/yr today · 0 by 30 yrs out
Nearby sold comps map
Loading sold comps map…
Walkable amenities ~0.75 mi
Loading nearby amenities…
Taxation est. · year 1
- Rental income
- $18,217
- − Mortgage interest
- −$9,243
- − Property taxes
- −$2,475
- − Insurance
- −$825
- − Repairs & maintenance
- −$1,457
- − Management
- −$1,457
- − Depreciation
- −$4,800
- Taxable loss
- −$2,040
- Est. tax savings @ 24.0%
- +$490
- After-tax cash flow
- $1,198/yr
For passive investors: Depreciation is non-cash, so a rental often shows a tax loss while cash-flowing — sheltering income. Rental losses are passive: they offset passive income freely, and up to $25,000/yr can offset ordinary (W-2) income if you actively participate and your MAGI is under $100k (phasing out to $0 by $150k); unused losses carry forward. On sale, claimed depreciation is recaptured at up to 25%, and gains may owe capital-gains tax (a 1031 exchange can defer both). Figures are a year-1 estimate at your 24.0% rate — not tax advice; consult a CPA.
Schools (NCES district)
- District
- Vance County Schools
- NCES district ID
- 3704650
- Math proficiency
- 20% ▼ -7.00%
- Reading proficiency
- 27% ▼ -5.00%
- Median HH income
- $34,323
- Composite
- 19.29/100
- National rank
- #8801
- State rank
- #166 of 178 in NC
Livability — Stovall
- Score
- 67/100
- State rank
- #231
- US rank
- #10718
Category grades
Schools grade is shown separately in the Schools card above.
Census & demographics
- Population (ZIP)
- 23,658
Population outlook (Vance County) Hauer SSP2
- Today (2025)
- 41,985 people
- By 2030
- 40,286 · -4.0%
- By 2040
- 36,372 · -13.4%
- By 2050
- 32,466 · -22.7%
- By 2075
- 24,229 · -42.3%
- By 2100
- 17,784 · -57.6%
Race, ethnicity, and origin ACS 2023
- Neighborhood character
- Diverse neighborhood (Simpson 0.59)
- Race & ethnicity
- White 50% Black 39% Two or more races 6% Hispanic / Latino 6%
- Hispanic origin (detail)
- Mexican 3%
- Common ancestry
- Slovak 1% Serbian 1% Italian 1%
- Foreign-born
- 3% · Canada
- Languages at home
- 95% English-only · Spanish 4%
Political lean MEDSL · Vance
- 2024 margin
- D (+13.3) · D 56.3% · R 42.9%
- 2008→2024 swing
- -13.3pp toward R · 2008: 26.6pp · 2024: 13.3pp
- All cycles
- 2024: D+13.3 2020: D+19.2 2016: D+24.6 2012: D+28.3 2008: D+26.6
Not yet ingested
- Civics
- —
Market trends
- HPI YoY
- ▼ -114.56%
- Current HPI
- 209.2788
- Rent YoY
- —
- Metro
- —
- State GDP YoY
- ▲ 3.28%
- F500 in state
- 26
Industry mix (Fortune 500 HQ in NC)
| Industry | F500 HQs | Revenue |
|---|---|---|
| Financial Services | 2 | $213B |
|
||
| Retail | 2 | $95B |
|
||
| Industrial Conglomerate | 1 | $38B |
|
||
| Metals / Steel | 1 | $35B |
|
||
| Utilities | 1 | $30B |
|
||
| Industrial Machinery | 1 | $19B |
|
||
Price history
1 event — show timeline
- 2026-06-17 Listed $165,000 TMLS
Property tax history
+0.3%/yrLatest (2025): $291 · +8.3% YoY. Source: county tax records.
Cash-flow waterfall
monthlySold comps — $/sqft
last 12 mo · ≤1 miLoading sold comps…