861 Jessees Mill Rd · Lebanon, VA
Flood risk 1/10 · Minimal
- FEMA flood zone
- X (unshaded)
- Chance of flooding over 30 yrs
- 0.0%
- Est. flood insurance / yr
- $473 – $860
Fire risk 7/10 · Major
- Est. fire insurance / yr
- $666 – $1,236
Heat risk 3/10 · Minor
- Hot days now (above 92°F)
- 7 days/yr
- Hot days in 30 yrs
- 20 days/yr
Wind risk 2/10 · Minimal
- Chance of severe wind over 30 yrs
- —
Air-quality risk 1/10 · Minimal
- Unhealthy air days now
- 0 days/yr
- Unhealthy air days in 30 yrs
- 0 days/yr
Risk factors via First Street. Map © Google.
Why this score? — see what drove the D grade
The composite is a weighted blend of 9 inputs, each scored 0–100. Each bar is that input's sub-score; the figure is the points it added to the 100-point composite (weight × sub-score).
- Cash flow +9.5/30.0
- ARV discount +7.5/15.0
- Appreciation +5.9/10.0
- Schools +5.4/10.0
- Livability +3.8/5.0
- 1% rule +2.9/10.0
- DSCR +2.7/10.0
- Rent growth +2.5/5.0
- Condition / age +2.5/5.0
$159,900
🖨 Deal sheet (PDF) 📄 Offer letter ✓ Due diligence
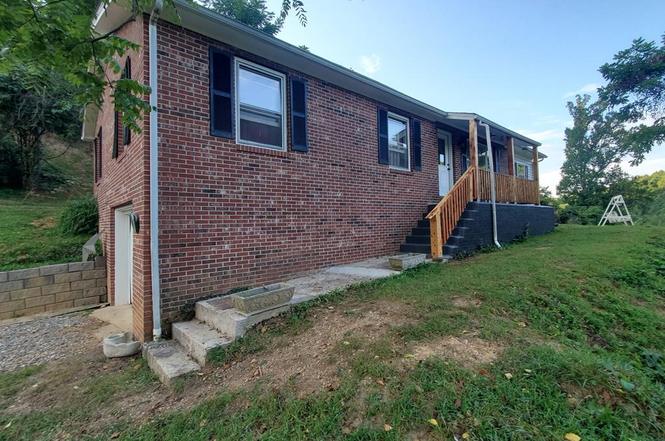
Listing remarks
NICE BRICK RANCH ON FULL UNFINISHED BASEMENT/WITH GARAGE DOOR. PROPERTY IS SITS ON SEMI-PRIVATE HALF ACRE LOT. NEW FAMILY ROOM ADDITION WAS ADDED. 3 BEDROOM, 2 BATH HOME, VERY CLEAN AND READY TO MOVE INTO AND CONVENIENTLY LOCATED ON DESIRABLE JESSEES MILL ROAD. COME SEE THIS ONE TODAY BEFORE ITS GONE!
Key facts
- Brick ranch
- 0.5 acre lot
- Built 1970
Tags
Neighborhood map
What this means for you Summary
Snapshot
- This is a 3-bed/2.0-bath single-family listed at $160k.
Deal economics
- At list price, monthly cash flow is $-111 ($-1k/yr) — negative.
- To cash-flow at today's rent, offer at most $144k (10.0% below list).
- To meet the 1% rule (rent ≥ 1% of price), the offer needs to be $126k (21.3% below list).
- Recommended offer: $126k (21.3% below list) — sets the bar for 1% rule.
- Cap rate 5.5% vs local median 2.7% in Lebanon — top-decile yield for the area; either an underpriced asset or a hidden risk that comps aren't pricing in. Stress-test before assuming the spread holds.
Location & tenants
- Location reads 76/100 on livability (#115 in VA, #3,561 nationally) — a middle-class / working-renter tenant base. Strengths: cost of living A+, health & safety A+; Watch: employment D+, amenities D-, commute F.
- Russell County Public School District (rural): math 58% / reading 73% proficiency, ranked #44 of 131 in VA (top 34%) — acceptable for families but not a draw, mixed tenant base, ~2y average lease.
- Zoned schools: Lebanon Primary (238 students, 94% FRL); Lebanon Middle (math 54% / reading 70%, grade B+, #143 of 342 statewide, top 43%, 291 students, 91% FRL); Lebanon High (math 59% / reading 77%, grade B, #180 of 319 statewide, top 57%, 606 students, 90% FRL) — zoned schools average 92% FRL vs 49% district-wide (42 pts higher); higher-poverty schools than district average — tighter screening recommended.
- Market conditions: 77 active listings in the ZIP; 35 units permitted in Russell County in 2024 (0 in 5+ unit buildings).
Forward outlook
- In year one you build about $4k of equity ($1k loan paydown + $3k appreciation (1.7% local appreciation)).
- Russell County population projected at -26% by 2050 — secular population decline; favor cash flow + early exit over multi-decade hold.
- By year 9, paydown + projected appreciation supports a ~$33k cash-out refi (75% LTV) — recoverable capital for the next deal without selling this one.
Negotiation context
- It's been on market 18 days — a 2% lower offer ($158k) is reasonable based on typical stale-listing flexibility.
Risks & watch-outs
- Climate carrying-cost: major wildfire risk — expect insurance premiums to compound above CPI over the hold.
Questions for the listing agent
- What do current leases actually rent for vs. the listed asking? Can we see a recent rent roll and the last 12 months of T-12 income?
- Built in 1970 — when were the roof, HVAC, electrical panel, plumbing, and water heater last replaced?
- Is there a deadline driving the sale (1031 exchange, divorce, estate, relocation)? That informs how much negotiation room exists.
- Schools are A-rated — typically a magnet for longer-tenancy family renters. What's the average tenant stay here, and is there a school-zone premium baked into asking?
- The area grade is low — what's the realistic commute time and amenity access for the typical tenant pool here? Any planned neighborhood developments (good or bad) we should know about?
- What's the average days-on-market for RENTAL listings here right now (not sales)? A rising rental-DOM trend means longer vacancies and softer asking-rent achievability than the comps imply.
- What's the recent tenant-quality profile in this submarket — average credit score on applications, eviction rate, late-payment / NSF rate, and stable-employment percentage? A property-management company in the area should have these aggregated.
- How much new for-sale + rental construction is in the pipeline within 1–3 miles? Heavy new supply typically softens prices + rents 12–24 months out; constrained supply supports both.
Investment metrics
- 1% rule
- 0.79% ✗
- Cap rate
- 5.46%
- Cash-on-cash
- -2.97%
- DSCR
- 0.87
- GRM
- 10.6
CMA / ARV
No comps found within radius.
Projected returns pro-forma
1.71% appreciation · 3.0% rent growth · sell at horizon
- IRR
- 0.7%
- Equity multiple
- 1.04×
- Total profit
- $1,582
- Equity at exit
- $60,575
- IRR
- 5.0%
- Equity multiple
- 1.66×
- Total profit
- $29,537
- Equity at exit
- $85,353
Cash invested: $44,772 (down + closing). Projections, not guarantees.
Landlord ↔ Tenant lean methodology
- Overall (STATE)
- 55 Moderately Landlord-Leaning
- State Virginia
- 55 Moderately Landlord-Leaning · D+2
- County
- — inherits STATE
- City
- — inherits STATE
ZIP-level market 24266
- Home prices YoY
- 0.9%
- Active inventory
- 77
- Price-to-rent
- 10.6×
Monthly cashflow live
- Estimated rent
- $1,259 medium interval (Pro) →
- Mortgage (P&I)
- −$839
- Tax est. 1.5%
- −$200 /mo · $2,398/yr
- Insurance
- −$67
- HOA
- −$0
- Vacancy / Maint / Mgmt
- −$264
- Net cashflow
- $-111
Break-even live
Sensitivity live
| Price | -10% $0 | -5% $-56 | +0% $-111 | +5% $-166 | +10% $-221 |
|---|---|---|---|---|---|
| Rent | -10% $-210 | -5% $-160 | +0% $-111 | +5% $-61 | +10% $-11 |
| Rate | -1.0pp $-30 | -0.5pp $-70 | base $-111 | +0.5pp $-152 | +1.0pp $-194 |
UW: 25.0% down · 7.5% · 30yr · 1.5% tax · 5.0% vac · 8.0% maint · 8.0% mgmt
Financing live
Cash to close
- Down payment
- $39,975
- Closing costs
- $4,797
- Reserves months
- —
- Total cash needed
- —
Loan-product check · same deal, 3 products live
Conventional
25% down · 7.5% · 30yr
- Down + closing
- —
- Monthly P&I
- —
- Monthly cashflow
- —
- DSCR
- —
- Eligible?
- —
Personal DTI + credit; lowest rate.
DSCR
20% down · 8.5% · 30yr
- Down + closing
- —
- Monthly P&I
- —
- Monthly cashflow
- —
- DSCR
- —
- Eligible?
- —
No personal income docs; deal must DSCR.
Hard money
10% down · 12.0% · 12mo
- Down + closing
- —
- Monthly P&I
- —
- Monthly cashflow
- —
- DSCR
- —
- Eligible?
- —
Short-term bridge; refi at stabilization.
Listing history 2 events
-
2025-09-15status Pending
-
2025-08-28$159,900 Active
ⓘ Source: listings_history table (triggers on properties + properties_extension) + one-shot
backfill from property_details.listing_events for pre-trigger history.
Climate risk First Street
- Flood 1/10 Low FEMA zone X (unshaded) · 0% chance over 30 yrs
- Wildfire 7/10 Severe
- Heat 3/10 Moderate 7 d/yr ≥92°F today · 20 d/yr by 30 yrs out
- Wind 2/10 Low
- Air quality 1/10 Low 0 unhealthy d/yr today · 0 by 30 yrs out
Nearby sold comps map
Loading sold comps map…
Walkable amenities ~0.75 mi
Loading nearby amenities…
Taxation est. · year 1
- Rental income
- $15,102
- − Mortgage interest
- −$8,957
- − Property taxes
- −$2,398
- − Insurance
- −$800
- − Repairs & maintenance
- −$1,208
- − Management
- −$1,208
- − Depreciation
- −$4,652
- Taxable loss
- −$4,120
- Est. tax savings @ 24.0%
- +$989
- After-tax cash flow
- $-341/yr
For passive investors: Depreciation is non-cash, so a rental often shows a tax loss while cash-flowing — sheltering income. Rental losses are passive: they offset passive income freely, and up to $25,000/yr can offset ordinary (W-2) income if you actively participate and your MAGI is under $100k (phasing out to $0 by $150k); unused losses carry forward. On sale, claimed depreciation is recaptured at up to 25%, and gains may owe capital-gains tax (a 1031 exchange can defer both). Figures are a year-1 estimate at your 24.0% rate — not tax advice; consult a CPA.
Schools (NCES district)
- District
- Russell County Public School District
- NCES district ID
- 5103420
- Math proficiency
- 58% ▼ -32.00%
- Reading proficiency
- 73% ▼ -10.00%
- Median HH income
- $34,970
- Composite
- 54.14/100
- National rank
- #1384
- State rank
- #44 of 131 in VA
Livability — Lebanon
- Score
- 76/100
- State rank
- #115
- US rank
- #3561
Category grades
Schools grade is shown separately in the Schools card above.
Census & demographics
- Population (ZIP)
- 8,688
Population outlook (Russell County) Hauer SSP2
- Today (2025)
- 25,787 people
- By 2030
- 24,485 · -5.0%
- By 2040
- 21,750 · -15.7%
- By 2050
- 19,214 · -25.5%
- By 2075
- 14,500 · -43.8%
- By 2100
- 10,629 · -58.8%
Race, ethnicity, and origin ACS 2023
- Neighborhood character
- Predominantly White (97%)
- Race & ethnicity
- White 97% Black 2%
- Common ancestry
- Serbian 2% Italian 1% Slovak 1%
- Foreign-born
- 1%
Political lean MEDSL · Russell
- 2024 margin
- Solid R (+67.5) · D 16.1% · R 83.6%
- 2008→2024 swing
- -54.8pp toward R · 2008: -12.7pp · 2024: -67.5pp
- All cycles
- 2024: R+67.5 2020: R+63.5 2016: R+58.9 2012: R+37.0 2008: R+12.7
Not yet ingested
- Civics
- —
Market trends
- HPI YoY
- ▲ 1.71%
- Current HPI
- 184.8412
- Rent YoY
- —
- Metro
- —
- State GDP YoY
- ▲ 2.40%
- F500 in state
- 50
Industry mix (Fortune 500 HQ in VA)
| Industry | F500 HQs | Revenue |
|---|---|---|
| Aerospace / Defense | 4 | $236B |
|
||
| Technology / Defense | 3 | $32B |
|
||
| Financial Services | 2 | $176B |
|
||
| Utilities | 2 | $27B |
|
||
| Insurance | 2 | $25B |
|
||
| Technology | 2 | $15B |
|
||
Price history
2 events — show timeline
- 2025-09-15 Pending — SWVAR
- 2025-08-28 Listed $159,900 SWVAR
Cash-flow waterfall
monthlySold comps — $/sqft
last 12 mo · ≤1 miLoading sold comps…