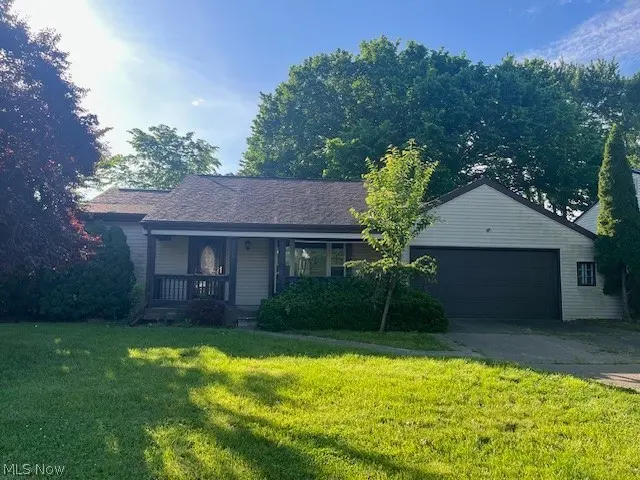
1153 Gulf Rd · Elyria, OH
Flood risk 1/10 · Minimal
- FEMA flood zone
- X (unshaded)
- Chance of flooding over 30 yrs
- 0.0%
- Est. flood insurance / yr
- $473 – $860
Fire risk 1/10 · Minimal
- Est. fire insurance / yr
- $713 – $1,323
Heat risk 3/10 · Minor
- Hot days now (above 99°F)
- 7 days/yr
- Hot days in 30 yrs
- 16 days/yr
Wind risk 1/10 · Minimal
- Chance of severe wind over 30 yrs
- —
Air-quality risk 3/10 · Minor
- Unhealthy air days now
- 2 days/yr
- Unhealthy air days in 30 yrs
- 4 days/yr
Risk factors via First Street. Map © Google.
Why this score? — see what drove the C grade
The composite is a weighted blend of 9 inputs, each scored 0–100. Each bar is that input's sub-score; the figure is the points it added to the 100-point composite (weight × sub-score).
- Cash flow +19.1/30.0
- ARV discount +15.0/15.0
- DSCR +6.0/10.0
- 1% rule +4.7/10.0
- Rent growth +4.2/5.0
- Livability +3.8/5.0
- Condition / age +2.5/5.0
- Schools +2.4/10.0
- Appreciation +0.0/10.0
$149,900
🖨 Deal sheet 📄 Offer letter ✓ Due diligence
Listing remarks MLS
Excellent Buy In Spring Valley Area. Immediate Occupancy. Huge Deck In Fenced Back Yard. Newer High Efficiency Furnace, Roof & Windows. Super Insulated. Partially Finished Basement With Rec Room & Bar. Convenient Location To Mall & Interstates.
Key facts
- Shed
- Large covered deck
- Fenced in yard
Tags
Property features AI
Exterior
- Parking: Attached garage with 2 spaces
- Utilities: Public water; Public sewer
- Home design: Single-story home; Faces west; Entry level: main
- Construction: Vinyl siding; Asphalt/fiberglass roof; Block foundation; Built per assessor records
- Exterior features: Covered porch; Deck; City lot; Lot measures approximately 69 x 130
Interior
- Bedrooms: 3 main-level bedrooms
- Bathrooms: 2 full bathrooms (both on main level)
- Heating & cooling: Forced-air gas heating; Central air conditioning
- Interior features: Full unfinished basement; 6 total rooms; Fixer condition
- Laundry & utility: Laundry in basement
Neighborhood map
What this means for you Summary
Snapshot
- This is a 3-bed/1.0-bath single-family listed at $150k.
Deal economics
- At list price, monthly cash flow is $159 ($2k/yr) — positive.
- The deal already cash-flows at list — no discount required.
- To meet the 1% rule (rent ≥ 1% of price), the offer needs to be $146k (2.6% below list).
- Recommended offer: $146k (2.6% below list) — sets the bar for 1% rule.
- Cap rate 7.6% vs local median 3.8% in Elyria — top-decile yield for the area; either an underpriced asset or a hidden risk that comps aren't pricing in. Stress-test before assuming the spread holds.
Location & tenants
- Location reads 75/100 on livability (#243 in OH, #3,869 nationally) — a middle-class / working-renter tenant base. Strengths: cost of living A+, housing A+, health & safety A; Watch: schools C-, employment D, commute F.
- Elyria City Schools (urban): math 21% / reading 37% proficiency, ranked #586 of 656 in OH (top 89%) — low school quality limits family demand, transient renter base, plan for 1-2y turnover.
- Market conditions: Rents rising fast (+6.7%/yr); 356 active listings in the ZIP; 4 comparable units currently listed for rent nearby; rentals at typical pace (median 16d on market — plan ~3-4 weeks tenant-placement turnaround); 1,098 units permitted in Lorain County in 2024 (20 in 5+ unit buildings).
- This rent runs 31% of the median local income ($56k/yr) — at the standard rent-burdened threshold; future hikes will face affordability resistance.
Forward outlook
- Local home prices are declining (-3.0%/yr); year-one equity from $1k of loan paydown is wiped out by about $4k of value loss. Plan a longer hold.
- At projected returns (-3.0% appreciation + 6.7% rent growth), your $42k cash investment doubles in ~10 years — after that, you're playing with house money.
Negotiation context
- It's been on market 22 days — a 2% lower offer ($148k) is reasonable based on typical stale-listing flexibility.
- 6 sale attempts since 30y ago with the ask held roughly flat each time — persistent listings suggest the price (not the market) is what's stuck; bring a comps-based counter.
- Current owner paid $107k; 40% above their basis — modest negotiation headroom, anchor on the comps not their cost.
Questions for the listing agent
- Built in 1967 — when were the roof, HVAC, electrical panel, plumbing, and water heater last replaced?
- Is there a deadline driving the sale (1031 exchange, divorce, estate, relocation)? That informs how much negotiation room exists.
- What's the average days-on-market for RENTAL listings here right now (not sales)? A rising rental-DOM trend means longer vacancies and softer asking-rent achievability than the comps imply.
- What's the recent tenant-quality profile in this submarket — average credit score on applications, eviction rate, late-payment / NSF rate, and stable-employment percentage? A property-management company in the area should have these aggregated.
- How much new for-sale + rental construction is in the pipeline within 1–3 miles? Heavy new supply typically softens prices + rents 12–24 months out; constrained supply supports both.
Investment metrics
- 1% rule
- 0.97% ✗
- Cap rate
- 7.57%
- Cash-on-cash
- 4.55%
- DSCR
- 1.20
- GRM
- 8.6
CMA / ARV
- ARV (on-the-fly)
- $220,490
- Comps found
- 12
Show comp detail 12 sales within ~0.75 mi
| Address | Dist | Beds/Ba | Sqft | Sold | Price | $/sf | Match |
|---|---|---|---|---|---|---|---|
| 335 Canterbury Ct | 0.36mi | 3/1.5 | 1,320 (+2%) | 7mo | $225,000 | $170 | 73 |
| 129 Whitman Blvd | 0.14mi | 3/1.5 | 1,208 (-7%) | 10mo | $240,000 | $199 | 72 |
| 145 Whitman Blvd | 0.17mi | 3/1.0 | 1,160 (-11%) | 8mo | $189,000 | $163 | 68 |
| 220 Windsor Dr | 0.31mi | 4/1.5 (+1) | 1,384 (+7%) | 4mo | $231,000 | $167 | 64 |
| 220 Alexander Dr | 0.50mi | 2/2.0 (-1) | 1,380 (+6%) | 1mo | $235,000 | $170 | 56 |
| 1073 Rosealee Ave | 0.65mi | 3/2.5 | 1,395 (+8%) | 2mo | $245,000 | $176 | 50 |
| 224 Alexander Dr | 0.50mi | 2/2.0 (-1) | 1,380 (+6%) | 12mo | $249,900 | $181 | 47 |
| 821 Hollywood Dr | 0.61mi | 3/1.5 | 1,435 (+11%) | 6mo | $220,000 | $153 | 47 |
| 201 Alexander Dr | 0.50mi | 2/2.0 (-1) | 1,421 (+10%) | 9mo | $245,000 | $172 | 44 |
| 205 Alexander Dr | 0.50mi | 2/2.0 (-1) | 1,421 (+10%) | 9mo | $239,900 | $169 | 44 |
| 842 Hollywood Blvd | 0.72mi | 3/1.5 | 1,405 (+8%) | 10mo | $209,900 | $149 | 43 |
| 771 Finwood Ct | 0.70mi | 4/1.5 (+1) | 1,394 (+8%) | 12mo | $223,000 | $160 | 38 |
Match score weights: distance 35% · size 25% · config 20% · recency 20%. Top-matched comps best support the ARV.
Projected returns pro-forma
-3.0% appreciation · 6.74% rent growth · sell at horizon
- IRR
- -5.2%
- Equity multiple
- 0.80×
- Total profit
- $-8,467
- Equity at exit
- $22,351
- IRR
- 8.3%
- Equity multiple
- 1.74×
- Total profit
- $30,914
- Equity at exit
- $12,961
Cash invested: $41,972 (down + closing). Projections, not guarantees.
Landlord ↔ Tenant lean methodology
- Overall (STATE)
- 73 Landlord-Friendly
- State Ohio
- 73 Landlord-Friendly · R+6
- County
- — inherits STATE
- City
- — inherits STATE
ZIP-level market 44035
- Rents YoY
- 6.7%
- Active inventory
- 356
- Price-to-rent
- 8.6×
Monthly cashflow live
- Estimated rent
- $1,460 medium interval (Pro) →
- Mortgage (P&I)
- −$786
- Tax from tax record
- −$146 /mo · $1,748/yr
- Insurance
- −$62
- HOA
- −$0
- Vacancy / Maint / Mgmt
- −$307
- Net cashflow
- $159
Break-even live
UW: 25.0% down · 7.5% · 30yr · 1.5% tax · 5.0% vac · 8.0% maint · 8.0% mgmt
Financing live
Cash to close
- Down payment
- $37,475
- Closing costs
- $4,497
- Reserves months
- —
- Total cash needed
- —
Loan-product check · same deal, 3 products live
Conventional
25% down · 7.5% · 30yr
- Down + closing
- —
- Monthly P&I
- —
- Monthly cashflow
- —
- DSCR
- —
- Eligible?
- —
Personal DTI + credit; lowest rate.
DSCR
20% down · 8.5% · 30yr
- Down + closing
- —
- Monthly P&I
- —
- Monthly cashflow
- —
- DSCR
- —
- Eligible?
- —
No personal income docs; deal must DSCR.
Hard money
10% down · 12.0% · 12mo
- Down + closing
- —
- Monthly P&I
- —
- Monthly cashflow
- —
- DSCR
- —
- Eligible?
- —
Short-term bridge; refi at stabilization.
Rent comps 4 comps
| Address | Beds | Baths | Sqft | Rent | $/sqft | DOM | Units | Dist |
|---|---|---|---|---|---|---|---|---|
| 820 Rosewood Dr Elyria, OH | 1.0–3.0 | 1.0–1.5 | 766 | $1,325 | $1.73 | 1d | 1 | 0.79mi |
| 438 Loyola Dr Elyria, OH | 3.0 | 1.5 | 1722 | $1,795 | $1.04 | 43d | 1 | 0.97mi |
| 689 Lucille Dr Elyria, OH | 3.0 | 1.0 | 1225 | $1,425 | $1.16 | 1d | 1 | 1.09mi |
| 327 Beebe Ave Elyria, OH | 3.0 | 1.0 | 976 | $1,650 | $1.69 | 16d | 1 | 1.40mi |
Listing history 27 events
-
2026-06-19status $149,900 Pending 22 DOM
-
2026-06-18days on market $149,900 Active 22 DOM
-
2026-06-17days on market $149,900 Active 21 DOM
-
2026-06-16days on market $149,900 Active 20 DOM
-
2026-06-15days on market $149,900 Active 19 DOM
-
2026-06-13days on market $149,900 Active 17 DOM
-
2026-06-13days on market $149,900 Active 16 DOM
-
2026-06-09days on market $149,900 Active 13 DOM
-
2026-06-08days on market $149,900 Active 12 DOM
-
2026-06-07days on market $149,900 Active 11 DOM
-
2026-06-03days on market $149,900 Active 7 DOM
-
2026-06-02days on market $149,900 Active 6 DOM
-
2026-06-01days on market $149,900 Active 5 DOM
-
2026-05-31days on market $149,900 Active 4 DOM
-
2026-05-26$149,900 Active
-
2023-08-28historical
-
2023-07-16price $189,000
-
2023-07-09$199,000 Active
-
1999-03-18soldstatus $107,000 262-char remark
Show marketing remark (262 chars)
Excellent Buy In Spring Valley Area. Immediate Occupancy. Huge Deck In Fenced Back Yard. Newer High Efficiency Furnace, Roof & Windows. Super Insulated. Partially Finished Basement With Rec Room & Bar. Convenient Location To Mall & Interstates.
-
1999-03-18soldstatus $107,000
Show marketing remark (262 chars)
Excellent Buy In Spring Valley Area. Immediate Occupancy. Huge Deck In Fenced Back Yard. Newer High Efficiency Furnace, Roof & Windows. Super Insulated. Partially Finished Basement With Rec Room & Bar. Convenient Location To Mall & Interstates.
-
1999-01-04$109,900 262-char remark
Show marketing remark (262 chars)
Excellent Buy In Spring Valley Area. Immediate Occupancy. Huge Deck In Fenced Back Yard. Newer High Efficiency Furnace, Roof & Windows. Super Insulated. Partially Finished Basement With Rec Room & Bar. Convenient Location To Mall & Interstates.
-
1998-07-28historical
-
1997-07-29$114,900
-
1997-07-25historical
-
1997-06-09historical
-
1997-04-24$122,900
-
1996-12-19$124,900
ⓘ Source: listings_history table (triggers on properties + properties_extension) + one-shot
backfill from property_details.listing_events for pre-trigger history.
Tax reassessment forecast OH · Partial reset (capped growth)
- Current annual tax
- $1,748 · $146/mo
- Projected year-2 tax
- $2,043 · $170/mo
- Expected delta
- +$295/yr (+$25/mo · 16.9%)
ⓘ Screening estimate from a state-policy table — verify with the county assessor before closing.
Climate risk First Street
- Flood 1/10 Low FEMA zone X (unshaded) · 0% chance over 30 yrs
- Wildfire 1/10 Low
- Heat 3/10 Moderate 7 d/yr ≥99°F today · 16 d/yr by 30 yrs out
- Wind 1/10 Low
- Air quality 3/10 Moderate 2 unhealthy d/yr today · 4 by 30 yrs out
Nearby sold comps map
Loading sold comps map…
Walkable amenities ~0.75 mi
Loading nearby amenities…
Taxation est. · year 1
- Rental income
- $17,517
- − Mortgage interest
- −$8,397
- − Property taxes
- −$1,748
- − Insurance
- −$750
- − Repairs & maintenance
- −$1,401
- − Management
- −$1,401
- − Depreciation
- −$4,361
- Taxable loss
- −$540
- Est. tax savings @ 24.0%
- +$130
- After-tax cash flow
- $2,038/yr
For passive investors: Depreciation is non-cash, so a rental often shows a tax loss while cash-flowing — sheltering income. Rental losses are passive: they offset passive income freely, and up to $25,000/yr can offset ordinary (W-2) income if you actively participate and your MAGI is under $100k (phasing out to $0 by $150k); unused losses carry forward. On sale, claimed depreciation is recaptured at up to 25%, and gains may owe capital-gains tax (a 1031 exchange can defer both). Figures are a year-1 estimate at your 24.0% rate — not tax advice; consult a CPA.
Schools (NCES district)
- District
- Elyria City Schools
- NCES district ID
- 3904394
- Math proficiency
- 21% ▼ -25.00%
- Reading proficiency
- 37% ▼ -15.00%
- Median HH income
- $40,992
- Composite
- 24.45/100
- National rank
- #7670
- State rank
- #586 of 656 in OH
Livability — Elyria
- Score
- 75/100
- State rank
- #243
- US rank
- #3869
Category grades
Schools grade is shown separately in the Schools card above.
Census & demographics
- Census place
- Elyria, OH
- County
- Lorain County · 219,437 people
- City population
- 62,179
- Metro
- Cleveland-Elyria, OH
- Population (ZIP)
- 62,179
- Household income
- $56,408
- Rent vs Own
- Severe rent burden
- 2229.0
Population outlook (Lorain County) Hauer SSP2
- Today (2025)
- 314,924 people
- By 2030
- 317,546 · +0.8%
- By 2040
- 317,962 · +1.0%
- By 2050
- 312,872 · -0.7%
- By 2075
- 301,806 · -4.2%
- By 2100
- 278,271 · -11.6%
Race, ethnicity, and origin ACS 2023
- Neighborhood character
- Predominantly White (70%)
- Race & ethnicity
- White 70% Two or more races 12% Black 11% Hispanic / Latino 10% Asian 1%
- Hispanic origin (detail)
- Mexican 2% Puerto Rican 6%
- Common ancestry
- Romanian 5% Slovak 2% Lithuanian 2%
- Foreign-born
- 2% · China, Canada
- Languages at home
- 94% English-only · Spanish 4% Chinese 1%
Political lean MEDSL · Lorain
- 2024 margin
- Lean R (+5.7) · D 46.7% · R 52.4%
- 2008→2024 swing
- -23.6pp toward R · 2008: 17.9pp · 2024: -5.7pp
- All cycles
- 2024: R+5.7 2020: R+2.5 2016: R+0.3 2012: D+14.4 2008: D+17.9
Not yet ingested
- Civics
- —
Market trends
- HPI YoY
- ▼ -139.09%
- Current HPI
- 199.7354
- Rent YoY
- ▲ 6.74%
- Metro
- Cleveland-Elyria, OH
- State GDP YoY
- ▲ 1.98%
- F500 in state
- 48
Industry mix (Fortune 500 HQ in OH)
| Industry | F500 HQs | Revenue |
|---|---|---|
| Insurance | 3 | $145B |
|
||
| Industrial Machinery | 3 | $49B |
|
||
| Financial Services | 3 | $24B |
|
||
| Consumer Goods | 2 | $93B |
|
||
| Aerospace / Defense | 2 | $47B |
|
||
| Utilities | 2 | $33B |
|
||
Price history
+20.0% since first listed13 events — show timeline
- 2026-05-26 Listed $149,900 MLSNOW
- 2023-08-28 Listing Removed — MLSNOW
- 2023-07-16 Price Changed $189,000 MLSNOW
- 2023-07-09 Listed $199,000 MLSNOW
- 1999-03-18 Sold (Public Records) $107,000 Public Records
- 1999-03-18 Sold (MLS) $107,000 MLSNOW
- 1999-01-04 Listed $109,900 MLSNOW
- 1998-07-28 Listing Removed — MLSNOW
- 1997-07-29 Listed $114,900 MLSNOW
- 1997-07-25 Listing Removed — MLSNOW
- 1997-06-09 Listing Removed — MLSNOW
- 1997-04-24 Listed $122,900 MLSNOW
- 1996-12-19 Listed $124,900 MLSNOW
Property tax history
-0.4%/yrLatest (2025): $1,748 · -23.2% YoY. Source: county tax records.
Cash-flow waterfall
monthlySold comps — $/sqft
last 12 mo · ≤1 miLoading sold comps…