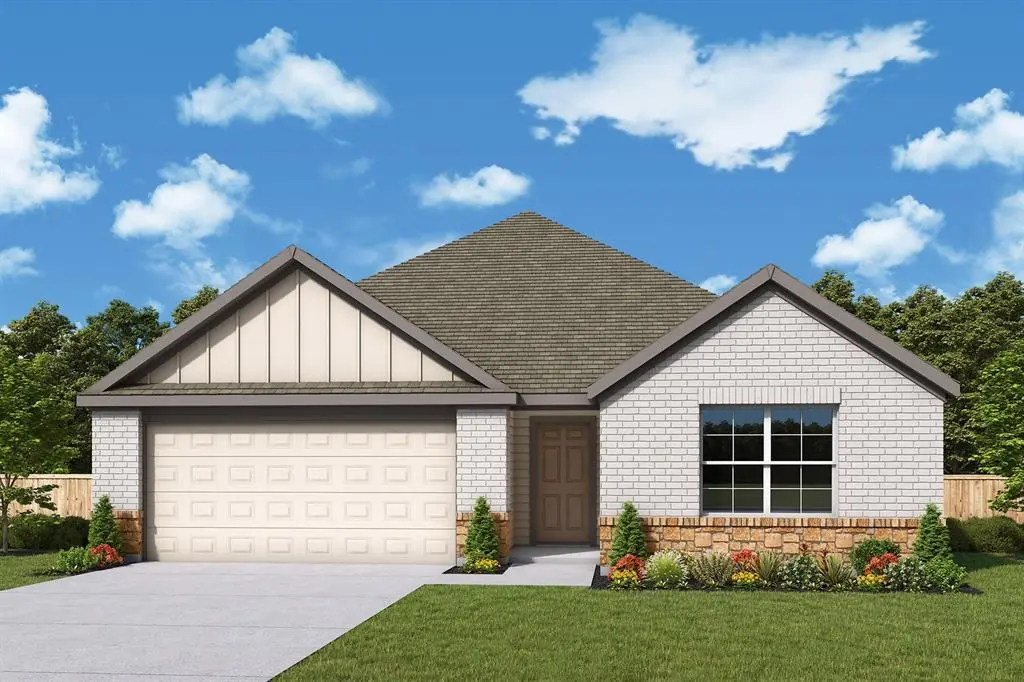
1111 Shorthorn St · Royse City, TX
Flood risk No data
- FEMA flood zone
- —
- Chance of flooding over 30 yrs
- —
- Est. flood insurance / yr
- —
Fire risk No data
- Est. fire insurance / yr
- —
Heat risk No data
- Hot days now (above threshold)
- —
- Hot days in 30 yrs
- —
Wind risk No data
- Chance of severe wind over 30 yrs
- —
Air-quality risk No data
- Unhealthy air days now
- —
- Unhealthy air days in 30 yrs
- —
Risk factors via First Street. Map © Google.
Why this score? — see what drove the D+ grade
The composite is a weighted blend of 9 inputs, each scored 0–100. Each bar is that input's sub-score; the figure is the points it added to the 100-point composite (weight × sub-score).
- Cash flow +13.9/30.0
- ARV discount +12.5/15.0
- Condition / age +5.0/5.0
- 1% rule +4.2/10.0
- DSCR +4.2/10.0
- Schools +3.8/10.0
- Livability +3.8/5.0
- Rent growth +2.2/5.0
- Appreciation +0.0/10.0
$279,990
🖨 Deal sheet 📄 Offer letter ✓ Due diligence
Listing remarks
MLS# 21262498 - Built by Imagination Homes - Jun 2026 completion! ~ Imagination Homes proudly presents The Ballad — a thoughtfully designed 4-bedroom, 2-bathroom home offering 1,962 sq. ft. of open, inviting living space. From the moment you enter, you’re greeted by a wide, welcoming entryway that sets the tone for the home’s spacious and functional layout. Each bedroom is generously sized, providing comfort and flexibility for family, guests, or a home office. At the heart of the home, the open-concept kitchen, dining, and family room create a seamless flow that’s perfect for both everyday living and entertaining. The chef-inspired kitchen boasts abundant cabinetry,
Key facts
- Open concept kitchen
- 6,000 sq ft lot
- 2 garage spots
Tags
Property features AI
Finance
- Other: Community features include pool, playground, sprinklers, greenbelt, and sidewalks; Located in the Clearview Ranch subdivision
- Financial info: Treat as clear loan type; No second mortgage indicated
- HOA & community: Mandatory HOA; Annual association fee of $775; Association covers grounds and structure maintenance and management fees; HOA managed by Neighborhood Management, Inc.
Exterior
- Parking: Attached 2-car garage with automatic opener and garage faces front; 2 covered parking spaces; Driveway
- Security: Smoke detector(s)
- Utilities: City water; City sewer; Individual gas meter; Individual water meter; Electricity available and connected; Underground utilities; Curbs and sidewalks; Community mailbox
- Home design: Single family residence; One story; New construction (incomplete, 2026)
- Construction: Brick and frame construction with siding and radiant barrier; Composition shingle roof; Slab foundation; Year built 2026 (new construction - incomplete)
- Exterior features: Covered porch(es); Covered patio/porch; Back yard with wood fencing; Corner lot; Adjacent to greenbelt
Interior
- Kitchen: Dishwasher; Gas range; Microwave; Disposal; Kitchen island; Breakfast bar; Built-in cabinets; Eat-in kitchen; Walk-in pantry; Solid surface (non-natural) counters
- Bedrooms: 4 bedrooms (all on main level); Primary bedroom with ensuite bath, separate shower, dual sinks, and walk-in closet
- Flooring: Carpet; Luxury vinyl plank
- Bathrooms: 2 full bathrooms
- Heating & cooling: Central heating (natural gas); ENERGY STAR qualified equipment and installation; Central electric air conditioning
- Interior features: Open floorplan; Kitchen island; Pantry; Walk-in closet(s); Granite counters; Cable TV available; High speed internet available
- Laundry & utility: Full-size washer/dryer area; Washer hookup; Electric dryer hookup; Utility room / separate utility room
Neighborhood map
What this means for you Summary
Snapshot
- This is a 4-bed/2.0-bath single-family listed at $280k. Condition is rated excellent.
Deal economics
- At list price, monthly cash flow is $30 ($363/yr) — positive.
- The deal already cash-flows at list — no discount required.
- To meet the 1% rule (rent ≥ 1% of price), the offer needs to be $257k (8.2% below list).
- Recommended offer: $257k (8.2% below list) — sets the bar for 1% rule.
- Cap rate 6.4% vs local median 4.2% in Royse City — top-decile yield for the area; either an underpriced asset or a hidden risk that comps aren't pricing in. Stress-test before assuming the spread holds.
Location & tenants
- Location reads 75/100 on livability (#158 in TX, #4,292 nationally) — a middle-class / working-renter tenant base. Strengths: crime A+, employment A+, housing A+; Watch: schools C-, amenities F, commute F.
- Royse City ISD (rural): math 42% / reading 42% proficiency, ranked #266 of 826 in TX (top 32%) — families likely to look elsewhere, expect single-tenant / working-renter base with shorter leases.
- Market conditions: Rents soft (-1.1%/yr); 1288 active listings in the ZIP; 13 comparable units currently listed for rent nearby; rentals leasing fast (median 7d on market — plan ~1-2 weeks tenant-placement turnaround); high-income renter base; 19,194 units permitted in Collin County in 2024 (3,988 in 5+ unit buildings).
Forward outlook
- Local home prices are declining (-3.0%/yr); year-one equity from $2k of loan paydown is wiped out by about $8k of value loss. Plan a longer hold.
- Collin County population projected at +60% by 2050 — long-run rental-demand tailwind backs the buy-and-hold thesis.
Negotiation context
- It's been on market 43 days — a 3% lower offer ($272k) is reasonable based on typical stale-listing flexibility.
Questions for the listing agent
- It's been on market 43 days. Have you received any prior offers? Is the seller open to a 8% concession, seller financing, or rate buy-down credit?
- What does the HOA fee cover, when was the last increase, and are there any pending special assessments or reserve-fund shortfalls?
- Is there a deadline driving the sale (1031 exchange, divorce, estate, relocation)? That informs how much negotiation room exists.
- The area grade is low — what's the realistic commute time and amenity access for the typical tenant pool here? Any planned neighborhood developments (good or bad) we should know about?
- What's the average days-on-market for RENTAL listings here right now (not sales)? A rising rental-DOM trend means longer vacancies and softer asking-rent achievability than the comps imply.
- What's the recent tenant-quality profile in this submarket — average credit score on applications, eviction rate, late-payment / NSF rate, and stable-employment percentage? A property-management company in the area should have these aggregated.
- How much new for-sale + rental construction is in the pipeline within 1–3 miles? Heavy new supply typically softens prices + rents 12–24 months out; constrained supply supports both.
Investment metrics
- 1% rule
- 0.92% ✗
- Cap rate
- 6.42%
- Cash-on-cash
- 0.46%
- DSCR
- 1.02
- GRM
- 9.1
CMA / ARV
- ARV (median comp)
- $314,990
- List price
- $279,990
- Delta
- -11.11%
- Verdict
- UNDERPRICED
- Comps
- 19 within 1.0 mi
Show comp detail 12 sales within ~0.75 mi
| Address | Dist | Beds/Ba | Sqft | Sold | Price | $/sf | Match |
|---|---|---|---|---|---|---|---|
| 3736 Prairie Chapel Rd | 0.09mi | 4/2.0 | 1,962 (0%) | 0mo | $289,990 | $148 | 95 |
| 3745 Prairie Chapel Rd | 0.12mi | 4/2.0 | 1,962 (0%) | 1mo | $274,990 | $140 | 94 |
| 3819 Prairie Chapel Rd | 0.15mi | 4/2.0 | 1,962 (0%) | 1mo | $279,990 | $143 | 92 |
| 3713 Prairie Chapel Rd | 0.11mi | 4/2.0 | 1,962 (0%) | 3mo | $289,990 | $148 | 92 |
| 3805 Prairie Chapel Rd | 0.12mi | 4/2.0 | 1,865 (-5%) | 1mo | $273,990 | $147 | 85 |
| 3740 Prairie Chapel Rd | 0.09mi | 4/2.0 | 1,865 (-5%) | 4mo | $274,990 | $147 | 84 |
| 3717 Prairie Chapel Rd | 0.11mi | 4/2.0 | 2,083 (+6%) | 2mo | $287,990 | $138 | 83 |
| 3741 Prairie Chapel Rd | 0.12mi | 4/2.0 | 2,083 (+6%) | 3mo | $284,990 | $137 | 82 |
| 3820 Prairie Chapel Rd | 0.13mi | 4/2.0 | 2,083 (+6%) | 3mo | $304,990 | $146 | 81 |
| 3825 Prairie Chapel Rd | 0.16mi | 4/2.0 | 2,167 (+10%) | 3mo | $314,990 | $145 | 73 |
| 910 Saint Matthew Cir | 0.22mi | 3/2.5 (-1) | 2,131 (+9%) | 19mo | $379,000 | $178 | 52 |
| 1112 Pitchfork Rd | 0.52mi | 3/2.5 (-1) | 2,164 (+10%) | 0mo | $387,941 | $179 | 51 |
Match score weights: distance 35% · size 25% · config 20% · recency 20%. Top-matched comps best support the ARV.
Projected returns pro-forma
-3.0% appreciation · 0.0% rent growth · sell at horizon
- IRR
- -19.1%
- Equity multiple
- 0.35×
- Total profit
- $-50,897
- Equity at exit
- $41,747
- IRR
- -19.8%
- Equity multiple
- 0.10×
- Total profit
- $-70,625
- Equity at exit
- $24,208
Cash invested: $78,397 (down + closing). Projections, not guarantees.
Landlord ↔ Tenant lean methodology
- Overall (STATE)
- 87 Strongly Landlord-Friendly
- State Texas
- 87 Strongly Landlord-Friendly · R+5
- County
- — inherits STATE
- City
- — inherits STATE
ZIP-level market 75189
- Home prices YoY
- -25.0%
- Rents YoY
- -1.1%
- Active inventory
- 1288
- Price-to-rent
- 9.1×
Monthly cashflow live
- Estimated rent
- $2,570 high interval (Pro) →
- Mortgage (P&I)
- −$1,468
- Tax est. 1.5%
- −$350 /mo · $4,200/yr
- Insurance
- −$117
- HOA
- −$65
- Vacancy / Maint / Mgmt
- −$540
- Net cashflow
- $30
Break-even live
UW: 25.0% down · 7.5% · 30yr · 1.5% tax · 5.0% vac · 8.0% maint · 8.0% mgmt
Financing live
Cash to close
- Down payment
- $69,998
- Closing costs
- $8,400
- Reserves months
- —
- Total cash needed
- —
Loan-product check · same deal, 3 products live
Conventional
25% down · 7.5% · 30yr
- Down + closing
- —
- Monthly P&I
- —
- Monthly cashflow
- —
- DSCR
- —
- Eligible?
- —
Personal DTI + credit; lowest rate.
DSCR
20% down · 8.5% · 30yr
- Down + closing
- —
- Monthly P&I
- —
- Monthly cashflow
- —
- DSCR
- —
- Eligible?
- —
No personal income docs; deal must DSCR.
Hard money
10% down · 12.0% · 12mo
- Down + closing
- —
- Monthly P&I
- —
- Monthly cashflow
- —
- DSCR
- —
- Eligible?
- —
Short-term bridge; refi at stabilization.
Rent comps 13 comps
| Address | Beds | Baths | Sqft | Rent | $/sqft | DOM | Units | Dist |
|---|---|---|---|---|---|---|---|---|
| 3745 Prairie Chapel Rd Royse City, TX | 4.0 | 2.0 | 1962 | $2,400 | $1.22 | 1d | 1 | 0.09mi |
| 2412 Green River Rd Royse City, TX | 4.0 | 3.5 | 2547 | $2,600 | $1.02 | 1d | 1 | 1.07mi |
| 2420 Green River Rd Royse City, TX | 4.0 | 3.5 | 2262 | $2,700 | $1.19 | 12d | 1 | 1.08mi |
| 2629 Green River Rd Royse City, TX | 4.0 | 3.0 | 2182 | $2,500 | $1.15 | 24d | 1 | 1.11mi |
| 2629 Green River Rd Royse City, TX | 4.0 | 3.0 | 2182 | $2,500 | $1.15 | 1d | 1 | 1.11mi |
| 2413 Spring Side Dr Royse City, TX | 4.0 | 3.0 | 2164 | $2,190 | $1.01 | 43d | 1 | 1.14mi |
| 2717 Green River Rd Royse City, TX | 3.0 | 2.5 | 1935 | $2,199 | $1.14 | 7d | 1 | 1.14mi |
| 2721 Green River Rd Royse City, TX | 4.0 | 3.5 | 2289 | $2,299 | $1.00 | 43d | 1 | 1.14mi |
| 2529 Moser Ln Royse City, TX | 4.0 | 3.0 | 2174 | $2,600 | $1.20 | 1d | 1 | 1.17mi |
| 3109 Leatherwood Ln Royse City, TX | 4.0 | 2.0 | 1800 | $2,295 | $1.27 | 12d | 1 | 1.21mi |
| 2805 Caroline St Royse City, TX | 4.0 | 3.5 | 2550 | $2,450 | $0.96 | 1d | 1 | 1.22mi |
| 3100 Leatherwood Ln Royse City, TX | 4.0 | 2.5 | 2544 | $2,600 | $1.02 | 10d | 1 | 1.24mi |
| 3032 Leatherwood Ln Royse City, TX | 3.0 | 2.0 | 1586 | $2,100 | $1.32 | 5d | 1 | 1.26mi |
HOA detail
- Monthly dues
- $65 · $780/yr
Listing history 15 events
-
2026-06-18days on market $279,990 Active 43 DOM
-
2026-06-17days on market $279,990 Active 42 DOM
-
2026-06-16days on market $279,990 Active 41 DOM
-
2026-06-15days on market $279,990 Active 40 DOM
-
2026-06-13pricedays on market $279,990 Active 38 DOM
-
2026-06-09days on market $289,990 Active 34 DOM
-
2026-06-08days on market $289,990 Active 33 DOM
-
2026-06-07days on market $289,990 Active 32 DOM
-
2026-06-04days on market $289,990 Active 29 DOM
-
2026-06-03days on market $289,990 Active 28 DOM
-
2026-06-02days on market $289,990 Active 27 DOM
-
2026-06-01days on market $289,990 Active 26 DOM
-
2026-05-31days on market $289,990 Active 25 DOM
-
2026-05-09price $299,990 1519-char remark
-
2026-05-06$309,990 Active 1519-char remark
ⓘ Source: listings_history table (triggers on properties + properties_extension) + one-shot
backfill from property_details.listing_events for pre-trigger history.
Nearby sold comps map
Loading sold comps map…
Walkable amenities ~0.75 mi
Loading nearby amenities…
Taxation est. · year 1
- Rental income
- $30,838
- − Mortgage interest
- −$15,684
- − Property taxes
- −$4,200
- − Insurance
- −$1,400
- − Repairs & maintenance
- −$2,467
- − Management
- −$2,467
- − HOA
- −$780
- − Depreciation
- −$8,145
- Taxable loss
- −$4,305
- Est. tax savings @ 24.0%
- +$1,033
- After-tax cash flow
- $1,396/yr
For passive investors: Depreciation is non-cash, so a rental often shows a tax loss while cash-flowing — sheltering income. Rental losses are passive: they offset passive income freely, and up to $25,000/yr can offset ordinary (W-2) income if you actively participate and your MAGI is under $100k (phasing out to $0 by $150k); unused losses carry forward. On sale, claimed depreciation is recaptured at up to 25%, and gains may owe capital-gains tax (a 1031 exchange can defer both). Figures are a year-1 estimate at your 24.0% rate — not tax advice; consult a CPA.
Condition & rehab AI · 21 photos
This home is in excellent condition with modern finishes and a well-maintained exterior. It is move-in ready and would benefit from minor updates to enhance its curb appeal and rental value.
Value-add opportunities
- Resale Painting the interior walls — Fresh paint can enhance the home's curb appeal and make it more inviting.
- Rental Landscaping improvements — A well-maintained yard can attract more renters and increase rental value.
- Both Adding smart home features — Smart home features can increase both resale and rental value by making the home more modern and convenient for potential buyers and renters.
Renovation cost estimate screening
Value-add ROI direction
- Resale Painting the interior walls — Fresh paint can enhance the home's curb appeal and make it more inviting. ↑
- Rental Landscaping improvements — A well-maintained yard can attract more renters and increase rental value. ↑
- Both Adding smart home features — Smart home features can increase both resale and rental value by making the home more modern and convenient for potential buyers and renters. ↑
ⓘ Cost ranges are severity-bucket heuristics (US national rule-of-thumb). Get contractor quotes + a written scope before underwriting a rehab budget.
Schools (NCES district)
- District
- Royse City ISD
- NCES district ID
- 4838220
- Math proficiency
- 42% ▼ -10.00%
- Reading proficiency
- 42% ▼ -5.00%
- Median HH income
- $73,810
- Composite
- 38.44/100
- National rank
- #4197
- State rank
- #266 of 826 in TX
Livability — Royse City
- Score
- 75/100
- State rank
- #158
- US rank
- #4292
Category grades
Schools grade is shown separately in the Schools card above.
Census & demographics
- Census place
- Royse City, TX
- County
- Rockwall County · 132,930 people
- City population
- 48,739
- Metro
- Dallas-Fort Worth-Arlington, TX
- Population (ZIP)
- 48,739
- Household income
- $117,125
- Rent vs Own
- Severe rent burden
- 569.0
Population outlook (Collin County) Hauer SSP2
- Today (2025)
- 1,210,074 people
- By 2030
- 1,358,201 · +12.2%
- By 2040
- 1,654,061 · +36.7%
- By 2050
- 1,937,359 · +60.1%
- By 2075
- 2,567,039 · +112.1%
- By 2100
- 2,952,048 · +144.0%
Race, ethnicity, and origin ACS 2023
- Neighborhood character
- Diverse neighborhood (Simpson 0.57)
- Race & ethnicity
- White 60% Hispanic / Latino 25% Two or more races 12% Black 10% Asian 2%
- Hispanic origin (detail)
- Mexican 20%
- Common ancestry
- Slovak 2% Serbian 1% Lithuanian 1%
- Foreign-born
- 10% · Canada, Philippines, Jamaica
- Languages at home
- 80% English-only · Spanish 15% Other Indo-European 1%
Political lean MEDSL · Collin
- 2024 margin
- R (+11.1) · D 43.1% · R 54.3% · Other 2.6%
- 2008→2024 swing
- +14.4pp toward D · 2008: -25.6pp · 2024: -11.1pp
- All cycles
- 2024: R+11.1 2020: R+4.3 2016: R+17.0 2012: R+31.6 2008: R+25.6
Not yet ingested
- Civics
- —
Market trends
- HPI YoY
- ▼ -71.10%
- Current HPI
- 212.8422
- Rent YoY
- ▼ -1.13%
- Metro
- Dallas-Fort Worth-Arlington, TX
- State GDP YoY
- ▲ 3.95%
- F500 in state
- 110
Industry mix (Fortune 500 HQ in TX)
| Industry | F500 HQs | Revenue |
|---|---|---|
| Energy | 16 | $1,198B |
|
||
| Technology | 5 | $198B |
|
||
| Engineering / Construction | 4 | $72B |
|
||
| Energy Services | 3 | $60B |
|
||
| Utilities | 3 | $41B |
|
||
| Healthcare | 2 | $330B |
|
||
Price history
-9.7% since first listed4 events — show timeline
- 2026-06-12 Price Changed $279,990 NTREIS
- 2026-05-29 Price Changed $289,990 NTREIS
- 2026-05-09 Price Changed $299,990 NTREIS
- 2026-05-06 Listed $309,990 NTREIS
Cash-flow waterfall
monthlySold comps — $/sqft
last 12 mo · ≤1 miLoading sold comps…