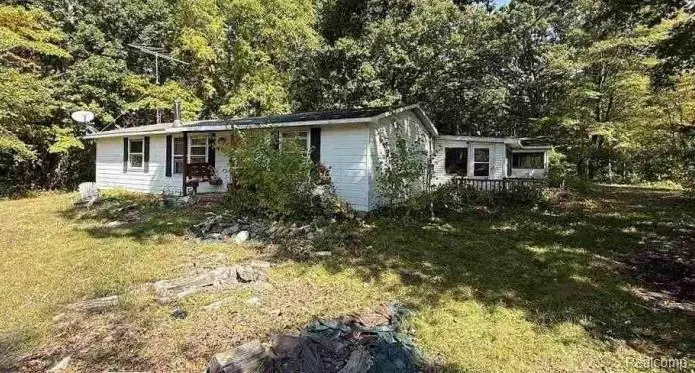
12505 Bueche Rd · Albee, MI
Flood risk 1/10 · Minimal
- FEMA flood zone
- X (unshaded)
- Chance of flooding over 30 yrs
- 0.0%
- Est. flood insurance / yr
- $473 – $860
Fire risk 3/10 · Minor
- Est. fire insurance / yr
- $784 – $1,456
Heat risk 2/10 · Minimal
- Hot days now (above 98°F)
- 6 days/yr
- Hot days in 30 yrs
- 12 days/yr
Wind risk 1/10 · Minimal
- Chance of severe wind over 30 yrs
- —
Air-quality risk 2/10 · Minimal
- Unhealthy air days now
- 1 days/yr
- Unhealthy air days in 30 yrs
- 2 days/yr
Risk factors via First Street. Map © Google.
Why this score? — see what drove the B- grade
The composite is a weighted blend of 9 inputs, each scored 0–100. Each bar is that input's sub-score; the figure is the points it added to the 100-point composite (weight × sub-score).
- Cash flow +30.0/30.0
- 1% rule +10.0/10.0
- DSCR +10.0/10.0
- ARV discount +7.5/15.0
- Schools +3.8/10.0
- Rent growth +2.5/5.0
- Livability +2.5/5.0
- Condition / age +2.5/5.0
- Appreciation +0.0/10.0
$89,000
🖨 Deal sheet 📄 Offer letter ✓ Due diligence
Listing remarks MLS
Great Opportunity to own this single-family home built in 1990 featuring 3 bedrooms and 2 bathrooms. * * * SPECIAL NOTES: (1) This is a CASH ONLY transaction. (2) Seller to pay Taxes, HOA, and Municipal/Utility Liens. (3) Please read the Auction disclaimers carefully before placing a bid or submitting an offer. * * * NO VIEWINGS. "As is" sale with no contingencies or inspections. Cash only due to lack of access to interior. Subject to right of redemption expiring 5/11/2026.
Key facts
- 3.17 acre lot
- Garage
- Built 1990
Neighborhood map
What this means for you Summary
Snapshot
- This is a 3-bed/2.5-bath single-family listed at $89k.
Deal economics
- At list price, monthly cash flow is $899 ($11k/yr) — positive.
- The deal already cash-flows at list — no discount required.
- Meets the 1% rule at list price ($2k rent vs $89k).
- Recommended offer: $78k (12.0% below list) — sets the bar for market timing.
Location & tenants
- Location reads: area grade B — affects rentability + tenant quality, not the cash-flow math above.
- Chesaning Union Schools (rural): math 41% / reading 48% proficiency, ranked #153 of 540 in MI (top 28%) — families likely to look elsewhere, expect single-tenant / working-renter base with shorter leases.
- Market conditions: 10 active listings in the ZIP; 154 units permitted in Saginaw County in 2024 (0 in 5+ unit buildings).
Forward outlook
- Local home prices are declining (-3.0%/yr); year-one equity from $615 of loan paydown is wiped out by about $3k of value loss. Plan a longer hold.
- Saginaw County population projected at -25% by 2050 — secular population decline; favor cash flow + early exit over multi-decade hold.
- At projected returns (-3.0% appreciation + 3.0% rent growth), your $25k cash investment doubles in ~3 years — after that, you're playing with house money.
Negotiation context
- It's been on market 216 days — a 12% lower offer ($78k) is reasonable based on typical stale-listing flexibility.
- 14 sale attempts since 27y ago with the ask held roughly flat each time — persistent listings suggest the price (not the market) is what's stuck; bring a comps-based counter.
Questions for the listing agent
- It's been on market 216 days. Have you received any prior offers? Is the seller open to a 12% concession, seller financing, or rate buy-down credit?
- Why hasn't it sold? Are there any deal-killer items the seller is aware of (foundation, flood, title, zoning, code violations)?
- Is there a deadline driving the sale (1031 exchange, divorce, estate, relocation)? That informs how much negotiation room exists.
- What's the average days-on-market for RENTAL listings here right now (not sales)? A rising rental-DOM trend means longer vacancies and softer asking-rent achievability than the comps imply.
- What's the recent tenant-quality profile in this submarket — average credit score on applications, eviction rate, late-payment / NSF rate, and stable-employment percentage? A property-management company in the area should have these aggregated.
- How much new for-sale + rental construction is in the pipeline within 1–3 miles? Heavy new supply typically softens prices + rents 12–24 months out; constrained supply supports both.
Investment metrics
- 1% rule
- 2.09% ✓
- Cap rate
- 18.41%
- Cash-on-cash
- 43.28%
- DSCR
- 2.93
- GRM
- 4.0
CMA / ARV
- ARV (median comp)
- $194,200
- List price
- $89,000
- Delta
- -54.17%
- Verdict
- UNDERPRICED
- Comps
- 10 within 1.0 mi
Show comp detail 4 sales within ~0.75 mi
| Address | Dist | Beds/Ba | Sqft | Sold | Price | $/sf | Match |
|---|---|---|---|---|---|---|---|
| 2889 W Birch Run Rd | 0.49mi | 3/2.0 | 1,692 (+4%) | 9mo | $203,000 | $120 | 62 |
| 3055 W Birch Run Rd | 0.50mi | 3/1.0 | 1,427 (-13%) | 2mo | $137,800 | $97 | 48 |
| 12391 Hawkins Rd | 0.49mi | 4/2.0 (+1) | 1,872 (+15%) | 18mo | $55,000 | $29 | 30 |
| 11925 Bueche Rd | 0.57mi | 3/1.5 | 1,400 (-14%) | 22mo | $130,000 | $93 | 27 |
Match score weights: distance 35% · size 25% · config 20% · recency 20%. Top-matched comps best support the ARV.
Projected returns pro-forma
-3.0% appreciation · 3.0% rent growth · sell at horizon
- IRR
- 40.1%
- Equity multiple
- 2.72×
- Total profit
- $42,819
- Equity at exit
- $13,270
- IRR
- 46.4%
- Equity multiple
- 5.45×
- Total profit
- $110,998
- Equity at exit
- $7,695
Cash invested: $24,920 (down + closing). Projections, not guarantees.
Landlord ↔ Tenant lean methodology
- Overall (STATE)
- 62 Landlord-Friendly
- State Michigan
- 62 Landlord-Friendly · EVEN
- County
- — inherits STATE
- City
- — inherits STATE
ZIP-level market 48417
- Home prices YoY
- -29.9%
- Active inventory
- 10
- Price-to-rent
- 4.0×
Monthly cashflow live
- Estimated rent
- $1,863 medium interval (Pro) →
- Mortgage (P&I)
- −$467
- Tax from tax record
- −$69 /mo · $828/yr
- Insurance
- −$37
- HOA
- −$0
- Vacancy / Maint / Mgmt
- −$391
- Net cashflow
- $899
Break-even live
UW: 25.0% down · 7.5% · 30yr · 1.5% tax · 5.0% vac · 8.0% maint · 8.0% mgmt
Financing live
Cash to close
- Down payment
- $22,250
- Closing costs
- $2,670
- Reserves months
- —
- Total cash needed
- —
Loan-product check · same deal, 3 products live
Conventional
25% down · 7.5% · 30yr
- Down + closing
- —
- Monthly P&I
- —
- Monthly cashflow
- —
- DSCR
- —
- Eligible?
- —
Personal DTI + credit; lowest rate.
DSCR
20% down · 8.5% · 30yr
- Down + closing
- —
- Monthly P&I
- —
- Monthly cashflow
- —
- DSCR
- —
- Eligible?
- —
No personal income docs; deal must DSCR.
Hard money
10% down · 12.0% · 12mo
- Down + closing
- —
- Monthly P&I
- —
- Monthly cashflow
- —
- DSCR
- —
- Eligible?
- —
Short-term bridge; refi at stabilization.
Listing history 43 events
-
2026-06-18days on market $89,000 Active 216 DOM
-
2026-06-17days on market $89,000 Active 215 DOM
-
2026-06-16days on market $89,000 Active 214 DOM
-
2026-06-15days on market $89,000 Active 213 DOM
-
2026-06-13days on market $89,000 Active 211 DOM
-
2026-06-12days on market $89,000 Active 210 DOM
-
2026-06-09days on market $89,000 Active 207 DOM
-
2026-06-08days on market $89,000 Active 206 DOM
-
2026-06-07days on market $89,000 Active 205 DOM
-
2026-06-07days on market $89,000 Active 204 DOM
-
2026-06-04days on market $89,000 Active 201 DOM
-
2026-06-02days on market $89,000 Active 200 DOM
-
2026-06-01days on market $89,000 Active 199 DOM
-
2026-05-31days on market $89,000 Active 198 DOM
-
2026-05-31days on market $89,000 Active 197 DOM
-
2025-11-14$89,000 Active 493-char remark
Show marketing remark (493 chars)
Great Opportunity to own this single-family home built in 1990 featuring 3 bedrooms and 2 bathrooms. * * * SPECIAL NOTES: (1) This is a CASH ONLY transaction. (2) Seller to pay Taxes, HOA, and Municipal/Utility Liens. (3) Please read the Auction disclaimers carefully before placing a bid or submitting an offer. * * * NO VIEWINGS. "As is" sale with no contingencies or inspections. Cash only due to lack of access to interior. Subject to right of redemption expiring 5/11/2026.
-
2004-12-17soldstatus $108,150
-
2004-12-08soldstatus $108,150
-
2004-12-08soldstatus $108,150
-
2004-11-16historical
-
2004-08-27$112,000
-
2004-08-27$112,000
-
2004-07-29historical
-
2004-07-29historical
-
2004-05-01$112,000
-
2004-05-01$112,000
-
2002-11-27historical
-
2002-11-27historical
-
2002-07-18historical
-
2002-07-18historical
-
2002-06-05$102,000
-
2002-06-05$102,000
-
2002-04-23$102,000
-
2002-04-23$102,000
-
2000-09-28historical
-
2000-09-28historical
-
2000-06-28$95,021
-
2000-06-28$95,021
-
2000-05-26historical
-
2000-05-26historical
-
1999-11-26$97,500
-
1999-11-26$97,500
ⓘ Source: listings_history table (triggers on properties + properties_extension) + one-shot
backfill from property_details.listing_events for pre-trigger history.
Tax reassessment forecast MI · Partial reset (capped growth)
- Current annual tax
- $828 · $69/mo
- Projected year-2 tax
- $1,099 · $92/mo
- Expected delta
- +$271/yr (+$23/mo · 32.8%)
ⓘ Screening estimate from a state-policy table — verify with the county assessor before closing.
Climate risk First Street
- Flood 1/10 Low FEMA zone X (unshaded) · 0% chance over 30 yrs
- Wildfire 3/10 Moderate
- Heat 2/10 Low 6 d/yr ≥98°F today · 12 d/yr by 30 yrs out
- Wind 1/10 Low
- Air quality 2/10 Low 1 unhealthy d/yr today · 2 by 30 yrs out
Nearby sold comps map
Loading sold comps map…
Walkable amenities ~0.75 mi
Loading nearby amenities…
Taxation est. · year 1
- Rental income
- $22,352
- − Mortgage interest
- −$4,985
- − Property taxes
- −$828
- − Insurance
- −$445
- − Repairs & maintenance
- −$1,788
- − Management
- −$1,788
- − Depreciation
- −$2,589
- Taxable income
- $9,928
- Est. tax owed @ 24.0%
- −$2,383
- After-tax cash flow
- $8,402/yr
For passive investors: Depreciation is non-cash, so a rental often shows a tax loss while cash-flowing — sheltering income. Rental losses are passive: they offset passive income freely, and up to $25,000/yr can offset ordinary (W-2) income if you actively participate and your MAGI is under $100k (phasing out to $0 by $150k); unused losses carry forward. On sale, claimed depreciation is recaptured at up to 25%, and gains may owe capital-gains tax (a 1031 exchange can defer both). Figures are a year-1 estimate at your 24.0% rate — not tax advice; consult a CPA.
Schools (NCES district)
- District
- Chesaning Union Schools
- NCES district ID
- 2609150
- Math proficiency
- 41% ▼ -11.00%
- Reading proficiency
- 48% ▼ -14.00%
- Median HH income
- $45,955
- Composite
- 37.82/100
- National rank
- #4333
- State rank
- #153 of 540 in MI
Livability — Albee
No livability data for this city. (Only ~50 U.S. cities are tracked.)
Census & demographics
- Population (ZIP)
- 2,310
Population outlook (Saginaw County) Hauer SSP2
- Today (2025)
- 180,568 people
- By 2030
- 172,302 · -4.6%
- By 2040
- 153,919 · -14.8%
- By 2050
- 135,519 · -24.9%
- By 2075
- 97,199 · -46.2%
- By 2100
- 65,037 · -64.0%
Race, ethnicity, and origin ACS 2023
- Neighborhood character
- Predominantly White (86%)
- Race & ethnicity
- White 86% Two or more races 10% Hispanic / Latino 7% Asian 1%
- Hispanic origin (detail)
- Mexican 5%
- Common ancestry
- Lithuanian 11% Romanian 9% Slovak 2%
- Foreign-born
- 1%
- Languages at home
- 98% English-only · Spanish 2%
Political lean MEDSL · Saginaw
- 2024 margin
- Toss-up / Even · D 47.7% · R 51.0% · Other 1.4%
- 2008→2024 swing
- -20.6pp toward R · 2008: 17.3pp · 2024: -3.3pp
- All cycles
- 2024: R+3.3 2020: D+0.3 2016: R+1.1 2012: D+11.9 2008: D+17.3
Not yet ingested
- Civics
- —
Market trends
- HPI YoY
- ▼ -86.25%
- Current HPI
- 202.2839
- Rent YoY
- —
- Metro
- —
- State GDP YoY
- ▲ 1.37%
- F500 in state
- 28
Industry mix (Fortune 500 HQ in MI)
| Industry | F500 HQs | Revenue |
|---|---|---|
| Automotive Parts | 3 | $48B |
|
||
| Automotive | 2 | $372B |
|
||
| Chemicals | 1 | $45B |
|
||
| Automotive Retail | 1 | $29B |
|
||
| Healthcare / Medical Devices | 1 | $23B |
|
||
| Automotive Technology | 1 | $20B |
|
||
Price history
-8.7% since first listed28 events — show timeline
- 2025-11-14 Listed $89,000 MiRealSource-MiMLS
- 2025-11-14 Listed $89,000 REALCOMP
- 2004-12-17 Sold (Public Records) $108,150 Public Records
- 2004-12-08 Sold (MLS) $108,150 MiRealSource-MiMLS
- 2004-12-08 Sold (MLS) $108,150 REALCOMP
- 2004-11-16 Listing Removed — MiRealSource-MiMLS
- 2004-08-27 Listed $112,000 MiRealSource-MiMLS
- 2004-08-27 Listed $112,000 REALCOMP
- 2004-07-29 Listing Removed — REALCOMP
- 2004-07-29 Listing Removed — MiRealSource-MiMLS
- 2004-05-01 Listed $112,000 REALCOMP
- 2004-05-01 Listed $112,000 MiRealSource-MiMLS
- 2002-11-27 Listing Removed — MiRealSource-MiMLS
- 2002-11-27 Listing Removed — REALCOMP
- 2002-07-18 Listing Removed — REALCOMP
- 2002-07-18 Listing Removed — MiRealSource-MiMLS
- 2002-06-05 Listed $102,000 REALCOMP
- 2002-06-05 Listed $102,000 MiRealSource-MiMLS
- 2002-04-23 Listed $102,000 MiRealSource-MiMLS
- 2002-04-23 Listed $102,000 REALCOMP
- 2000-09-28 Listing Removed — MiRealSource-MiMLS
- 2000-09-28 Listing Removed — REALCOMP
- 2000-06-28 Listed $95,021 MiRealSource-MiMLS
- 2000-06-28 Listed $95,021 REALCOMP
- 2000-05-26 Listing Removed — REALCOMP
- 2000-05-26 Listing Removed — MiRealSource-MiMLS
- 1999-11-26 Listed $97,500 REALCOMP
- 1999-11-26 Listed $97,500 MiRealSource-MiMLS
Property tax history
-4.6%/yrLatest (2025): $828 · -67.4% YoY. Source: county tax records.
Cash-flow waterfall
monthlySold comps — $/sqft
last 12 mo · ≤1 miLoading sold comps…