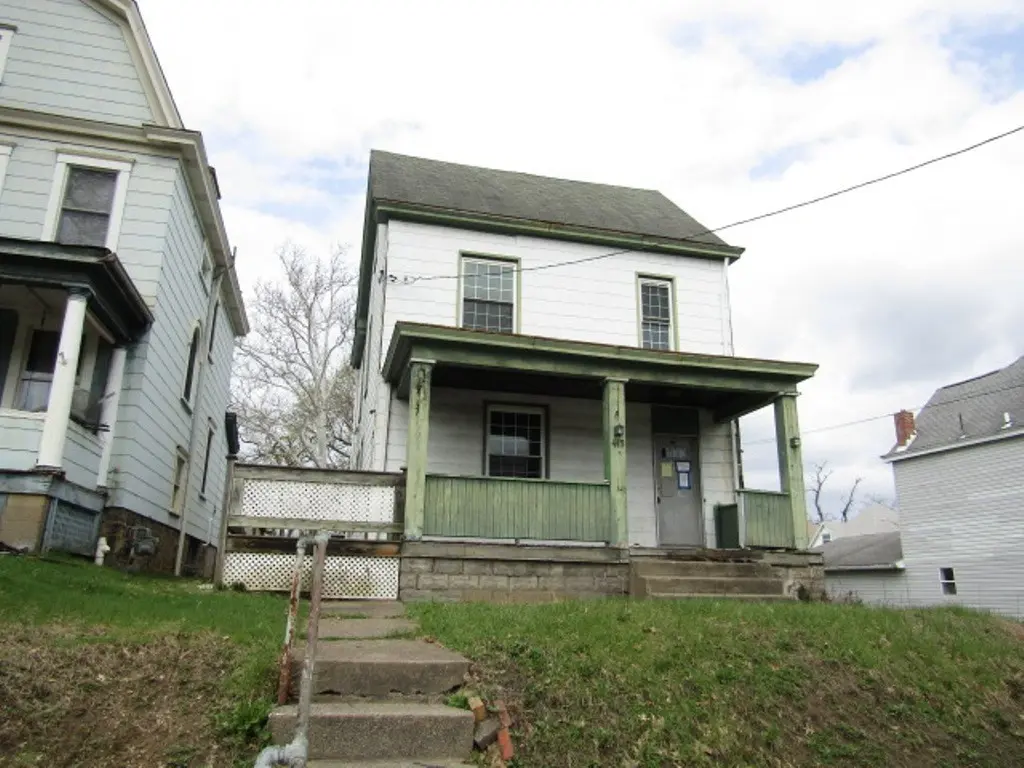
415 N School St · Avalon, PA
Flood risk 1/10 · Minimal
- FEMA flood zone
- X (unshaded)
- Chance of flooding over 30 yrs
- 0.0%
- Est. flood insurance / yr
- $473 – $860
Fire risk 1/10 · Minimal
- Est. fire insurance / yr
- $511 – $949
Heat risk 4/10 · Minor
- Hot days now (above 99°F)
- 7 days/yr
- Hot days in 30 yrs
- 18 days/yr
Wind risk 2/10 · Minimal
- Chance of severe wind over 30 yrs
- —
Air-quality risk 3/10 · Minor
- Unhealthy air days now
- 3 days/yr
- Unhealthy air days in 30 yrs
- 3 days/yr
Risk factors via First Street. Map © Google.
Why this score? — see what drove the B+ grade
The composite is a weighted blend of 9 inputs, each scored 0–100. Each bar is that input's sub-score; the figure is the points it added to the 100-point composite (weight × sub-score).
- Cash flow +30.0/30.0
- ARV discount +15.0/15.0
- 1% rule +10.0/10.0
- DSCR +10.0/10.0
- Livability +4.3/5.0
- Rent growth +3.8/5.0
- Schools +3.4/10.0
- Condition / age +2.5/5.0
- Appreciation +0.0/10.0
$135,000
🖨 Deal sheet 📄 Offer letter ✓ Due diligence
Listing remarks MLS
Great opportunity in Avalon! Large covered front porch! Carport for two cars in the rear! Large kitchen with plenty of updated cabinetry! Three generous sized bedrooms with large closest! Unfinished basement with additional storage! Centrally located!
Key facts
- Covered front porch
- Carport for two cars
- Unfinished basement
Tags
Neighborhood map
What this means for you Summary
Snapshot
- This is a 3-bed/1.0-bath single-family listed at $135k.
Deal economics
- At list price, monthly cash flow is $596 ($7k/yr) — positive.
- The deal already cash-flows at list — no discount required.
- Meets the 1% rule at list price ($2k rent vs $135k).
- Recommended offer: $127k (6.0% below list) — sets the bar for market timing.
- Cap rate 11.6% vs local median 5.2% in Avalon — top-decile yield for the area; either an underpriced asset or a hidden risk that comps aren't pricing in. Stress-test before assuming the spread holds.
Location & tenants
- Location reads 86/100 on livability (#63 in PA, #439 nationally) — a professional / high-income tenant draw. Strengths: crime A+, commute A+, cost of living A+; Watch: amenities C-.
- Northgate SD (suburban): math 25% / reading 57% proficiency, ranked #354 of 539 in PA (top 66%) — families likely to look elsewhere, expect single-tenant / working-renter base with shorter leases.
- Market conditions: Rents rising fast (+5.2%/yr); 80 active listings in the ZIP; 5 comparable units currently listed for rent nearby; rentals lingering (median 44d on market — plan ~5-8 weeks vacancy on turnover, expect pricing pressure); 60% of comp listings sitting > 30 days — soft ceiling on asking rent; 2,996 units permitted in Allegheny County in 2024 (1,588 in 5+ unit buildings).
- This rent runs 36% of the median local income ($68k/yr) — at the standard rent-burdened threshold; future hikes will face affordability resistance.
Forward outlook
- Local home prices are declining (-3.0%/yr); year-one equity from $933 of loan paydown is wiped out by about $4k of value loss. Plan a longer hold.
- At projected returns (-3.0% appreciation + 5.2% rent growth), your $38k cash investment doubles in ~6 years — after that, you're playing with house money.
Negotiation context
- It's been on market 63 days — a 6% lower offer ($127k) is reasonable based on typical stale-listing flexibility.
- 4 sale attempts with the ask held roughly flat each time — persistent listings suggest the price (not the market) is what's stuck; bring a comps-based counter.
Risks & watch-outs
- Watch-outs: built in 1920 — expect roof / HVAC / electrical / plumbing capex.
Questions for the listing agent
- It's been on market 63 days. Have you received any prior offers? Is the seller open to a 6% concession, seller financing, or rate buy-down credit?
- Built in 1920 — when were the roof, HVAC, electrical panel, plumbing, and water heater last replaced?
- Why hasn't it sold? Are there any deal-killer items the seller is aware of (foundation, flood, title, zoning, code violations)?
- Is there a deadline driving the sale (1031 exchange, divorce, estate, relocation)? That informs how much negotiation room exists.
- What's the average days-on-market for RENTAL listings here right now (not sales)? A rising rental-DOM trend means longer vacancies and softer asking-rent achievability than the comps imply.
- What's the recent tenant-quality profile in this submarket — average credit score on applications, eviction rate, late-payment / NSF rate, and stable-employment percentage? A property-management company in the area should have these aggregated.
- How much new for-sale + rental construction is in the pipeline within 1–3 miles? Heavy new supply typically softens prices + rents 12–24 months out; constrained supply supports both.
Investment metrics
- 1% rule
- 1.53% ✓
- Cap rate
- 11.59%
- Cash-on-cash
- 18.93%
- DSCR
- 1.84
- GRM
- 5.4
CMA / ARV
- ARV (median comp)
- $263,772
- List price
- $135,000
- Delta
- -48.82%
- Verdict
- UNDERPRICED
- Comps
- 20 within 1.0 mi
Show comp detail 12 sales within ~0.75 mi
| Address | Dist | Beds/Ba | Sqft | Sold | Price | $/sf | Match |
|---|---|---|---|---|---|---|---|
| 647 Park Ave | 0.04mi | 4/2.5 (+1) | 1,996 (+2%) | 5mo | $350,000 | $175 | 81 |
| 327 Elizabeth Ave | 0.25mi | 3/1.0 | 1,904 (-3%) | 4mo | $16,000 | $8 | 79 |
| 601 Center Ave | 0.15mi | 4/3.5 (+1) | 1,981 (+1%) | 3mo | $365,000 | $184 | 74 |
| 208 Delp St | 0.36mi | 3/2.0 | 1,986 (+1%) | 5mo | $100,001 | $50 | 73 |
| 712 California Ave | 0.07mi | 4/2.5 (+1) | 2,176 (+11%) | 0mo | $325,000 | $149 | 68 |
| 308 Harrison Ave | 0.24mi | 3/1.0 | 1,732 (-12%) | 6mo | $120,000 | $69 | 64 |
| 705 Taylor Ave | 0.09mi | 4/2.0 (+1) | 2,244 (+14%) | 1mo | $125,000 | $56 | 62 |
| 1023 Hamilton Ave | 0.45mi | 3/1.5 | 1,825 (-7%) | 4mo | $221,000 | $121 | 61 |
| 119 Harrison Ave | 0.33mi | 4/2.0 (+1) | 2,156 (+10%) | 4mo | $290,000 | $135 | 56 |
| 233 S Starr Ave | 0.49mi | 4/1.5 (+1) | 1,826 (-7%) | 3mo | $260,000 | $142 | 56 |
| 632 Means Ave | 0.47mi | 4/2.0 (+1) | 2,092 (+6%) | 4mo | $365,000 | $174 | 55 |
| 224 S Home Ave | 0.46mi | 4/1.5 (+1) | 2,184 (+11%) | 0mo | $332,280 | $152 | 53 |
Match score weights: distance 35% · size 25% · config 20% · recency 20%. Top-matched comps best support the ARV.
Projected returns pro-forma
-3.0% appreciation · 5.16% rent growth · sell at horizon
- IRR
- 13.4%
- Equity multiple
- 1.55×
- Total profit
- $20,781
- Equity at exit
- $20,129
- IRR
- 24.0%
- Equity multiple
- 3.30×
- Total profit
- $87,056
- Equity at exit
- $11,672
Cash invested: $37,800 (down + closing). Projections, not guarantees.
Landlord ↔ Tenant lean methodology
- Overall (STATE)
- 62 Landlord-Friendly
- State Pennsylvania
- 62 Landlord-Friendly · EVEN
- County
- — inherits STATE
- City
- — inherits STATE
ZIP-level market 15202
- Home prices YoY
- -30.2%
- Rents YoY
- 5.2%
- Active inventory
- 80
- Price-to-rent
- 5.4×
Monthly cashflow live
- Estimated rent
- $2,066 high interval (Pro) →
- Mortgage (P&I)
- −$708
- Tax from tax record
- −$272 /mo · $3,265/yr
- Insurance
- −$56
- HOA
- −$0
- Vacancy / Maint / Mgmt
- −$434
- Net cashflow
- $596
Break-even live
UW: 25.0% down · 7.5% · 30yr · 1.5% tax · 5.0% vac · 8.0% maint · 8.0% mgmt
Financing live
Cash to close
- Down payment
- $33,750
- Closing costs
- $4,050
- Reserves months
- —
- Total cash needed
- —
Loan-product check · same deal, 3 products live
Conventional
25% down · 7.5% · 30yr
- Down + closing
- —
- Monthly P&I
- —
- Monthly cashflow
- —
- DSCR
- —
- Eligible?
- —
Personal DTI + credit; lowest rate.
DSCR
20% down · 8.5% · 30yr
- Down + closing
- —
- Monthly P&I
- —
- Monthly cashflow
- —
- DSCR
- —
- Eligible?
- —
No personal income docs; deal must DSCR.
Hard money
10% down · 12.0% · 12mo
- Down + closing
- —
- Monthly P&I
- —
- Monthly cashflow
- —
- DSCR
- —
- Eligible?
- —
Short-term bridge; refi at stabilization.
Rent comps 5 comps
| Address | Beds | Baths | Sqft | Rent | $/sqft | DOM | Units | Dist |
|---|---|---|---|---|---|---|---|---|
| 421 N Ohio St Pittsburgh, PA | 3.0 | 2.0 | 1747 | $2,700 | $1.55 | 1d | 1 | 0.26mi |
| 713 Clinton Pl Pittsburgh, PA | 4.0 | 2.0 | 1760 | $2,750 | $1.56 | 1d | 1 | 0.40mi |
| 555 Orchard Ave Bellevue, PA | 3.0 | 1.0 | 1400 | $1,295 | $0.93 | 43d | 1 | 0.64mi |
| 115 Meade Ave Pittsburgh, PA | 4.0 | 1.0 | 1392 | $1,600 | $1.15 | 43d | 1 | 0.72mi |
| 189 N Balph Ave Pittsburgh, PA | 3.0 | 1.0 | 1550 | $1,850 | $1.19 | 43d | 1 | 0.78mi |
Listing history 19 events
-
2026-06-18days on market $135,000 Active 63 DOM
-
2026-06-17days on market $135,000 Active 62 DOM
-
2026-06-16days on market $135,000 Active 61 DOM
-
2026-06-15days on market $135,000 Active 60 DOM
-
2026-06-13days on market $135,000 Active 58 DOM
-
2026-06-13days on market $135,000 Active 57 DOM
-
2026-06-09days on market $135,000 Active 54 DOM
-
2026-06-08days on market $135,000 Active 53 DOM
-
2026-06-07days on market $135,000 Active 52 DOM
-
2026-06-03days on market $135,000 Active 48 DOM
-
2026-06-02days on market $135,000 Active 47 DOM
-
2026-06-01days on market $135,000 Active 46 DOM
-
2026-05-31days on market $135,000 Active 45 DOM
-
2026-04-16$140,000 Active 251-char remark
Show marketing remark (251 chars)
Great opportunity in Avalon! Large covered front porch! Carport for two cars in the rear! Large kitchen with plenty of updated cabinetry! Three generous sized bedrooms with large closest! Unfinished basement with additional storage! Centrally located!
-
2026-02-26status Active
-
2026-02-20historical Contingent
-
2025-11-26status Active
-
2025-11-23historical
-
2025-09-29$165,000 Active
ⓘ Source: listings_history table (triggers on properties + properties_extension) + one-shot
backfill from property_details.listing_events for pre-trigger history.
Tax reassessment forecast PA · Partial reset (capped growth)
- Current annual tax
- $3,265 · $272/mo
- Projected year-2 tax
- $3,265 · $272/mo
- Expected delta
- $0/yr ($0/mo · 0.0%)
ⓘ Screening estimate from a state-policy table — verify with the county assessor before closing.
Climate risk First Street
- Flood 1/10 Low FEMA zone X (unshaded) · 0% chance over 30 yrs
- Wildfire 1/10 Low
- Heat 4/10 Moderate 7 d/yr ≥99°F today · 18 d/yr by 30 yrs out
- Wind 2/10 Low
- Air quality 3/10 Moderate 3 unhealthy d/yr today · 3 by 30 yrs out
Nearby sold comps map
Loading sold comps map…
Walkable amenities ~0.75 mi
Loading nearby amenities…
Taxation est. · year 1
- Rental income
- $24,798
- − Mortgage interest
- −$7,562
- − Property taxes
- −$3,265
- − Insurance
- −$675
- − Repairs & maintenance
- −$1,984
- − Management
- −$1,984
- − Depreciation
- −$3,927
- Taxable income
- $5,401
- Est. tax owed @ 24.0%
- −$1,296
- After-tax cash flow
- $5,859/yr
For passive investors: Depreciation is non-cash, so a rental often shows a tax loss while cash-flowing — sheltering income. Rental losses are passive: they offset passive income freely, and up to $25,000/yr can offset ordinary (W-2) income if you actively participate and your MAGI is under $100k (phasing out to $0 by $150k); unused losses carry forward. On sale, claimed depreciation is recaptured at up to 25%, and gains may owe capital-gains tax (a 1031 exchange can defer both). Figures are a year-1 estimate at your 24.0% rate — not tax advice; consult a CPA.
Schools (NCES district)
- District
- Northgate SD
- NCES district ID
- 4217770
- Math proficiency
- 25% ▼ -12.00%
- Reading proficiency
- 57% ▼ -5.00%
- Median HH income
- $39,084
- Composite
- 34.15/100
- National rank
- #5279
- State rank
- #354 of 539 in PA
Livability — Avalon
- Score
- 86/100
- State rank
- #63
- US rank
- #439
Category grades
Schools grade is shown separately in the Schools card above.
Census & demographics
- Census place
- Avalon, PA
- County
- Allegheny County · 1,022,028 people
- City population
- 19,642
- Metro
- Pittsburgh, PA
- Population (ZIP)
- 19,564
- Household income
- $68,287
- Rent vs Own
- Severe rent burden
- 952.0
Population outlook (Allegheny County) Hauer SSP2
- Today (2025)
- 1,250,282 people
- By 2030
- 1,256,482 · +0.5%
- By 2040
- 1,256,318 · +0.5%
- By 2050
- 1,244,169 · -0.5%
- By 2075
- 1,197,693 · -4.2%
- By 2100
- 1,093,187 · -12.6%
Race, ethnicity, and origin ACS 2023
- Neighborhood character
- Predominantly White (83%)
- Race & ethnicity
- White 83% Black 9% Two or more races 5% Hispanic / Latino 2% Asian 1%
- Common ancestry
- Romanian 6% Italian 2% Lithuanian 2%
- Foreign-born
- 2% · Canada, China
- Languages at home
- 96% English-only · Other Indo-European 1% Spanish 1% Chinese 1%
Political lean MEDSL · Allegheny
- 2024 margin
- Strong D (+20.3) · D 59.7% · R 39.4%
- 2008→2024 swing
- +4.8pp toward D · 2008: 15.5pp · 2024: 20.3pp
- All cycles
- 2024: D+20.3 2020: D+20.4 2016: D+16.4 2012: D+14.4 2008: D+15.5
Not yet ingested
- Civics
- —
Market trends
- HPI YoY
- ▼ -118.40%
- Current HPI
- 274.1929
- Rent YoY
- ▲ 5.16%
- Metro
- Pittsburgh, PA
- State GDP YoY
- ▲ 1.68%
- F500 in state
- 34
Industry mix (Fortune 500 HQ in PA)
| Industry | F500 HQs | Revenue |
|---|---|---|
| Healthcare | 2 | $309B |
|
||
| Insurance | 2 | $27B |
|
||
| Telecommunications / Media | 1 | $124B |
|
||
| Industrial Distribution | 1 | $22B |
|
||
| Financial Services | 1 | $20B |
|
||
| Chemicals / Materials | 1 | $18B |
|
||
Price history
-15.2% since first listed6 events — show timeline
- 2026-04-16 Listed $140,000 West Penn MLS
- 2026-02-26 Relisted — West Penn MLS
- 2026-02-20 Contingent — West Penn MLS
- 2025-11-26 Relisted — West Penn MLS
- 2025-11-23 Delisted — West Penn MLS
- 2025-09-29 Listed $165,000 West Penn MLS
Property tax history
+3.4%/yrLatest (2026): $3,265 · +37.5% YoY. Source: county tax records.
Cash-flow waterfall
monthlySold comps — $/sqft
last 12 mo · ≤1 miLoading sold comps…