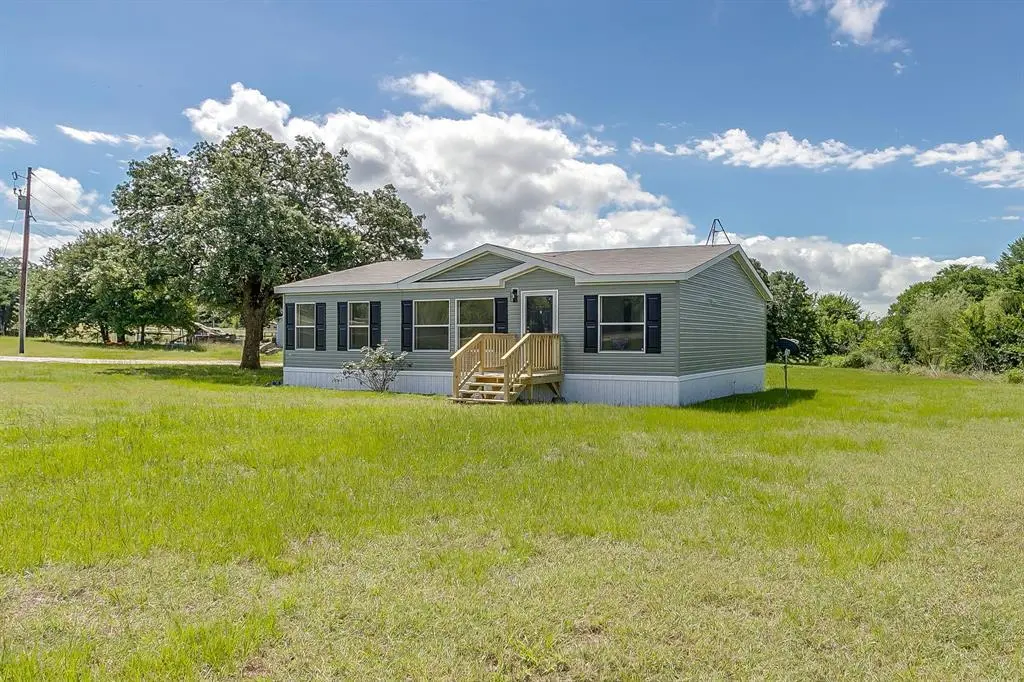
1001 Lanes · Burleson, TX
Flood risk 1/10 · Minimal
- FEMA flood zone
- X (unshaded)
- Chance of flooding over 30 yrs
- 0.0%
- Est. flood insurance / yr
- $507 – $1,088
Fire risk 5/10 · Moderate
- Est. fire insurance / yr
- $1,222 – $2,270
Heat risk 7/10 · Major
- Hot days now (above 109°F)
- 7 days/yr
- Hot days in 30 yrs
- 24 days/yr
Wind risk 6/10 · Moderate
- Chance of severe wind over 30 yrs
- 27.0%
Air-quality risk 2/10 · Minimal
- Unhealthy air days now
- 1 days/yr
- Unhealthy air days in 30 yrs
- 2 days/yr
Risk factors via First Street. Map © Google.
Why this score? — see what drove the C+ grade
The composite is a weighted blend of 9 inputs, each scored 0–100. Each bar is that input's sub-score; the figure is the points it added to the 100-point composite (weight × sub-score).
- Cash flow +27.0/30.0
- DSCR +9.3/10.0
- 1% rule +6.6/10.0
- ARV discount +5.7/15.0
- Schools +4.5/10.0
- Livability +4.0/5.0
- Rent growth +2.5/5.0
- Condition / age +2.5/5.0
- Appreciation +0.0/10.0
$229,000
🖨 Deal sheet (PDF) 📄 Offer letter ✓ Due diligence
Listing remarks
Completely remodeled and move-in ready, this beautiful 3-bedroom, 2-bath home sits on over 1 acre on a desirable corner lot in the highly sought-after Joshua ISD. Offering the perfect blend of modern updates and country charm, this property provides plenty of room to spread out while remaining convenient to shopping, dining, and nearby amenities. Inside, you'll find a spacious 18 x 18 living area that opens to a beautifully updated kitchen featuring new stainless steel appliances, granite countertops, updated fixtures, and a tile backsplash. Fresh interior paint, new luxury vinyl plank flooring, new carpet, and ceiling fans throughout give the home a clean, modern feel. The private primary
Key facts
- Walk-in closet
- Updated kitchen
- Granite countertops
Tags
Property features AI
Finance
- Other: Mineral rights excluded
- Financial info: Listing accepts Cash, Conventional, and VA financing; No second mortgage indicated
- HOA & community: No association
Exterior
- Parking: Driveway parking
- Utilities: Aerobic septic / Septic; Co-op water; Electricity connected; Cable available; All-weather road access
- Home design: Single-family residence; One-story home; Attached property (per listing data)
- Construction: Built in 2003; Siding exterior; Composition roof; Pillar/post/pier foundation
- Exterior features: Deck; Exterior storage; Corner lot; Acreage lot (about 1.17 acres)
Interior
- Kitchen: Granite countertops; Dishwasher; Electric range
- Bedrooms: 3 bedrooms (all on the main level); Primary bedroom on main level with garden tub and walk-in closet
- Flooring: Carpet; Luxury vinyl plank
- Bathrooms: 2 full bathrooms
- Heating & cooling: Central heating (electric); Central air conditioning (electric); Ceiling fans
- Interior features: Chandelier and decorative lighting; High-speed internet available; One living area and one dining area; 7 rooms total; No fireplaces
- Laundry & utility: Full-size washer/dryer area; Washer hook-up and electric dryer hook-up; Separate utility/utility room with drip/dry area
Neighborhood map
What this means for you Summary
Snapshot
- This is a 3-bed/2.0-bath manufactured listed at $229k.
Deal economics
- At list price, monthly cash flow is $638 ($8k/yr) — positive.
- The deal already cash-flows at list — no discount required.
- Meets the 1% rule at list price ($3k rent vs $229k).
- Cap rate 9.6% vs local median 3.5% in Burleson — top-decile yield for the area; either an underpriced asset or a hidden risk that comps aren't pricing in. Stress-test before assuming the spread holds.
Location & tenants
- Location reads 79/100 on livability (#53 in TX, #2,133 nationally) — a middle-class / working-renter tenant base. Strengths: employment A+, cost of living A+, housing A+; Watch: amenities F, commute F.
- Joshua ISD (rural): math 52% / reading 50% proficiency, ranked #139 of 826 in TX (top 17%) — acceptable for families but not a draw, mixed tenant base, ~2y average lease.
- Zoned schools: Caddo Grove El (math 36% / reading 28%, grade F, #2,268 of 4,322 statewide, top 55%, 595 students, 71% FRL); R C Loflin Middle (math 41% / reading 45%, grade D-, #540 of 1,662 statewide, top 33%, 730 students, 55% FRL); Joshua H S (math 67% / reading 15%, grade F, #774 of 1,632 statewide, top 49%, 1,242 students, 44% FRL).
- Zoned-school proficiency averages 39% at this address vs 51% district-wide (-12 pts) — the specific schools serving this property underperform the Joshua ISD average; the district grade overstates school quality for this exact location.
- Market conditions: 421 active listings in the ZIP; 1 comparable units currently listed for rent nearby; 2,152 units permitted in Johnson County in 2024 (76 in 5+ unit buildings).
Forward outlook
- Local home prices are declining (-3.0%/yr); year-one equity from $2k of loan paydown is wiped out by about $7k of value loss. Plan a longer hold.
- Johnson County population projected at +24% by 2050 — long-run rental-demand tailwind backs the buy-and-hold thesis.
- At projected returns (-3.0% appreciation + 3.0% rent growth), your $64k cash investment doubles in ~10 years — after that, you're playing with house money.
Negotiation context
- Only 10 days on market — expect competitive offers; lowballing is unlikely to land.
Risks & watch-outs
- Climate carrying-cost: major wind risk, 27% chance of damaging wind over 30y; moderate wildfire risk; extreme-heat days projected 7→24/yr by 2055 (HVAC capex compounding) — expect insurance premiums to compound above CPI over the hold.
Questions for the listing agent
- Is there a deadline driving the sale (1031 exchange, divorce, estate, relocation)? That informs how much negotiation room exists.
- What's the average days-on-market for RENTAL listings here right now (not sales)? A rising rental-DOM trend means longer vacancies and softer asking-rent achievability than the comps imply.
- What's the recent tenant-quality profile in this submarket — average credit score on applications, eviction rate, late-payment / NSF rate, and stable-employment percentage? A property-management company in the area should have these aggregated.
- How much new for-sale + rental construction is in the pipeline within 1–3 miles? Heavy new supply typically softens prices + rents 12–24 months out; constrained supply supports both.
Investment metrics
- 1% rule
- 1.16% ✓
- Cap rate
- 9.64%
- Cash-on-cash
- 11.94%
- DSCR
- 1.53
- GRM
- 7.2
CMA / ARV
- ARV (on-the-fly)
- $220,160
- Comps found
- 1
Show comp detail 1 sale within ~0.75 mi
| Address | Dist | Beds/Ba | Sqft | Sold | Price | $/sf | Match |
|---|---|---|---|---|---|---|---|
| 909 Lanes End | 0.08mi | 3/2.0 | 1,456 (+14%) | 18mo | $249,900 | $172 | 58 |
Match score weights: distance 35% · size 25% · config 20% · recency 20%. Top-matched comps best support the ARV.
Projected returns pro-forma
-3.0% appreciation · 3.0% rent growth · sell at horizon
- IRR
- 1.4%
- Equity multiple
- 1.05×
- Total profit
- $3,489
- Equity at exit
- $34,145
- IRR
- 11.0%
- Equity multiple
- 1.86×
- Total profit
- $55,208
- Equity at exit
- $19,800
Cash invested: $64,120 (down + closing). Projections, not guarantees.
Landlord ↔ Tenant lean methodology
- Overall (STATE)
- 87 Strongly Landlord-Friendly
- State Texas
- 87 Strongly Landlord-Friendly · R+5
- County
- — inherits STATE
- City
- — inherits STATE
ZIP-level market 76058
- Home prices YoY
- -24.5%
- Active inventory
- 421
- Price-to-rent
- 7.2×
Monthly cashflow live
- Estimated rent
- $2,650 medium interval (Pro) →
- Mortgage (P&I)
- −$1,201
- Tax from tax record
- −$159 /mo · $1,910/yr
- Insurance
- −$95
- HOA
- −$0
- Vacancy / Maint / Mgmt
- −$556
- Net cashflow
- $638
Break-even live
Sensitivity live
| Price | -10% $768 | -5% $703 | +0% $638 | +5% $573 | +10% $508 |
|---|---|---|---|---|---|
| Rent | -10% $429 | -5% $533 | +0% $638 | +5% $743 | +10% $847 |
| Rate | -1.0pp $753 | -0.5pp $696 | base $638 | +0.5pp $579 | +1.0pp $518 |
UW: 25.0% down · 7.5% · 30yr · 1.5% tax · 5.0% vac · 8.0% maint · 8.0% mgmt
Financing live
Cash to close
- Down payment
- $57,250
- Closing costs
- $6,870
- Reserves months
- —
- Total cash needed
- —
Loan-product check · same deal, 3 products live
Conventional
25% down · 7.5% · 30yr
- Down + closing
- —
- Monthly P&I
- —
- Monthly cashflow
- —
- DSCR
- —
- Eligible?
- —
Personal DTI + credit; lowest rate.
DSCR
20% down · 8.5% · 30yr
- Down + closing
- —
- Monthly P&I
- —
- Monthly cashflow
- —
- DSCR
- —
- Eligible?
- —
No personal income docs; deal must DSCR.
Hard money
10% down · 12.0% · 12mo
- Down + closing
- —
- Monthly P&I
- —
- Monthly cashflow
- —
- DSCR
- —
- Eligible?
- —
Short-term bridge; refi at stabilization.
Rent comps 1 comps
| Address | Beds | Baths | Sqft | Rent | $/sqft | DOM | Units | Dist |
|---|---|---|---|---|---|---|---|---|
| 1612 Caddo Peak Trl Joshua, TX | 3.0 | 3.0 | 1504 | $2,650 | $1.76 | 12d | 1 | 0.97mi |
Listing history 7 events
-
2026-06-21statusdays on market $229,000 Pending 10 DOM
-
2026-06-18days on market $229,000 Active 8 DOM
-
2026-06-17days on market $229,000 Active 7 DOM
-
2026-06-16days on market $229,000 Active 6 DOM
-
2026-06-15days on market $229,000 Active 5 DOM
-
2026-06-13remarks 699-char remark
-
2026-06-13$229,000 Active 3 DOM
ⓘ Source: listings_history table (triggers on properties + properties_extension) + one-shot
backfill from property_details.listing_events for pre-trigger history.
Tax reassessment forecast TX · Resets to sale price
- Current annual tax
- $1,910 · $159/mo
- Projected year-2 tax
- $4,191 · $349/mo
- Expected delta
- +$2,281/yr (+$190/mo · 119.4%)
ⓘ Screening estimate from a state-policy table — verify with the county assessor before closing.
Climate risk First Street
- Flood 1/10 Low FEMA zone X (unshaded) · 0% chance over 30 yrs
- Wildfire 5/10 Major
- Heat 7/10 Severe 7 d/yr ≥109°F today · 24 d/yr by 30 yrs out
- Wind 6/10 Major 27% chance of damaging wind over 30 yrs
- Air quality 2/10 Low 1 unhealthy d/yr today · 2 by 30 yrs out
Nearby sold comps map
Loading sold comps map…
Walkable amenities ~0.75 mi
Loading nearby amenities…
Taxation est. · year 1
- Rental income
- $31,800
- − Mortgage interest
- −$12,828
- − Property taxes
- −$1,910
- − Insurance
- −$1,145
- − Repairs & maintenance
- −$2,544
- − Management
- −$2,544
- − Depreciation
- −$6,662
- Taxable income
- $4,168
- Est. tax owed @ 24.0%
- −$1,000
- After-tax cash flow
- $6,656/yr
For passive investors: Depreciation is non-cash, so a rental often shows a tax loss while cash-flowing — sheltering income. Rental losses are passive: they offset passive income freely, and up to $25,000/yr can offset ordinary (W-2) income if you actively participate and your MAGI is under $100k (phasing out to $0 by $150k); unused losses carry forward. On sale, claimed depreciation is recaptured at up to 25%, and gains may owe capital-gains tax (a 1031 exchange can defer both). Figures are a year-1 estimate at your 24.0% rate — not tax advice; consult a CPA.
Schools (NCES district)
- District
- Joshua ISD
- NCES district ID
- 4824930
- Math proficiency
- 52% ▼ -7.00%
- Reading proficiency
- 50% ▼ -1.00%
- Median HH income
- $60,696
- Composite
- 44.65/100
- National rank
- #2769
- State rank
- #139 of 826 in TX
Livability — Burleson
- Score
- 79/100
- State rank
- #53
- US rank
- #2133
Category grades
Schools grade is shown separately in the Schools card above.
Census & demographics
- City population
- 81,549
- Population (ZIP)
- 21,531
Population outlook (Johnson County) Hauer SSP2
- Today (2025)
- 179,678 people
- By 2030
- 189,208 · +5.3%
- By 2040
- 207,261 · +15.4%
- By 2050
- 223,064 · +24.1%
- By 2075
- 259,979 · +44.7%
- By 2100
- 275,395 · +53.3%
Race, ethnicity, and origin ACS 2023
- Neighborhood character
- Predominantly White (67%)
- Race & ethnicity
- White 67% Hispanic / Latino 28% Two or more races 11% Black 2%
- Hispanic origin (detail)
- Mexican 26%
- Common ancestry
- Italian 2% Slovak 2% Portuguese 1%
- Foreign-born
- 7% · Canada
- Languages at home
- 80% English-only · Spanish 18% German/W. Germanic 1%
Political lean MEDSL · Johnson
- 2024 margin
- Solid R (+51.4) · D 23.9% · R 75.3%
- 2008→2024 swing
- -3.9pp toward R · 2008: -47.5pp · 2024: -51.4pp
- All cycles
- 2024: R+51.4 2020: R+53.0 2016: R+58.3 2012: R+55.6 2008: R+47.5
Not yet ingested
- Civics
- —
Market trends
- HPI YoY
- ▼ -86.22%
- Current HPI
- 265.6513
- Rent YoY
- —
- Metro
- —
- State GDP YoY
- ▲ 3.95%
- F500 in state
- 110
Industry mix (Fortune 500 HQ in TX)
| Industry | F500 HQs | Revenue |
|---|---|---|
| Energy | 16 | $1,198B |
|
||
| Technology | 5 | $198B |
|
||
| Engineering / Construction | 4 | $72B |
|
||
| Energy Services | 3 | $60B |
|
||
| Utilities | 3 | $41B |
|
||
| Healthcare | 2 | $330B |
|
||
Price history
3 events — show timeline
- 2026-06-10 Listed $229,000 NTREIS
- 2026-04-21 Sold (Public Records) — Public Records
- 2003-02-06 Sold (Public Records) — Public Records
Property tax history
+1.8%/yrLatest (2025): $1,910 · +10.6% YoY. Source: county tax records.
Cash-flow waterfall
monthlySold comps — $/sqft
last 12 mo · ≤1 miLoading sold comps…