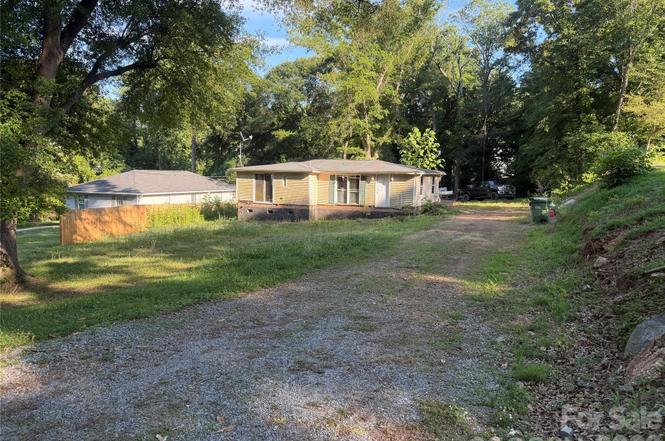
207 Mauney St · Mount Holly, NC
Flood risk 5/10 · Moderate
- FEMA flood zone
- X (unshaded)
- Chance of flooding over 30 yrs
- 0.24%
- Est. flood insurance / yr
- $507 – $1,088
Fire risk 1/10 · Minimal
- Est. fire insurance / yr
- $906 – $1,684
Heat risk 6/10 · Moderate
- Hot days now (above 105°F)
- 7 days/yr
- Hot days in 30 yrs
- 17 days/yr
Wind risk 5/10 · Moderate
- Chance of severe wind over 30 yrs
- 23.0%
Air-quality risk 3/10 · Minor
- Unhealthy air days now
- 3 days/yr
- Unhealthy air days in 30 yrs
- 4 days/yr
Risk factors via First Street. Map © Google.
Why this score? — see what drove the B+ grade
The composite is a weighted blend of 9 inputs, each scored 0–100. Each bar is that input's sub-score; the figure is the points it added to the 100-point composite (weight × sub-score).
- Cash flow +30.0/30.0
- ARV discount +15.0/15.0
- 1% rule +10.0/10.0
- DSCR +10.0/10.0
- Schools +3.6/10.0
- Livability +3.4/5.0
- Rent growth +3.0/5.0
- Condition / age +2.5/5.0
- Appreciation +0.0/10.0
$110,000
🖨 Deal sheet 📄 Offer letter ✓ Due diligence
Listing remarks MLS
The home may need structural repairs (there's no reports or inspections) but from the living room middle of the house, it appears that way. Cash offers only. The interior was functioning and lived in until January 2019 and that's all the seller knows (owned less than a yr). GREAT location (walking distance to the Tailrace Marina and the Tuckasegee park) in desired school. Price reflects that the house will be sold AS-IS, with no repairs to be made by the seller. Please use caution backing out of the driveway is a ditch on the left side.
Key facts
- 0.35 acre lot
- Built 1950
Property features AI
Finance
- HOA & community: No HOA dues; Not subject to an HOA
Exterior
- Parking: No garage; No designated parking features
- Utilities: City water; Public sewer
- Home design: Single-family residence (residential); One level
- Construction: Site-built construction; Vinyl exterior; Crawl space foundation; Shingle roof not specified
- Exterior features: Lot approximately 0.35 acres; Roads are gravel and paved; Publicly maintained road
Interior
- Kitchen: No appliances specified
- Bedrooms: Three bedrooms on the main level
- Bathrooms: Two full bathrooms (both on the main level)
- Heating & cooling: No heating specified; No cooling specified
- Interior features: Seven total rooms; Laundry room
- Laundry & utility: Dedicated laundry room
Neighborhood map
What this means for you Summary
Snapshot
- This is a 3-bed/1.0-bath single-family listed at $110k.
Deal economics
- At list price, monthly cash flow is $867 ($10k/yr) — positive.
- The deal already cash-flows at list — no discount required.
- Meets the 1% rule at list price ($2k rent vs $110k).
- Cap rate 15.7% vs local median 3.9% in Mount Holly — top-decile yield for the area; either an underpriced asset or a hidden risk that comps aren't pricing in. Stress-test before assuming the spread holds.
Location & tenants
- Location reads 67/100 on livability (#214 in NC) — a middle-class / working-renter tenant base. Strengths: cost of living A+, housing A+, crime A-; Watch: employment D+, health & safety D+, schools D.
- Gaston County Schools (suburban): math 44% / reading 42% proficiency, ranked #93 of 178 in NC (top 52%) — families likely to look elsewhere, expect single-tenant / working-renter base with shorter leases.
- Market conditions: Rents rising (+2.1%/yr); 134 active listings in the ZIP; 15 comparable units currently listed for rent nearby; rentals at typical pace (median 22d on market — plan ~3-4 weeks tenant-placement turnaround); solid renter incomes; 2,069 units permitted in Gaston County in 2024 (142 in 5+ unit buildings).
- This rent runs 31% of the median local income ($78k/yr) — at the standard rent-burdened threshold; future hikes will face affordability resistance.
Forward outlook
- Local home prices are declining (-3.0%/yr); year-one equity from $761 of loan paydown is wiped out by about $3k of value loss. Plan a longer hold.
- Gaston County population projected at +12% by 2050 — modest demand growth; plan on rents tracking national, not racing it.
- At projected returns (-3.0% appreciation + 2.1% rent growth), your $31k cash investment doubles in ~4 years — after that, you're playing with house money.
Negotiation context
- Only 1 days on market — expect competitive offers; lowballing is unlikely to land.
- 2 sale attempts since 7y ago with the ask held roughly flat each time — persistent listings suggest the price (not the market) is what's stuck; bring a comps-based counter.
- Current owner paid $60k; list at $110k implies a 82% gain — meaningful room to come down on a strong offer.
Risks & watch-outs
- Watch-outs: built in 1950 — expect roof / HVAC / electrical / plumbing capex.
- Climate carrying-cost: moderate flood risk; moderate wind risk, 23% chance of damaging wind over 30y; extreme-heat days projected 7→17/yr by 2055 (HVAC capex compounding) — expect insurance premiums to compound above CPI over the hold.
Questions for the listing agent
- Built in 1950 — when were the roof, HVAC, electrical panel, plumbing, and water heater last replaced?
- Is there a deadline driving the sale (1031 exchange, divorce, estate, relocation)? That informs how much negotiation room exists.
- Schools are D-rated, which usually means shorter tenancies and higher turnover. Who's the typical renter profile here, and what's been the actual vacancy rate?
- What's the average days-on-market for RENTAL listings here right now (not sales)? A rising rental-DOM trend means longer vacancies and softer asking-rent achievability than the comps imply.
- What's the recent tenant-quality profile in this submarket — average credit score on applications, eviction rate, late-payment / NSF rate, and stable-employment percentage? A property-management company in the area should have these aggregated.
- How much new for-sale + rental construction is in the pipeline within 1–3 miles? Heavy new supply typically softens prices + rents 12–24 months out; constrained supply supports both.
Investment metrics
- 1% rule
- 1.86% ✓
- Cap rate
- 15.75%
- Cash-on-cash
- 33.77%
- DSCR
- 2.50
- GRM
- 4.5
CMA / ARV
- ARV (on-the-fly)
- $196,560
- Comps found
- 9
Show comp detail 9 sales within ~0.75 mi
| Address | Dist | Beds/Ba | Sqft | Sold | Price | $/sf | Match |
|---|---|---|---|---|---|---|---|
| 104 Price St | 0.08mi | 3/1.0 | 924 (-11%) | 3mo | $135,000 | $146 | 75 |
| 1306 S Main St | 0.62mi | 2/1.5 (-1) | 1,118 (+8%) | 1mo | $230,000 | $206 | 51 |
| 102 Fire Department Dr | 0.56mi | 2/1.0 (-1) | 936 (-10%) | 6mo | $165,000 | $176 | 47 |
| 109 Belton Ave | 0.69mi | 2/1.5 (-1) | 1,062 (+2%) | 13mo | $235,000 | $221 | 47 |
| 307 Adrian St | 0.74mi | 2/1.0 (-1) | 960 (-8%) | 2mo | $165,000 | $172 | 46 |
| 104 1/2 Tomberlin Rd | 0.60mi | 2/1.0 (-1) | 1,176 (+13%) | 13mo | $165,000 | $140 | 35 |
| 1304 S Main St | 0.61mi | 3/2.0 | 1,177 (+13%) | 14mo | $270,000 | $229 | 34 |
| 103 Fairview St | 0.67mi | 3/2.0 | 1,190 (+14%) | 14mo | $315,000 | $265 | 29 |
| 112 Adcock St | 0.73mi | 2/2.0 (-1) | 895 (-14%) | 15mo | $169,000 | $189 | 21 |
Match score weights: distance 35% · size 25% · config 20% · recency 20%. Top-matched comps best support the ARV.
Projected returns pro-forma
-3.0% appreciation · 2.14% rent growth · sell at horizon
- IRR
- 28.1%
- Equity multiple
- 2.16×
- Total profit
- $35,645
- Equity at exit
- $16,401
- IRR
- 35.1%
- Equity multiple
- 4.09×
- Total profit
- $95,141
- Equity at exit
- $9,511
Cash invested: $30,800 (down + closing). Projections, not guarantees.
Landlord ↔ Tenant lean methodology
- Overall (STATE)
- 85 Strongly Landlord-Friendly
- State North Carolina
- 85 Strongly Landlord-Friendly · R+3
- County
- — inherits STATE
- City
- — inherits STATE
ZIP-level market 28120
- Rents YoY
- 2.1%
- Active inventory
- 134
- Price-to-rent
- 4.5×
Monthly cashflow live
- Estimated rent
- $2,044 high interval (Pro) →
- Mortgage (P&I)
- −$577
- Tax from tax record
- −$125 /mo · $1,502/yr
- Insurance
- −$46
- HOA
- −$0
- Vacancy / Maint / Mgmt
- −$429
- Net cashflow
- $867
Break-even live
UW: 25.0% down · 7.5% · 30yr · 1.5% tax · 5.0% vac · 8.0% maint · 8.0% mgmt
Financing live
Cash to close
- Down payment
- $27,500
- Closing costs
- $3,300
- Reserves months
- —
- Total cash needed
- —
Loan-product check · same deal, 3 products live
Conventional
25% down · 7.5% · 30yr
- Down + closing
- —
- Monthly P&I
- —
- Monthly cashflow
- —
- DSCR
- —
- Eligible?
- —
Personal DTI + credit; lowest rate.
DSCR
20% down · 8.5% · 30yr
- Down + closing
- —
- Monthly P&I
- —
- Monthly cashflow
- —
- DSCR
- —
- Eligible?
- —
No personal income docs; deal must DSCR.
Hard money
10% down · 12.0% · 12mo
- Down + closing
- —
- Monthly P&I
- —
- Monthly cashflow
- —
- DSCR
- —
- Eligible?
- —
Short-term bridge; refi at stabilization.
Rent comps 15 comps
| Address | Beds | Baths | Sqft | Rent | $/sqft | DOM | Units | Dist |
|---|---|---|---|---|---|---|---|---|
| 308 Eastwood Dr Mount Holly, NC | 3.0 | 2.5 | 1414 | $2,400 | $1.70 | 23d | 1 | 0.27mi |
| 224 Howard St Mount Holly, NC | 2.0 | 1.0 | 917 | $1,450 | $1.58 | 23d | 1 | 0.38mi |
| 301 Tomberlin Rd Mount Holly, NC | 3.0 | 2.0 | 1349 | $2,500 | $1.85 | 23d | 1 | 0.64mi |
| 301 Tomberlin Rd Mount Holly, NC | 3.0 | 2.0 | 1349 | $2,400 | $1.78 | 4d | 1 | 0.64mi |
| 106 Adcock St Belmont, NC | 3.0 | 1.5 | 1084 | $1,850 | $1.71 | 23d | 1 | 0.73mi |
| 417 River Park Rd Belmont, NC | 2.0 | 2.5 | 1156 | $1,750 | $1.51 | 23d | 1 | 0.81mi |
| 106 Margarette Ave Belmont, NC | 2.0 | 2.0 | 1250 | $1,750 | $1.40 | 23d | 1 | 0.84mi |
| 107 Robinson St Belmont, NC | 3.0 | 2.0 | 1300 | $3,600 | $2.77 | 4d | 1 | 0.92mi |
| 404 Belmont Mount Holly Rd Belmont, NC | 2.0 | 1.5 | 1050 | $1,648 | $1.57 | 14d | 2 | 1.01mi |
| 63 Caldwell Dr Belmont, NC | 1.0–3.0 | 1.0–2.0 | 1056 | $2,335 | $2.21 | 2d | 41 | 1.09mi |
| 214 Ferstl Ave Belmont, NC | 2.0 | 1.0 | 1014 | $1,250 | $1.23 | 23d | 1 | 1.14mi |
| 318 Highland St Mount Holly, NC | 2.0 | 2.0 | 980 | $1,250 | $1.28 | 21d | 1 | 1.17mi |
| 318 Highland St Unit 2 Mt Holly, NC | 2.0 | 1.5 | 950 | $1,250 | $1.32 | 11d | 1 | 1.18mi |
| 199 Belmont Mt Holly Rd Belmont, NC | 1.0–2.0 | 1.0–1.5 | 874 | $1,925 | $2.20 | 2d | 9 | 1.38mi |
| 300 E Charlotte Ave Mount Holly, NC | 2.0 | 1.5 | 1000 | $1,358 | $1.36 | 4d | 3 | 1.47mi |
Listing history 2 events
-
2026-06-17remarks 76-char remark
-
2026-06-17$110,000 Pending 1 DOM
ⓘ Source: listings_history table (triggers on properties + properties_extension) + one-shot
backfill from property_details.listing_events for pre-trigger history.
Tax reassessment forecast NC · Resets to sale price
- Current annual tax
- $1,502 · $125/mo
- Projected year-2 tax
- $1,502 · $125/mo
- Expected delta
- $0/yr ($0/mo · 0.0%)
ⓘ Screening estimate from a state-policy table — verify with the county assessor before closing.
Climate risk First Street
- Flood 5/10 Major FEMA zone X (unshaded) · 24% chance over 30 yrs
- Wildfire 1/10 Low
- Heat 6/10 Major 7 d/yr ≥105°F today · 17 d/yr by 30 yrs out
- Wind 5/10 Major 23% chance of damaging wind over 30 yrs
- Air quality 3/10 Moderate 3 unhealthy d/yr today · 4 by 30 yrs out
Nearby sold comps map
Loading sold comps map…
Walkable amenities ~0.75 mi
Loading nearby amenities…
Taxation est. · year 1
- Rental income
- $24,525
- − Mortgage interest
- −$6,162
- − Property taxes
- −$1,502
- − Insurance
- −$550
- − Repairs & maintenance
- −$1,962
- − Management
- −$1,962
- − Depreciation
- −$3,200
- Taxable income
- $9,187
- Est. tax owed @ 24.0%
- −$2,205
- After-tax cash flow
- $8,195/yr
For passive investors: Depreciation is non-cash, so a rental often shows a tax loss while cash-flowing — sheltering income. Rental losses are passive: they offset passive income freely, and up to $25,000/yr can offset ordinary (W-2) income if you actively participate and your MAGI is under $100k (phasing out to $0 by $150k); unused losses carry forward. On sale, claimed depreciation is recaptured at up to 25%, and gains may owe capital-gains tax (a 1031 exchange can defer both). Figures are a year-1 estimate at your 24.0% rate — not tax advice; consult a CPA.
Schools (NCES district)
- District
- Gaston County Schools
- NCES district ID
- 3701620
- Math proficiency
- 44% ▲ 4.00%
- Reading proficiency
- 42% ▲ 1.00%
- Median HH income
- $43,644
- Composite
- 36.39/100
- National rank
- #4680
- State rank
- #93 of 178 in NC
Livability — Mount Holly
- Score
- 67/100
- State rank
- #214
- US rank
- #10224
Category grades
Schools grade is shown separately in the Schools card above.
Census & demographics
- Census place
- Mount Holly, NC
- County
- Gaston County · 201,497 people
- City population
- 25,805
- Metro
- Charlotte-Concord-Gastonia, NC-SC
- Population (ZIP)
- 25,805
- Household income
- $78,231
- Rent vs Own
- Severe rent burden
- 817.0
Population outlook (Gaston County) Hauer SSP2
- Today (2025)
- 230,027 people
- By 2030
- 237,300 · +3.2%
- By 2040
- 249,659 · +8.5%
- By 2050
- 257,806 · +12.1%
- By 2075
- 272,163 · +18.3%
- By 2100
- 268,652 · +16.8%
Race, ethnicity, and origin ACS 2023
- Neighborhood character
- Predominantly White (71%)
- Race & ethnicity
- White 71% Black 14% Hispanic / Latino 9% Two or more races 8% Asian 2%
- Hispanic origin (detail)
- Mexican 3% Puerto Rican 3%
- Common ancestry
- Serbian 3% Slovak 2% Italian 2%
- Foreign-born
- 6% · Canada, Jamaica, Dominican Republic
- Languages at home
- 92% English-only · Spanish 6% Other Asian/Pacific 1% Other Indo-European 1%
Political lean MEDSL · Gaston
- 2024 margin
- Strong R (+25.0) · D 37.0% · R 62.1%
- 2008→2024 swing
- 0.0pp no change · 2008: -25.0pp · 2024: -25.0pp
- All cycles
- 2024: R+25.0 2020: R+27.8 2016: R+32.1 2012: R+25.6 2008: R+25.0
Not yet ingested
- Civics
- —
Market trends
- HPI YoY
- ▼ -141.08%
- Current HPI
- 245.2596
- Rent YoY
- ▲ 2.14%
- Metro
- Charlotte-Concord-Gastonia, NC-SC
- State GDP YoY
- ▲ 3.28%
- F500 in state
- 26
Industry mix (Fortune 500 HQ in NC)
| Industry | F500 HQs | Revenue |
|---|---|---|
| Financial Services | 2 | $213B |
|
||
| Retail | 2 | $95B |
|
||
| Industrial Conglomerate | 1 | $38B |
|
||
| Metals / Steel | 1 | $35B |
|
||
| Utilities | 1 | $30B |
|
||
| Industrial Machinery | 1 | $19B |
|
||
Price history
+494.6% since first listed8 events — show timeline
- 2026-06-17 Pending — CANOPYMLS as Distributed by MLS Grid
- 2026-06-17 Listed $110,000 CANOPYMLS as Distributed by MLS Grid
- 2019-02-25 Sold (Public Records) $60,500 Public Records
- 2019-02-25 Sold (MLS) $60,333 CANOPYMLS as Distributed by MLS Grid
- 2019-02-13 Contingent — CANOPYMLS as Distributed by MLS Grid
- 2019-02-11 Listed $58,000 CANOPYMLS as Distributed by MLS Grid
- 2011-07-29 Sold (Public Records) $19,000 Public Records
- 2011-07-28 Sold (MLS) $18,500 CANOPYMLS as Distributed by MLS Grid
Property tax history
+8.5%/yrLatest (2025): $1,502 · +0.0% YoY. Source: county tax records.
Cash-flow waterfall
monthlySold comps — $/sqft
last 12 mo · ≤1 miLoading sold comps…