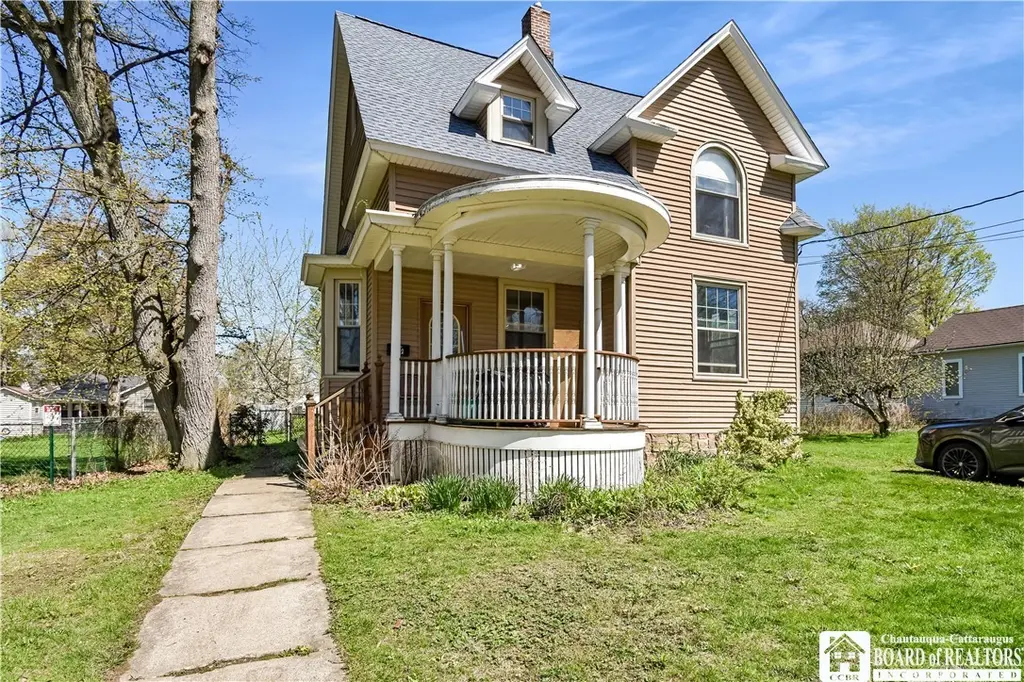
29 Beckman Ave · Westfield, NY
Flood risk 1/10 · Minimal
- FEMA flood zone
- X
- Chance of flooding over 30 yrs
- 0.0%
- Est. flood insurance / yr
- $473 – $860
Fire risk 1/10 · Minimal
- Est. fire insurance / yr
- $691 – $1,283
Heat risk 2/10 · Minimal
- Hot days now (above 93°F)
- 7 days/yr
- Hot days in 30 yrs
- 16 days/yr
Wind risk 1/10 · Minimal
- Chance of severe wind over 30 yrs
- —
Air-quality risk 2/10 · Minimal
- Unhealthy air days now
- 1 days/yr
- Unhealthy air days in 30 yrs
- 3 days/yr
Risk factors via First Street. Map © Google.
Why this score? — see what drove the D+ grade
The composite is a weighted blend of 9 inputs, each scored 0–100. Each bar is that input's sub-score; the figure is the points it added to the 100-point composite (weight × sub-score).
- ARV discount +11.4/15.0
- Cash flow +9.1/30.0
- Appreciation +6.1/10.0
- Schools +5.1/10.0
- Livability +3.6/5.0
- 1% rule +3.5/10.0
- DSCR +2.6/10.0
- Rent growth +2.5/5.0
- Condition / age +2.5/5.0
$145,000
🖨 Deal sheet 📄 Offer letter ✓ Due diligence
Listing remarks
Located on a double lot in the Village of Westfield, this home offers space inside and out. The curved front porch leads into a large entry with original woodwork and a traditional layout. The main level includes a living room, formal dining room, and kitchen with plenty of cabinet space. Off the kitchen is a bright back room—perfect for a sewing room, home office, or sitting area—with access to the deck and backyard. Upstairs are three bedrooms and a full bath. There is also a half bath on the first floor, along with extra storage. Outside, the double lot includes fruit trees, garden space, and a one-car garage. Forced air heat and central A/C are in place. A/C is not currently
Key facts
- Double lot
- Bright back room
- Access to the deck
Tags
Neighborhood map
What this means for you Summary
Snapshot
- This is a 3-bed/1.5-bath single-family listed at $145k.
Deal economics
- At list price, monthly cash flow is $-110 ($-1k/yr) — negative.
- To cash-flow at today's rent, offer at most $126k (13.4% below list).
- To meet the 1% rule (rent ≥ 1% of price), the offer needs to be $123k (15.0% below list).
- Recommended offer: $123k (15.0% below list) — sets the bar for 1% rule.
Location & tenants
- Location reads 72/100 on livability (#364 in NY) — a middle-class / working-renter tenant base. Strengths: cost of living A+, health & safety A, crime B+; Watch: employment D, amenities F, commute F.
- Westfield Central School District (town): math 57% / reading 64% proficiency, ranked #246 of 590 in NY (top 42%) — acceptable for families but not a draw, mixed tenant base, ~2y average lease.
- Market conditions: 31 active listings in the ZIP; 127 units permitted in Chautauqua County in 2024 (0 in 5+ unit buildings).
Forward outlook
- In year one you build about $4k of equity ($1k loan paydown + $3k appreciation (2.2% local appreciation)).
- Chautauqua County population projected at -22% by 2050 — secular population decline; favor cash flow + early exit over multi-decade hold.
- By year 8, paydown + projected appreciation supports a ~$32k cash-out refi (75% LTV) — recoverable capital for the next deal without selling this one.
Negotiation context
- Only 6 days on market — expect competitive offers; lowballing is unlikely to land.
Risks & watch-outs
- Watch-outs: built in 1900 — expect roof / HVAC / electrical / plumbing capex.
Questions for the listing agent
- What do current leases actually rent for vs. the listed asking? Can we see a recent rent roll and the last 12 months of T-12 income?
- Built in 1900 — when were the roof, HVAC, electrical panel, plumbing, and water heater last replaced?
- Is there a deadline driving the sale (1031 exchange, divorce, estate, relocation)? That informs how much negotiation room exists.
- Schools are B-rated — typically a magnet for longer-tenancy family renters. What's the average tenant stay here, and is there a school-zone premium baked into asking?
- The area grade is low — what's the realistic commute time and amenity access for the typical tenant pool here? Any planned neighborhood developments (good or bad) we should know about?
- What's the average days-on-market for RENTAL listings here right now (not sales)? A rising rental-DOM trend means longer vacancies and softer asking-rent achievability than the comps imply.
- What's the recent tenant-quality profile in this submarket — average credit score on applications, eviction rate, late-payment / NSF rate, and stable-employment percentage? A property-management company in the area should have these aggregated.
- How much new for-sale + rental construction is in the pipeline within 1–3 miles? Heavy new supply typically softens prices + rents 12–24 months out; constrained supply supports both.
Investment metrics
- 1% rule
- 0.85% ✗
- Cap rate
- 5.38%
- Cash-on-cash
- -3.25%
- DSCR
- 0.86
- GRM
- 9.8
CMA / ARV
- ARV (on-the-fly)
- $158,578
- Comps found
- 10
Show comp detail 10 sales within ~0.75 mi
| Address | Dist | Beds/Ba | Sqft | Sold | Price | $/sf | Match |
|---|---|---|---|---|---|---|---|
| 17 Beckman Ave | 0.06mi | 4/2.0 (+1) | 1,682 (-0%) | 7mo | $145,000 | $86 | 84 |
| 45 Backman Ave | 0.07mi | 3/2.5 | 1,684 (-0%) | 11mo | $130,000 | $77 | 83 |
| 25 Pleasant Ave | 0.12mi | 4/1.5 (+1) | 1,687 (0%) | 17mo | $165,000 | $98 | 75 |
| 105 Union St | 0.25mi | 3/2.0 | 1,716 (+2%) | 11mo | $161,960 | $94 | 75 |
| 117 Jefferson St | 0.60mi | 3/2.0 | 1,712 (+2%) | 11mo | $200,000 | $117 | 58 |
| 106 Chestnut St | 0.68mi | 3/2.0 | 1,542 (-9%) | 6mo | $180,200 | $117 | 47 |
| 12 Jefferson St | 0.61mi | 3/1.5 | 1,775 (+5%) | 24mo | $142,000 | $80 | 43 |
| 16 Clark St | 0.64mi | 3/1.5 | 1,546 (-8%) | 16mo | $116,600 | $75 | 43 |
| 96 W Main St | 0.54mi | 3/3.0 | 1,546 (-8%) | 20mo | $92,000 | $60 | 38 |
| 10 Chestnut St | 0.56mi | 4/1.5 (+1) | 1,884 (+12%) | 16mo | $189,900 | $101 | 36 |
Match score weights: distance 35% · size 25% · config 20% · recency 20%. Top-matched comps best support the ARV.
Projected returns pro-forma
2.25% appreciation · 3.0% rent growth · sell at horizon
- IRR
- 2.2%
- Equity multiple
- 1.12×
- Total profit
- $4,859
- Equity at exit
- $59,172
- IRR
- 6.0%
- Equity multiple
- 1.85×
- Total profit
- $34,509
- Equity at exit
- $86,757
Cash invested: $40,600 (down + closing). Projections, not guarantees.
Landlord ↔ Tenant lean methodology
- Overall (STATE)
- 15 Strongly Tenant-Friendly
- State New York
- 15 Strongly Tenant-Friendly · D+10
- County
- — inherits STATE
- City
- — inherits STATE
ZIP-level market 14787
- Home prices YoY
- 0.8%
- Active inventory
- 31
- Price-to-rent
- 9.8×
Monthly cashflow live
- Estimated rent
- $1,233 medium interval (Pro) →
- Mortgage (P&I)
- −$760
- Tax from tax record
- −$263 /mo · $3,157/yr
- Insurance
- −$60
- HOA
- −$0
- Vacancy / Maint / Mgmt
- −$259
- Net cashflow
- $-110
Break-even live
UW: 25.0% down · 7.5% · 30yr · 1.5% tax · 5.0% vac · 8.0% maint · 8.0% mgmt
Financing live
Cash to close
- Down payment
- $36,250
- Closing costs
- $4,350
- Reserves months
- —
- Total cash needed
- —
Loan-product check · same deal, 3 products live
Conventional
25% down · 7.5% · 30yr
- Down + closing
- —
- Monthly P&I
- —
- Monthly cashflow
- —
- DSCR
- —
- Eligible?
- —
Personal DTI + credit; lowest rate.
DSCR
20% down · 8.5% · 30yr
- Down + closing
- —
- Monthly P&I
- —
- Monthly cashflow
- —
- DSCR
- —
- Eligible?
- —
No personal income docs; deal must DSCR.
Hard money
10% down · 12.0% · 12mo
- Down + closing
- —
- Monthly P&I
- —
- Monthly cashflow
- —
- DSCR
- —
- Eligible?
- —
Short-term bridge; refi at stabilization.
Listing history 2 events
-
2026-04-24status Pending
-
2026-04-18$145,000 Active
ⓘ Source: listings_history table (triggers on properties + properties_extension) + one-shot
backfill from property_details.listing_events for pre-trigger history.
Tax reassessment forecast NY · Partial reset (capped growth)
- Current annual tax
- $3,157 · $263/mo
- Projected year-2 tax
- $3,157 · $263/mo
- Expected delta
- $0/yr ($0/mo · 0.0%)
ⓘ Screening estimate from a state-policy table — verify with the county assessor before closing.
Climate risk First Street
- Flood 1/10 Low FEMA zone X · 0% chance over 30 yrs
- Wildfire 1/10 Low
- Heat 2/10 Low 7 d/yr ≥93°F today · 16 d/yr by 30 yrs out
- Wind 1/10 Low
- Air quality 2/10 Low 1 unhealthy d/yr today · 3 by 30 yrs out
Nearby sold comps map
Loading sold comps map…
Walkable amenities ~0.75 mi
Loading nearby amenities…
Taxation est. · year 1
- Rental income
- $14,791
- − Mortgage interest
- −$8,122
- − Property taxes
- −$3,157
- − Insurance
- −$725
- − Repairs & maintenance
- −$1,183
- − Management
- −$1,183
- − Depreciation
- −$4,218
- Taxable loss
- −$3,797
- Est. tax savings @ 24.0%
- +$911
- After-tax cash flow
- $-410/yr
For passive investors: Depreciation is non-cash, so a rental often shows a tax loss while cash-flowing — sheltering income. Rental losses are passive: they offset passive income freely, and up to $25,000/yr can offset ordinary (W-2) income if you actively participate and your MAGI is under $100k (phasing out to $0 by $150k); unused losses carry forward. On sale, claimed depreciation is recaptured at up to 25%, and gains may owe capital-gains tax (a 1031 exchange can defer both). Figures are a year-1 estimate at your 24.0% rate — not tax advice; consult a CPA.
Schools (NCES district)
- District
- Westfield Central School District
- NCES district ID
- 3630990
- Math proficiency
- 57% ▼ -13.00%
- Reading proficiency
- 64% ▲ 9.00%
- Median HH income
- $41,283
- Composite
- 50.63/100
- National rank
- #1838
- State rank
- #246 of 590 in NY
Livability — Westfield
- Score
- 72/100
- State rank
- #364
- US rank
- #6214
Category grades
Schools grade is shown separately in the Schools card above.
Census & demographics
- Census place
- Westfield, NY
- City population
- 4,863
- Population (ZIP)
- 4,863
Population outlook (Chautauqua County) Hauer SSP2
- Today (2025)
- 123,454 people
- By 2030
- 118,509 · -4.0%
- By 2040
- 107,311 · -13.1%
- By 2050
- 96,703 · -21.7%
- By 2075
- 76,757 · -37.8%
- By 2100
- 60,984 · -50.6%
Race, ethnicity, and origin ACS 2023
- Neighborhood character
- Predominantly White (94%)
- Race & ethnicity
- White 94% Asian 3% Hispanic / Latino 2% Native American 2%
- Common ancestry
- Romanian 7% Iranian 2% Slovak 1%
- Foreign-born
- 2% · Vietnam, South Korea
- Languages at home
- 93% English-only · Spanish 3% Vietnamese 2% German/W. Germanic 1%
Political lean MEDSL · Chautauqua
- 2024 margin
- Strong R (+22.0) · D 39.0% · R 61.0%
- 2008→2024 swing
- -22.9pp toward R · 2008: 0.9pp · 2024: -22.0pp
- All cycles
- 2024: R+22.0 2020: R+19.8 2016: R+24.6 2012: R+8.2 2008: D+0.9
Not yet ingested
- Civics
- —
Market trends
- HPI YoY
- ▲ 2.25%
- Current HPI
- 280.9476
- Rent YoY
- —
- Metro
- —
- State GDP YoY
- ▲ 2.60%
- F500 in state
- 92
Industry mix (Fortune 500 HQ in NY)
| Industry | F500 HQs | Revenue |
|---|---|---|
| Financial Services | 10 | $950B |
|
||
| Consumer Goods | 9 | $162B |
|
||
| Insurance | 4 | $225B |
|
||
| Telecommunications | 2 | $144B |
|
||
| Pharmaceuticals | 2 | $112B |
|
||
| Media / Entertainment | 2 | $69B |
|
||
Price history
2 events — show timeline
- 2026-04-24 Pending — UNYREIS
- 2026-04-18 Listed $145,000 UNYREIS
Property tax history
+6.3%/yrLatest (2025): $3,157 · +0.7% YoY. Source: county tax records.
Cash-flow waterfall
monthlySold comps — $/sqft
last 12 mo · ≤1 miLoading sold comps…