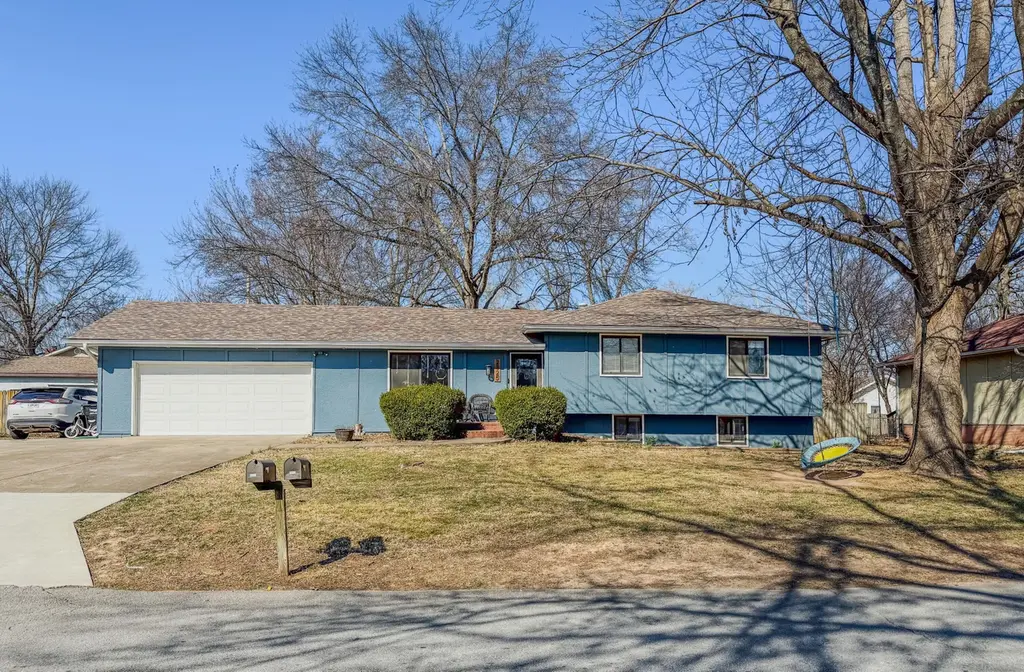
2325 W Alta St · Springfield, MO
Flood risk 1/10 · Minimal
- FEMA flood zone
- X (unshaded)
- Chance of flooding over 30 yrs
- 0.0%
- Est. flood insurance / yr
- $473 – $860
Fire risk 2/10 · Minimal
- Est. fire insurance / yr
- $1,054 – $1,958
Heat risk 5/10 · Moderate
- Hot days now (above 105°F)
- 7 days/yr
- Hot days in 30 yrs
- 19 days/yr
Wind risk 2/10 · Minimal
- Chance of severe wind over 30 yrs
- 0.0%
Air-quality risk 1/10 · Minimal
- Unhealthy air days now
- 0 days/yr
- Unhealthy air days in 30 yrs
- 0 days/yr
Risk factors via First Street. Map © Google.
Why this score? — see what drove the D+ grade
The composite is a weighted blend of 9 inputs, each scored 0–100. Each bar is that input's sub-score; the figure is the points it added to the 100-point composite (weight × sub-score).
- ARV discount +13.6/15.0
- Cash flow +13.3/30.0
- DSCR +4.0/10.0
- Livability +3.8/5.0
- Schools +3.2/10.0
- Rent growth +3.1/5.0
- 1% rule +2.7/10.0
- Condition / age +2.5/5.0
- Appreciation +0.0/10.0
$285,000
🖨 Deal sheet 📄 Offer letter ✓ Due diligence
Listing remarks MLS
ONE YEAR HOME WARRANTY PROVIDED BY SELLER!!! This split level home with 3 bedrooms upstairs and a non-conforming bedroom downstairs boasts two spacious living areas with beautifully designed finishes. The master bath has been re-designed with modern tile work in the shower and floors. Complete with new lighting, vanity and mirror with today's buyers in mind. Speaking of flooring, this home is solid surface throughout with tile, vinyl plank and laminate floors for continuity through the whole home. The board and batten word work on the main level and hallway really gives it that rich finish you'll love. Take a trip out back to a great deck that walks down to a patio for summer grilling and a fire pit built into the spacious backyard for evening marsh mellow roasting. Completely ready to move in just put your furnishings in and start living.
Key facts
- New lighting
- Modern tile work
- 0.34 acre lot
Tags
Neighborhood map
What this means for you Summary
Snapshot
- This is a 3-bed/2.5-bath single-family listed at $285k.
Deal economics
- At list price, monthly cash flow is $-2 ($-26/yr) — negative.
- To cash-flow at today's rent, offer at most $285k (0.1% below list).
- To meet the 1% rule (rent ≥ 1% of price), the offer needs to be $219k (23.1% below list).
- Recommended offer: $219k (23.1% below list) — sets the bar for 1% rule.
- Cap rate 6.3% vs local median 4.6% in Springfield — top-decile yield for the area; either an underpriced asset or a hidden risk that comps aren't pricing in. Stress-test before assuming the spread holds.
Location & tenants
- Location reads 75/100 on livability (#57 in MO, #4,121 nationally) — a middle-class / working-renter tenant base. Strengths: commute A+, cost of living A+, housing A+; Watch: crime F, employment F.
- Springfield R-XII (urban): math 32% / reading 46% proficiency, ranked #174 of 324 in MO (top 54%) — families likely to look elsewhere, expect single-tenant / working-renter base with shorter leases.
- Market conditions: Rents rising (+2.5%/yr); 250 active listings in the ZIP; 5 comparable units currently listed for rent nearby; rentals at typical pace (median 23d on market — plan ~3-4 weeks tenant-placement turnaround); solid renter incomes; 1,302 units permitted in Greene County in 2024 (250 in 5+ unit buildings).
Forward outlook
- Local home prices are declining (-3.0%/yr); year-one equity from $2k of loan paydown is wiped out by about $9k of value loss. Plan a longer hold.
- Greene County population projected at +25% by 2050 — long-run rental-demand tailwind backs the buy-and-hold thesis.
Negotiation context
- It's been on market 31 days — a 3% lower offer ($276k) is reasonable based on typical stale-listing flexibility.
- 5 sale attempts since 9y ago with the ask held roughly flat each time — persistent listings suggest the price (not the market) is what's stuck; bring a comps-based counter.
Risks & watch-outs
- Climate carrying-cost: extreme-heat days projected 7→19/yr by 2055 (HVAC capex compounding) — expect insurance premiums to compound above CPI over the hold.
Questions for the listing agent
- What do current leases actually rent for vs. the listed asking? Can we see a recent rent roll and the last 12 months of T-12 income?
- It's been on market 31 days. Have you received any prior offers? Is the seller open to a 23% concession, seller financing, or rate buy-down credit?
- Built in 1979 — when were the roof, HVAC, electrical panel, plumbing, and water heater last replaced?
- Is there a deadline driving the sale (1031 exchange, divorce, estate, relocation)? That informs how much negotiation room exists.
- Crime grade is F in this area — have there been break-ins, vandalism, or insurance claims at this property in the last 3 years? What carrier currently insures it and at what premium?
- The area grade is low — what's the realistic commute time and amenity access for the typical tenant pool here? Any planned neighborhood developments (good or bad) we should know about?
- What's the average days-on-market for RENTAL listings here right now (not sales)? A rising rental-DOM trend means longer vacancies and softer asking-rent achievability than the comps imply.
- What's the recent tenant-quality profile in this submarket — average credit score on applications, eviction rate, late-payment / NSF rate, and stable-employment percentage? A property-management company in the area should have these aggregated.
- How much new for-sale + rental construction is in the pipeline within 1–3 miles? Heavy new supply typically softens prices + rents 12–24 months out; constrained supply supports both.
Investment metrics
- 1% rule
- 0.77% ✗
- Cap rate
- 6.28%
- Cash-on-cash
- -0.03%
- DSCR
- 1.00
- GRM
- 10.8
CMA / ARV
- ARV (median comp)
- $329,663
- List price
- $285,000
- Delta
- -13.55%
- Verdict
- UNDERPRICED
- Comps
- 20 within 1.0 mi
Show comp detail 12 sales within ~0.75 mi
| Address | Dist | Beds/Ba | Sqft | Sold | Price | $/sf | Match |
|---|---|---|---|---|---|---|---|
| 2325 W Alta St | 0.00mi | 4/2.0 (+1) | 1,940 (0%) | 0mo | $285,000 | $147 | 93 |
| 1920 W Murray Dr | 0.35mi | 4/2.0 (+1) | 1,978 (+2%) | 3mo | $314,900 | $159 | 71 |
| 4445 S Farm Road 137 | 0.62mi | 3/2.5 | 1,877 (-3%) | 2mo | $250,000 | $133 | 64 |
| 2983 W Teton Dr | 0.73mi | 3/2.0 | 1,920 (-1%) | 1mo | $440,000 | $229 | 62 |
| 2301 W Camino Alto St | 0.56mi | 3/2.0 | 1,819 (-6%) | 2mo | $379,900 | $209 | 59 |
| 4530 S Shady Lane Ct | 0.49mi | 3/2.0 | 1,710 (-12%) | 1mo | $339,900 | $199 | 54 |
| 2041 W Buena Vista St | 0.41mi | 3/2.0 | 1,663 (-14%) | 1mo | $308,000 | $185 | 54 |
| 4715 S Wildwood Dr | 0.54mi | 4/2.0 (+1) | 2,108 (+9%) | 2mo | $260,000 | $123 | 52 |
| 2482 W Camino Alto St | 0.56mi | 4/2.5 (+1) | 2,200 (+13%) | 0mo | $445,900 | $203 | 46 |
| 2759 W Buena Vista St | 0.68mi | 4/2.0 (+1) | 1,774 (-9%) | 2mo | $234,900 | $132 | 45 |
| 5343 S Twelve Oaks Rd | 0.59mi | 4/2.0 (+1) | 2,179 (+12%) | 2mo | $400,000 | $184 | 43 |
| 2725 W Camino Alto St | 0.69mi | 4/2.0 (+1) | 2,151 (+11%) | 2mo | $255,000 | $119 | 41 |
Match score weights: distance 35% · size 25% · config 20% · recency 20%. Top-matched comps best support the ARV.
Projected returns pro-forma
-3.0% appreciation · 2.53% rent growth · sell at horizon
- IRR
- -16.9%
- Equity multiple
- 0.41×
- Total profit
- $-47,465
- Equity at exit
- $42,494
- IRR
- -9.6%
- Equity multiple
- 0.42×
- Total profit
- $-46,160
- Equity at exit
- $24,642
Cash invested: $79,800 (down + closing). Projections, not guarantees.
Landlord ↔ Tenant lean methodology
- Overall (STATE)
- 81 Strongly Landlord-Friendly
- State Missouri
- 81 Strongly Landlord-Friendly · R+10
- County
- — inherits STATE
- City
- — inherits STATE
ZIP-level market 65810
- Home prices YoY
- -28.8%
- Rents YoY
- 2.5%
- Active inventory
- 250
- Price-to-rent
- 10.8×
Monthly cashflow live
- Estimated rent
- $2,192 high interval (Pro) →
- Mortgage (P&I)
- −$1,495
- Tax from tax record
- −$120 /mo · $1,443/yr
- Insurance
- −$119
- HOA
- −$0
- Vacancy / Maint / Mgmt
- −$460
- Net cashflow
- $-2
Break-even live
UW: 25.0% down · 7.5% · 30yr · 1.5% tax · 5.0% vac · 8.0% maint · 8.0% mgmt
Financing live
Cash to close
- Down payment
- $71,250
- Closing costs
- $8,550
- Reserves months
- —
- Total cash needed
- —
Loan-product check · same deal, 3 products live
Conventional
25% down · 7.5% · 30yr
- Down + closing
- —
- Monthly P&I
- —
- Monthly cashflow
- —
- DSCR
- —
- Eligible?
- —
Personal DTI + credit; lowest rate.
DSCR
20% down · 8.5% · 30yr
- Down + closing
- —
- Monthly P&I
- —
- Monthly cashflow
- —
- DSCR
- —
- Eligible?
- —
No personal income docs; deal must DSCR.
Hard money
10% down · 12.0% · 12mo
- Down + closing
- —
- Monthly P&I
- —
- Monthly cashflow
- —
- DSCR
- —
- Eligible?
- —
Short-term bridge; refi at stabilization.
Rent comps 5 comps
| Address | Beds | Baths | Sqft | Rent | $/sqft | DOM | Units | Dist |
|---|---|---|---|---|---|---|---|---|
| 2183 W Arlington St Springfield, MO | 3.0 | 2.0 | 1850 | $1,995 | $1.08 | 23d | 1 | 0.36mi |
| 2556 W Cardinal St Springfield, MO | 4.0 | 2.0 | 2009 | $2,295 | $1.14 | 13d | 1 | 0.64mi |
| 1504 W High Point Cir Springfield, MO | 3.0 | 2.5 | 2031 | $1,925 | $0.95 | 23d | 1 | 1.11mi |
| 5773 Trailside Cir W Springfield, MO | 2.0–3.0 | 2.0–2.5 | 1688 | $3,195 | $1.89 | 13d | 4 | 1.14mi |
| 1326 W Sackett St Springfield, MO | 2.0 | 2.0 | 1672 | $1,695 | $1.01 | 43d | 1 | 1.28mi |
Listing history 13 events
-
2026-05-04status Pending 851-char remark
Show marketing remark (851 chars)
ONE YEAR HOME WARRANTY PROVIDED BY SELLER!!! This split level home with 3 bedrooms upstairs and a non-conforming bedroom downstairs boasts two spacious living areas with beautifully designed finishes. The master bath has been re-designed with modern tile work in the shower and floors. Complete with new lighting, vanity and mirror with today's buyers in mind. Speaking of flooring, this home is solid surface throughout with tile, vinyl plank and laminate floors for continuity through the whole home. The board and batten word work on the main level and hallway really gives it that rich finish you'll love. Take a trip out back to a great deck that walks down to a patio for summer grilling and a fire pit built into the spacious backyard for evening marsh mellow roasting. Completely ready to move in just put your furnishings in and start living.
-
2026-04-16price $285,000 851-char remark
Show marketing remark (851 chars)
ONE YEAR HOME WARRANTY PROVIDED BY SELLER!!! This split level home with 3 bedrooms upstairs and a non-conforming bedroom downstairs boasts two spacious living areas with beautifully designed finishes. The master bath has been re-designed with modern tile work in the shower and floors. Complete with new lighting, vanity and mirror with today's buyers in mind. Speaking of flooring, this home is solid surface throughout with tile, vinyl plank and laminate floors for continuity through the whole home. The board and batten word work on the main level and hallway really gives it that rich finish you'll love. Take a trip out back to a great deck that walks down to a patio for summer grilling and a fire pit built into the spacious backyard for evening marsh mellow roasting. Completely ready to move in just put your furnishings in and start living.
-
2026-04-02$290,000 Active 851-char remark
Show marketing remark (851 chars)
ONE YEAR HOME WARRANTY PROVIDED BY SELLER!!! This split level home with 3 bedrooms upstairs and a non-conforming bedroom downstairs boasts two spacious living areas with beautifully designed finishes. The master bath has been re-designed with modern tile work in the shower and floors. Complete with new lighting, vanity and mirror with today's buyers in mind. Speaking of flooring, this home is solid surface throughout with tile, vinyl plank and laminate floors for continuity through the whole home. The board and batten word work on the main level and hallway really gives it that rich finish you'll love. Take a trip out back to a great deck that walks down to a patio for summer grilling and a fire pit built into the spacious backyard for evening marsh mellow roasting. Completely ready to move in just put your furnishings in and start living.
-
2026-03-01$299,000 Active
-
2022-05-18soldstatus
-
2022-05-13soldstatus
-
2022-04-02$229,900
-
2018-02-23soldstatus
-
2018-02-23soldstatus
-
2017-12-28$150,000
-
2017-09-28$150,000
-
2006-04-13soldstatus
-
2002-03-19soldstatus
ⓘ Source: listings_history table (triggers on properties + properties_extension) + one-shot
backfill from property_details.listing_events for pre-trigger history.
Tax reassessment forecast MO · Resets to sale price
- Current annual tax
- $1,443 · $120/mo
- Projected year-2 tax
- $2,764 · $230/mo
- Expected delta
- +$1,321/yr (+$110/mo · 91.6%)
ⓘ Screening estimate from a state-policy table — verify with the county assessor before closing.
Climate risk First Street
- Flood 1/10 Low FEMA zone X (unshaded) · 0% chance over 30 yrs
- Wildfire 2/10 Low
- Heat 5/10 Major 7 d/yr ≥105°F today · 19 d/yr by 30 yrs out
- Wind 2/10 Low 0% chance of damaging wind over 30 yrs
- Air quality 1/10 Low 0 unhealthy d/yr today · 0 by 30 yrs out
Nearby sold comps map
Loading sold comps map…
Walkable amenities ~0.75 mi
Loading nearby amenities…
Taxation est. · year 1
- Rental income
- $26,300
- − Mortgage interest
- −$15,964
- − Property taxes
- −$1,443
- − Insurance
- −$1,425
- − Repairs & maintenance
- −$2,104
- − Management
- −$2,104
- − Depreciation
- −$8,291
- Taxable loss
- −$5,032
- Est. tax savings @ 24.0%
- +$1,208
- After-tax cash flow
- $1,181/yr
For passive investors: Depreciation is non-cash, so a rental often shows a tax loss while cash-flowing — sheltering income. Rental losses are passive: they offset passive income freely, and up to $25,000/yr can offset ordinary (W-2) income if you actively participate and your MAGI is under $100k (phasing out to $0 by $150k); unused losses carry forward. On sale, claimed depreciation is recaptured at up to 25%, and gains may owe capital-gains tax (a 1031 exchange can defer both). Figures are a year-1 estimate at your 24.0% rate — not tax advice; consult a CPA.
Schools (NCES district)
- District
- Springfield R-XII
- NCES district ID
- 2928860
- Math proficiency
- 32% ▼ -2.00%
- Reading proficiency
- 46% ▼ -3.00%
- Median HH income
- $37,886
- Composite
- 32.45/100
- National rank
- #5717
- State rank
- #174 of 324 in MO
Livability — Springfield
- Score
- 75/100
- State rank
- #57
- US rank
- #4121
Category grades
Schools grade is shown separately in the Schools card above.
Census & demographics
- County
- Greene County · 244,327 people
- City population
- 223,044
- Metro
- Springfield, MO
- Population (ZIP)
- 22,137
- Household income
- $95,160
- Rent vs Own
- Severe rent burden
- 437.0
Population outlook (Greene County) Hauer SSP2
- Today (2025)
- 319,054 people
- By 2030
- 335,135 · +5.0%
- By 2040
- 366,186 · +14.8%
- By 2050
- 397,431 · +24.6%
- By 2075
- 477,035 · +49.5%
- By 2100
- 520,828 · +63.2%
Race, ethnicity, and origin ACS 2023
- Neighborhood character
- Predominantly White (89%)
- Race & ethnicity
- White 89% Two or more races 4% Hispanic / Latino 3% Asian 3% Black 2%
- Common ancestry
- Italian 4% Lithuanian 3% Portuguese 3%
- Foreign-born
- 4% · Vietnam, China, Canada
- Languages at home
- 95% English-only · Other Indo-European 1% Spanish 1% Chinese 1%
Political lean MEDSL · Greene
- 2024 margin
- Strong R (+20.8) · D 38.9% · R 59.7% · Other 1.4%
- 2008→2024 swing
- -5.0pp toward R · 2008: -15.8pp · 2024: -20.8pp
- All cycles
- 2024: R+20.8 2020: R+20.1 2016: R+27.4 2012: R+24.4 2008: R+15.8
Not yet ingested
- Civics
- —
Market trends
- HPI YoY
- ▼ -78.67%
- Current HPI
- 194.8736
- Rent YoY
- ▲ 2.53%
- Metro
- Springfield, MO
- State GDP YoY
- ▲ 1.84%
- F500 in state
- 20
Industry mix (Fortune 500 HQ in MO)
| Industry | F500 HQs | Revenue |
|---|---|---|
| Healthcare | 1 | $163B |
|
||
| Insurance | 1 | $21B |
|
||
| Industrial Technology | 1 | $17B |
|
||
| Retail | 1 | $16B |
|
||
| Industrial Distribution | 1 | $10B |
|
||
| Utilities | 1 | $9B |
|
||
Price history
+90.0% since first listed13 events — show timeline
- 2026-05-04 Pending — SOMO
- 2026-04-16 Price Changed $285,000 SOMO
- 2026-04-02 Listed $290,000 SOMO
- 2026-03-01 Listed $299,000 SOMO
- 2022-05-18 Sold (Public Records) — Public Records
- 2022-05-13 Sold (MLS) — SOMO
- 2022-04-02 Listed $229,900 SOMO
- 2018-02-23 Sold (Public Records) — Public Records
- 2018-02-23 Sold (MLS) — SOMO
- 2017-12-28 Listed $150,000 SOMO
- 2017-09-28 Listed $150,000 SOMO
- 2006-04-13 Sold (Public Records) — Public Records
- 2002-03-19 Sold (Public Records) — Public Records
Property tax history
+3.2%/yrLatest (2025): $1,443 · +2.3% YoY. Source: county tax records.
Cash-flow waterfall
monthlySold comps — $/sqft
last 12 mo · ≤1 miLoading sold comps…