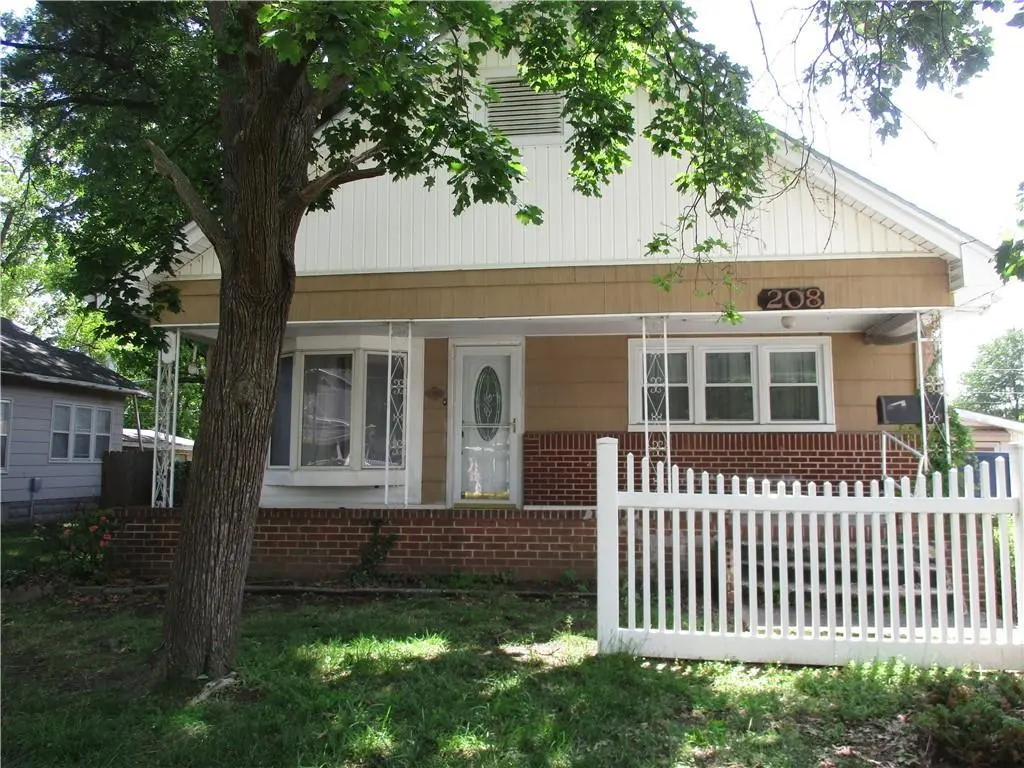
208 E 21st St · Pittsburg, KS
Flood risk 1/10 · Minimal
- FEMA flood zone
- X (unshaded)
- Chance of flooding over 30 yrs
- 0.0%
- Est. flood insurance / yr
- $473 – $860
Fire risk 4/10 · Minor
- Est. fire insurance / yr
- $1,154 – $2,142
Heat risk 5/10 · Moderate
- Hot days now (above 108°F)
- 7 days/yr
- Hot days in 30 yrs
- 19 days/yr
Wind risk 2/10 · Minimal
- Chance of severe wind over 30 yrs
- 2.0%
Air-quality risk 2/10 · Minimal
- Unhealthy air days now
- 1 days/yr
- Unhealthy air days in 30 yrs
- 1 days/yr
Risk factors via First Street. Map © Google.
Why this score? — see what drove the B+ grade
The composite is a weighted blend of 9 inputs, each scored 0–100. Each bar is that input's sub-score; the figure is the points it added to the 100-point composite (weight × sub-score).
- Cash flow +30.0/30.0
- ARV discount +15.0/15.0
- DSCR +10.0/10.0
- 1% rule +9.9/10.0
- Rent growth +5.0/5.0
- Livability +3.3/5.0
- Schools +2.5/10.0
- Condition / age +2.5/5.0
- Appreciation +0.0/10.0
$85,000
🖨 Deal sheet (PDF) 📄 Offer letter ✓ Due diligence
Key facts
- Large living area
- Fenced back yard
- Patio area
Tags
Property features AI
Finance
- HOA & community: No association fees
Exterior
- Parking: Carport; 2-car garage
- Utilities: City/public water (verify); Public sewer
- Home design: Single-family residence; Attached property; Bungalow floor plan; 76–100 years old
- Construction: Shingle siding; Composition roof; Crawl space basement (partial, unfinished)
- Exterior features: Not in a flood plain
Interior
- Kitchen: Dishwasher; Microwave; Refrigerator; Built-in oven
- Bedrooms: 2 bedrooms
- Bathrooms: 1 full bathroom
- Heating & cooling: Natural gas heating; Electric cooling
- Interior features: Dishwasher; Microwave; Refrigerator; Built-in oven
Neighborhood map
What this means for you Summary
Snapshot
- This is a 2-bed/1.0-bath single-family listed at $85k.
Deal economics
- At list price, monthly cash flow is $435 ($5k/yr) — positive.
- The deal already cash-flows at list — no discount required.
- Meets the 1% rule at list price ($1k rent vs $85k).
- Cap rate 12.4% vs local median 5.4% in Pittsburg — top-decile yield for the area; either an underpriced asset or a hidden risk that comps aren't pricing in. Stress-test before assuming the spread holds.
Location & tenants
- Location reads 66/100 on livability (#270 in KS) — a middle-class / working-renter tenant base. Strengths: cost of living A+, housing A, health & safety A; Watch: crime F, amenities F, commute F.
- Pittsburg (town): math 29% / reading 31% proficiency, ranked #111 of 169 in KS (top 66%) — families likely to look elsewhere, expect single-tenant / working-renter base with shorter leases.
- Zoned schools: Pittsburg Middle School (math 28% / reading 26%, grade F, #94 of 219 statewide, top 44%, 720 students, 67% FRL); Pittsburg High (math 27% / reading 32%, grade F, #60 of 327 statewide, top 24%, 1,017 students, 60% FRL).
- Market conditions: Rents rising fast (+13.8%/yr); 142 active listings in the ZIP; 2 comparable units currently listed for rent nearby; 65 units permitted in Crawford County in 2024 (0 in 5+ unit buildings).
- This rent runs 30% of the median local income ($51k/yr) — at the standard rent-burdened threshold; future hikes will face affordability resistance.
Forward outlook
- Local home prices are declining (-3.0%/yr); year-one equity from $588 of loan paydown is wiped out by about $3k of value loss. Plan a longer hold.
- At projected returns (-3.0% appreciation + 8.0% rent growth), your $24k cash investment doubles in ~5 years — after that, you're playing with house money.
Negotiation context
- Only 7 days on market — expect competitive offers; lowballing is unlikely to land.
Risks & watch-outs
- Watch-outs: built in 1930 — expect roof / HVAC / electrical / plumbing capex.
- Climate carrying-cost: extreme-heat days projected 7→19/yr by 2055 (HVAC capex compounding) — expect insurance premiums to compound above CPI over the hold.
Questions for the listing agent
- Built in 1930 — when were the roof, HVAC, electrical panel, plumbing, and water heater last replaced?
- Is there a deadline driving the sale (1031 exchange, divorce, estate, relocation)? That informs how much negotiation room exists.
- Schools are D-rated, which usually means shorter tenancies and higher turnover. Who's the typical renter profile here, and what's been the actual vacancy rate?
- Crime grade is F in this area — have there been break-ins, vandalism, or insurance claims at this property in the last 3 years? What carrier currently insures it and at what premium?
- What's the average days-on-market for RENTAL listings here right now (not sales)? A rising rental-DOM trend means longer vacancies and softer asking-rent achievability than the comps imply.
- What's the recent tenant-quality profile in this submarket — average credit score on applications, eviction rate, late-payment / NSF rate, and stable-employment percentage? A property-management company in the area should have these aggregated.
- How much new for-sale + rental construction is in the pipeline within 1–3 miles? Heavy new supply typically softens prices + rents 12–24 months out; constrained supply supports both.
Investment metrics
- 1% rule
- 1.49% ✓
- Cap rate
- 12.43%
- Cash-on-cash
- 21.93%
- DSCR
- 1.98
- GRM
- 5.6
CMA / ARV
- ARV (median comp)
- $122,993
- List price
- $85,000
- Delta
- -30.89%
- Verdict
- UNDERPRICED
- Comps
- 20 within 1.0 mi
Show comp detail 12 sales within ~0.75 mi
| Address | Dist | Beds/Ba | Sqft | Sold | Price | $/sf | Match |
|---|---|---|---|---|---|---|---|
| 208 E 21st St | 0.00mi | 2/1.0 | 1,588 (0%) | 1mo | $85,000 | $54 | 100 |
| 1603 N Elm St | 0.27mi | 3/1.0 (+1) | 1,540 (-3%) | 14mo | $148,500 | $96 | 66 |
| 1812 N Locust St | 0.13mi | 3/2.5 (+1) | 1,612 (+2%) | 17mo | $197,500 | $123 | 66 |
| 1407 N Broadway St | 0.44mi | 2/2.0 | 1,440 (-9%) | 0mo | $91,500 | $64 | 60 |
| 217 W 23rd St | 0.41mi | 2/2.0 | 1,512 (-5%) | 13mo | $115,000 | $76 | 58 |
| 113 E 14th St | 0.42mi | 3/2.0 (+1) | 1,604 (+1%) | 15mo | $149,900 | $93 | 58 |
| 1604 N Elm N/A | 0.28mi | 3/2.0 (+1) | 1,486 (-6%) | 14mo | $140,000 | $94 | 56 |
| 126 E 23rd St | 0.14mi | 3/1.0 (+1) | 1,398 (-12%) | 16mo | $134,000 | $96 | 55 |
| 1811 N Locust St | 0.15mi | 3/1.0 (+1) | 1,360 (-14%) | 14mo | $132,000 | $97 | 53 |
| 604 E 13th St | 0.57mi | 3/2.0 (+1) | 1,576 (-1%) | 19mo | $170,000 | $108 | 47 |
| 1603 N Joplin St | 0.29mi | 3/1.0 (+1) | 1,376 (-13%) | 15mo | $122,500 | $89 | 47 |
| 121 W 25th N/A | 0.42mi | 3/2.0 (+1) | 1,802 (+14%) | 9mo | $189,900 | $105 | 41 |
Match score weights: distance 35% · size 25% · config 20% · recency 20%. Top-matched comps best support the ARV.
Projected returns pro-forma
-3.0% appreciation · 8.0% rent growth · sell at horizon
- IRR
- 20.1%
- Equity multiple
- 1.87×
- Total profit
- $20,635
- Equity at exit
- $12,674
- IRR
- 31.5%
- Equity multiple
- 4.54×
- Total profit
- $84,167
- Equity at exit
- $7,349
Cash invested: $23,800 (down + closing). Projections, not guarantees.
Landlord ↔ Tenant lean methodology
- Overall (STATE)
- 83 Strongly Landlord-Friendly
- State Kansas
- 83 Strongly Landlord-Friendly · R+10
- County
- — inherits STATE
- City
- — inherits STATE
ZIP-level market 66762
- Rents YoY
- 13.8%
- Active inventory
- 142
- Price-to-rent
- 5.6×
Monthly cashflow live
- Estimated rent
- $1,268 medium interval (Pro) →
- Mortgage (P&I)
- −$446
- Tax from tax record
- −$86 /mo · $1,029/yr
- Insurance
- −$35
- HOA
- −$0
- Vacancy / Maint / Mgmt
- −$266
- Net cashflow
- $435
Break-even live
Sensitivity live
| Price | -10% $483 | -5% $459 | +0% $435 | +5% $411 | +10% $387 |
|---|---|---|---|---|---|
| Rent | -10% $335 | -5% $385 | +0% $435 | +5% $485 | +10% $535 |
| Rate | -1.0pp $478 | -0.5pp $457 | base $435 | +0.5pp $413 | +1.0pp $390 |
UW: 25.0% down · 7.5% · 30yr · 1.5% tax · 5.0% vac · 8.0% maint · 8.0% mgmt
Financing live
Cash to close
- Down payment
- $21,250
- Closing costs
- $2,550
- Reserves months
- —
- Total cash needed
- —
Loan-product check · same deal, 3 products live
Conventional
25% down · 7.5% · 30yr
- Down + closing
- —
- Monthly P&I
- —
- Monthly cashflow
- —
- DSCR
- —
- Eligible?
- —
Personal DTI + credit; lowest rate.
DSCR
20% down · 8.5% · 30yr
- Down + closing
- —
- Monthly P&I
- —
- Monthly cashflow
- —
- DSCR
- —
- Eligible?
- —
No personal income docs; deal must DSCR.
Hard money
10% down · 12.0% · 12mo
- Down + closing
- —
- Monthly P&I
- —
- Monthly cashflow
- —
- DSCR
- —
- Eligible?
- —
Short-term bridge; refi at stabilization.
Rent comps 2 comps
| Address | Beds | Baths | Sqft | Rent | $/sqft | DOM | Units | Dist |
|---|---|---|---|---|---|---|---|---|
| 544 E 23rd St Pittsburg, KS | 3.0 | 2.0 | 1190 | $1,800 | $1.51 | 45d | 1 | 0.36mi |
| 1019 E 15th St Pittsburg, KS | 3.0 | 1.0 | 1222 | $1,050 | $0.86 | 45d | 1 | 0.87mi |
Listing history 2 events
-
2026-05-06status Pending 380-char remark
-
2026-04-29$85,000 Active 380-char remark
ⓘ Source: listings_history table (triggers on properties + properties_extension) + one-shot
backfill from property_details.listing_events for pre-trigger history.
Tax reassessment forecast KS · Resets to sale price
- Current annual tax
- $1,029 · $86/mo
- Projected year-2 tax
- $1,198 · $100/mo
- Expected delta
- +$170/yr (+$14/mo · 16.5%)
ⓘ Screening estimate from a state-policy table — verify with the county assessor before closing.
Climate risk First Street
- Flood 1/10 Low FEMA zone X (unshaded) · 0% chance over 30 yrs
- Wildfire 4/10 Moderate
- Heat 5/10 Major 7 d/yr ≥108°F today · 19 d/yr by 30 yrs out
- Wind 2/10 Low 2% chance of damaging wind over 30 yrs
- Air quality 2/10 Low 1 unhealthy d/yr today · 1 by 30 yrs out
Nearby sold comps map
Loading sold comps map…
Walkable amenities ~0.75 mi
Loading nearby amenities…
Taxation est. · year 1
- Rental income
- $15,218
- − Mortgage interest
- −$4,761
- − Property taxes
- −$1,029
- − Insurance
- −$425
- − Repairs & maintenance
- −$1,217
- − Management
- −$1,217
- − Depreciation
- −$2,473
- Taxable income
- $4,095
- Est. tax owed @ 24.0%
- −$983
- After-tax cash flow
- $4,236/yr
For passive investors: Depreciation is non-cash, so a rental often shows a tax loss while cash-flowing — sheltering income. Rental losses are passive: they offset passive income freely, and up to $25,000/yr can offset ordinary (W-2) income if you actively participate and your MAGI is under $100k (phasing out to $0 by $150k); unused losses carry forward. On sale, claimed depreciation is recaptured at up to 25%, and gains may owe capital-gains tax (a 1031 exchange can defer both). Figures are a year-1 estimate at your 24.0% rate — not tax advice; consult a CPA.
Schools (NCES district)
- District
- Pittsburg
- NCES district ID
- 2010710
- Math proficiency
- 29% ▼ -5.00%
- Reading proficiency
- 31% ▼ -4.00%
- Median HH income
- $33,608
- Composite
- 24.63/100
- National rank
- #7629
- State rank
- #111 of 169 in KS
Livability — Pittsburg
- Score
- 66/100
- State rank
- #270
- US rank
- #12149
Category grades
Schools grade is shown separately in the Schools card above.
Census & demographics
- Census place
- Pittsburg, KS
- County
- Crawford County · 24,907 people
- City population
- 24,907
- Metro
- Pittsburg, KS
- Population (ZIP)
- 24,907
- Household income
- $50,511
- Rent vs Own
- Severe rent burden
- 1186.0
Population outlook (Crawford County) Hauer SSP2
- Today (2025)
- 39,393 people
- By 2030
- 39,540 · +0.4%
- By 2040
- 39,452 · +0.1%
- By 2050
- 39,188 · -0.5%
- By 2075
- 39,038 · -0.9%
- By 2100
- 38,219 · -3.0%
Race, ethnicity, and origin ACS 2023
- Neighborhood character
- Predominantly White (80%)
- Race & ethnicity
- White 80% Hispanic / Latino 10% Two or more races 5% Asian 2% Black 2%
- Hispanic origin (detail)
- Mexican 7%
- Common ancestry
- Slovak 2% Lithuanian 2% Italian 2%
- Foreign-born
- 5% · Canada, China
- Languages at home
- 92% English-only · Spanish 6% Other Asian/Pacific 1%
Political lean MEDSL · Crawford
- 2024 margin
- Strong R (+25.3) · D 36.5% · R 61.7% · Other 1.8%
- 2008→2024 swing
- -26.7pp toward R · 2008: 1.4pp · 2024: -25.3pp
- All cycles
- 2024: R+25.3 2020: R+23.1 2016: R+23.1 2012: R+6.5 2008: D+1.4
Not yet ingested
- Civics
- —
Market trends
- HPI YoY
- ▼ -171.14%
- Current HPI
- 158.7878
- Rent YoY
- ▲ 13.80%
- Metro
- Pittsburg, KS
- State GDP YoY
- —
- F500 in state
- 0
Price history
3 events — show timeline
- 2026-06-05 Sold (MLS) — Heartland MLS as Distributed by MLS Grid
- 2026-05-06 Pending — Heartland MLS as Distributed by MLS Grid
- 2026-04-29 Listed $85,000 Heartland MLS as Distributed by MLS Grid
Property tax history
+1.4%/yrLatest (2025): $1,029 · +7.4% YoY. Source: county tax records.
Cash-flow waterfall
monthlySold comps — $/sqft
last 12 mo · ≤1 miLoading sold comps…