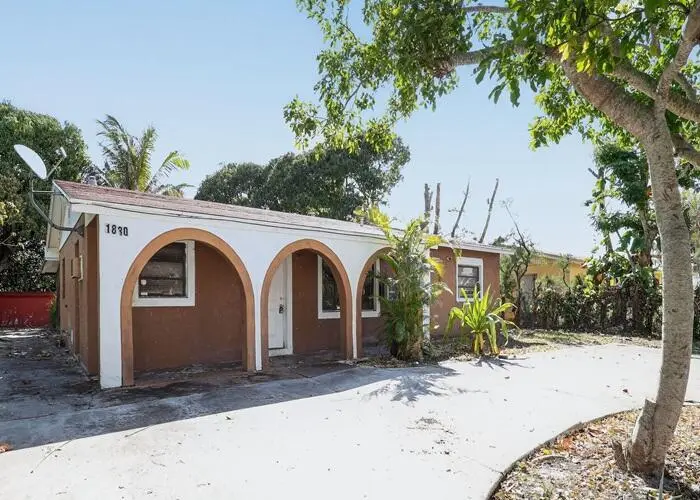
1830 NE 2nd Ln · Boynton Beach, FL
Flood risk 1/10 · Minimal
- FEMA flood zone
- X (unshaded)
- Chance of flooding over 30 yrs
- 0.0%
- Est. flood insurance / yr
- $507 – $1,088
Fire risk 1/10 · Minimal
- Est. fire insurance / yr
- $947 – $1,759
Heat risk 10/10 · Severe
- Hot days now (above 105°F)
- 7 days/yr
- Hot days in 30 yrs
- 28 days/yr
Wind risk 10/10 · Severe
- Chance of severe wind over 30 yrs
- 99.0%
Air-quality risk 2/10 · Minimal
- Unhealthy air days now
- 1 days/yr
- Unhealthy air days in 30 yrs
- 2 days/yr
Risk factors via First Street. Map © Google.
Why this score? — see what drove the D grade
The composite is a weighted blend of 9 inputs, each scored 0–100. Each bar is that input's sub-score; the figure is the points it added to the 100-point composite (weight × sub-score).
- Cash flow +13.9/30.0
- ARV discount +7.5/15.0
- 1% rule +4.3/10.0
- Schools +4.3/10.0
- DSCR +4.2/10.0
- Livability +3.6/5.0
- Rent growth +3.4/5.0
- Condition / age +2.5/5.0
- Appreciation +0.0/10.0
$266,100
🖨 Deal sheet (PDF) 📄 Offer letter ✓ Due diligence
Listing remarks
This 3 bed, 1 bath ranch home is your perfect opportunity for a first home or income earner. The open layout offers a living room, and an eat in kitchen. Home sits on a large, fenced lot with a covered front porch and rear patio. Updates and renovations are needed to restore this gem. Property is sold as-is with NO property disclosure or inspection reports, NO HOA. Make this your next project.
Key facts
- Covered front porch
- Open layout
- Rear patio
Tags
Neighborhood map
What this means for you Summary
Snapshot
- This is a 3-bed/1.0-bath single-family listed at $266k.
Deal economics
- At list price, monthly cash flow is $30 ($366/yr) — positive.
- The deal already cash-flows at list — no discount required.
- To meet the 1% rule (rent ≥ 1% of price), the offer needs to be $248k (6.9% below list).
- Recommended offer: $248k (6.9% below list) — sets the bar for 1% rule.
- Cap rate 6.4% vs local median 4.3% in Boynton Beach — top-decile yield for the area; either an underpriced asset or a hidden risk that comps aren't pricing in. Stress-test before assuming the spread holds.
Location & tenants
- Location reads 72/100 on livability (#351 in FL) — a middle-class / working-renter tenant base. Strengths: housing A+, health & safety B+, cost of living B; Watch: amenities D+, crime D-, commute F.
- Palm Beach (suburban): math 46% / reading 53% proficiency, ranked #34 of 73 in FL (top 47%) — families likely to look elsewhere, expect single-tenant / working-renter base with shorter leases.
- Zoned schools: Freedom Shores Elementary School (math 38% / reading 41%, grade F, #1,513 of 2,144 statewide, top 73%, 677 students, 69% FRL); Boynton Beach Community High (math 13% / reading 25%, grade F, #565 of 667 statewide, top 85%, 1,547 students, 65% FRL) — zoned schools average 67% FRL vs 52% district-wide (15 pts higher); higher-poverty schools than district average — tighter screening recommended.
- Zoned-school proficiency averages 29% at this address vs 50% district-wide (-20 pts) — the specific schools serving this property underperform the Palm Beach average; the district grade overstates school quality for this exact location.
- Market conditions: Rents rising (+3.6%/yr); 539 active listings in the ZIP; 40 comparable units currently listed for rent nearby; rentals at typical pace (median 21d on market — plan ~3-4 weeks tenant-placement turnaround); 3,974 units permitted in Palm Beach County in 2024 (1,012 in 5+ unit buildings).
- This rent runs 44% of the median local income ($68k/yr) — at the standard rent-burdened threshold; future hikes will face affordability resistance.
Forward outlook
- Local home prices are declining (-3.0%/yr); year-one equity from $2k of loan paydown is wiped out by about $8k of value loss. Plan a longer hold.
- Palm Beach County population projected at +30% by 2050 — long-run rental-demand tailwind backs the buy-and-hold thesis.
Negotiation context
- It's been on market 36 days — a 3% lower offer ($258k) is reasonable based on typical stale-listing flexibility.
- 3 sale attempts since 4y ago with the ask held roughly flat each time — persistent listings suggest the price (not the market) is what's stuck; bring a comps-based counter.
Risks & watch-outs
- Climate carrying-cost: severe wind risk, 99% chance of damaging wind over 30y; extreme-heat days projected 7→28/yr by 2055 (HVAC capex compounding) — expect insurance premiums to compound above CPI over the hold.
Questions for the listing agent
- It's been on market 36 days. Have you received any prior offers? Is the seller open to a 7% concession, seller financing, or rate buy-down credit?
- Built in 1973 — when were the roof, HVAC, electrical panel, plumbing, and water heater last replaced?
- Is there a deadline driving the sale (1031 exchange, divorce, estate, relocation)? That informs how much negotiation room exists.
- Crime grade is D in this area — have there been break-ins, vandalism, or insurance claims at this property in the last 3 years? What carrier currently insures it and at what premium?
- The area grade is low — what's the realistic commute time and amenity access for the typical tenant pool here? Any planned neighborhood developments (good or bad) we should know about?
- What's the average days-on-market for RENTAL listings here right now (not sales)? A rising rental-DOM trend means longer vacancies and softer asking-rent achievability than the comps imply.
- What's the recent tenant-quality profile in this submarket — average credit score on applications, eviction rate, late-payment / NSF rate, and stable-employment percentage? A property-management company in the area should have these aggregated.
- How much new for-sale + rental construction is in the pipeline within 1–3 miles? Heavy new supply typically softens prices + rents 12–24 months out; constrained supply supports both.
Investment metrics
- 1% rule
- 0.93% ✗
- Cap rate
- 6.43%
- Cash-on-cash
- 0.49%
- DSCR
- 1.02
- GRM
- 9.0
CMA / ARV
No comps found within radius.
Projected returns pro-forma
-3.0% appreciation · 3.64% rent growth · sell at horizon
- IRR
- -14.7%
- Equity multiple
- 0.47×
- Total profit
- $-39,484
- Equity at exit
- $39,676
- IRR
- -4.9%
- Equity multiple
- 0.67×
- Total profit
- $-24,844
- Equity at exit
- $23,007
Cash invested: $74,508 (down + closing). Projections, not guarantees.
Landlord ↔ Tenant lean methodology
- Overall (STATE)
- 87 Strongly Landlord-Friendly
- State Florida
- 87 Strongly Landlord-Friendly · R+3
- County
- — inherits STATE
- City
- — inherits STATE
ZIP-level market 33435
- Rents YoY
- 3.6%
- Active inventory
- 539
- Price-to-rent
- 9.0×
Monthly cashflow live
- Estimated rent
- $2,476 high interval (Pro) →
- Mortgage (P&I)
- −$1,395
- Tax from tax record
- −$419 /mo · $5,033/yr
- Insurance
- −$111
- HOA
- −$0
- Vacancy / Maint / Mgmt
- −$520
- Net cashflow
- $30
Break-even live
Sensitivity live
| Price | -10% $181 | -5% $106 | +0% $30 | +5% $-45 | +10% $-120 |
|---|---|---|---|---|---|
| Rent | -10% $-165 | -5% $-67 | +0% $30 | +5% $128 | +10% $226 |
| Rate | -1.0pp $164 | -0.5pp $98 | base $30 | +0.5pp $-38 | +1.0pp $-109 |
UW: 25.0% down · 7.5% · 30yr · 1.5% tax · 5.0% vac · 8.0% maint · 8.0% mgmt
Financing live
Cash to close
- Down payment
- $66,525
- Closing costs
- $7,983
- Reserves months
- —
- Total cash needed
- —
Loan-product check · same deal, 3 products live
Conventional
25% down · 7.5% · 30yr
- Down + closing
- —
- Monthly P&I
- —
- Monthly cashflow
- —
- DSCR
- —
- Eligible?
- —
Personal DTI + credit; lowest rate.
DSCR
20% down · 8.5% · 30yr
- Down + closing
- —
- Monthly P&I
- —
- Monthly cashflow
- —
- DSCR
- —
- Eligible?
- —
No personal income docs; deal must DSCR.
Hard money
10% down · 12.0% · 12mo
- Down + closing
- —
- Monthly P&I
- —
- Monthly cashflow
- —
- DSCR
- —
- Eligible?
- —
Short-term bridge; refi at stabilization.
Rent comps 40 comps
| Address | Beds | Baths | Sqft | Rent | $/sqft | DOM | Units | Dist |
|---|---|---|---|---|---|---|---|---|
| 311 NE 17th Ave #204 Boynton Beach, FL | 2.0 | 2.0 | 1100 | $1,650 | $1.50 | 26d | 1 | 0.09mi |
| 151 NE 17th Ave Boynton Beach, FL | 4.0 | 2.0 | 1056 | $3,000 | $2.84 | 26d | 1 | 0.10mi |
| 306 Circle Dr S #104 Boynton Beach, FL | 2.0 | 2.0 | 1150 | $2,100 | $1.83 | 7d | 1 | 0.13mi |
| 410 NE 17th Ave #101 Boynton Beach, FL | 2.0 | 1.5 | 1080 | $1,500 | $1.39 | 9d | 1 | 0.15mi |
| 108 NE 20th Ave #206 Boynton Beach, FL | 2.0 | 2.0 | 860 | $1,800 | $2.09 | 21d | 1 | 0.17mi |
| 2122 NE 1st St Boynton Beach, FL | 2.0 | 1.0 | 1362 | $2,300 | $1.69 | 13d | 1 | 0.21mi |
| 2202 NE 3rd St Boynton Beach, FL | 3.0 | 2.0 | 902 | $3,000 | $3.33 | 18d | 1 | 0.29mi |
| 2202 NE 4th St #10 Boynton Beach, FL | 2.0 | 1.0 | 757 | $1,900 | $2.51 | 4d | 1 | 0.37mi |
| 2100 N Seacrest Blvd Boynton Beach, FL | 3.0 | 1.0 | 1056 | $2,900 | $2.75 | 18d | 1 | 0.39mi |
| 1601 NW 3rd Ln Boynton Beach, FL | 4.0 | 2.0 | 1235 | $3,500 | $2.83 | 17d | 1 | 0.43mi |
| 1601 NW 3rd Ln Boynton Beach, FL | 4.0 | 2.0 | 1235 | $3,500 | $2.83 | 18d | 1 | 0.43mi |
| 2008 S Federal Hwy Unit C207 Boynton Beach, FL | 2.0 | 2.0 | 963 | $2,000 | $2.08 | 26d | 1 | 0.44mi |
| 27 Crossings Cir Unit H Boynton Beach, FL | 2.0 | 2.0 | 864 | $1,900 | $2.20 | 16d | 1 | 0.45mi |
| 30 Crossings Cir Unit H Boynton Beach, FL | 2.0 | 2.0 | 864 | $2,400 | $2.78 | 20d | 1 | 0.47mi |
| 640 Oak St Boynton Beach, FL | 2.0 | 1.0 | 765 | $2,690 | $3.52 | 9d | 1 | 0.48mi |
| 24 Crossings Cir Unit H Boynton Beach, FL | 2.0 | 2.0 | 864 | $2,050 | $2.37 | 26d | 1 | 0.49mi |
| 2601 3rd Ct NE #202 Boynton Beach, FL | 2.0 | 2.0 | 982 | $1,500 | $1.53 | 20d | 1 | 0.50mi |
| 1411 NW 3rd St Boynton Beach, FL | 3.0 | 2.0 | 1219 | $2,181 | $1.79 | 9d | 1 | 0.50mi |
| 2515 NE 2nd Ct #202 Boynton Beach, FL | 2.0 | 2.0 | 960 | $1,499 | $1.56 | 26d | 1 | 0.51mi |
| 1632 N Federal Hwy Boynton Beach, FL | 1.0–3.0 | 1.0–2.0 | 1098 | $3,065 | $2.79 | 0d | 19 | 0.52mi |
| 2615 NE 3rd Ct #4030 Boynton Beach, FL | 2.0 | 2.0 | 960 | $1,699 | $1.77 | 6d | 1 | 0.54mi |
| 336 NE 12th Ave Boynton Beach, FL | 3.0 | 2.0 | 1040 | $2,500 | $2.40 | 9d | 1 | 0.55mi |
| 2615 NE 1st Ct #403 Boynton Beach, FL | 2.0 | 2.0 | 960 | $2,100 | $2.19 | 26d | 1 | 0.55mi |
| 2615 NE 1st Ct Boynton Beach, FL | 2.0 | 2.0 | 960 | $1,850 | $1.93 | 20d | 2 | 0.55mi |
| 2600 NE 1st Ln #418 Boynton Beach, FL | 2.0 | 2.0 | 1182 | $1,750 | $1.48 | 26d | 1 | 0.57mi |
| 17 Crossings Cir Unit E Boynton Beach, FL | 2.0 | 2.0 | 864 | $1,900 | $2.20 | 26d | 1 | 0.57mi |
| 1820 New Palm Way #201 Boynton Beach, FL | 2.0 | 2.0 | 873 | $3,500 | $4.01 | 26d | 1 | 0.58mi |
| 300 NE 26th Ave #1040 Boynton Beach, FL | 2.0 | 2.0 | 1080 | $1,559 | $1.44 | 26d | 1 | 0.59mi |
| 230 NE 26th Ave Boynton Beach, FL | 1.0–2.0 | 1.5–2.0 | 857 | $1,650 | $1.93 | 19d | 2 | 0.61mi |
| 2639 NE 4th St Boynton Beach, FL | 3.0 | 2.0 | 1300 | $2,895 | $2.23 | 7d | 1 | 0.61mi |
| 130 NE 26th Ave #307 Boynton Beach, FL | 2.0 | 2.0 | 982 | $3,500 | $3.56 | 26d | 1 | 0.62mi |
| 14 Crossings Cir Unit E Boynton Beach, FL | 2.0 | 2.0 | 953 | $2,300 | $2.41 | 26d | 1 | 0.62mi |
| 430 NW 13th Ave Boynton Beach, FL | 3.0 | 2.5 | 1229 | $3,000 | $2.44 | 15d | 1 | 0.63mi |
| 432 NW 13th Ave Boynton Beach, FL | 3.0 | 2.5 | 1229 | $3,000 | $2.44 | 15d | 1 | 0.63mi |
| 149 Harbors Way Boynton Beach, FL | 3.0 | 2.5 | 1499 | $5,100 | $3.40 | 22d | 1 | 0.64mi |
| 7 Crossings Cir Boynton Beach, FL | 2.0 | 1.5 | 864 | $2,500 | $2.89 | 26d | 1 | 0.65mi |
| 4 Crossings Cir Unit B Boynton Beach, FL | 2.0 | 1.5 | 864 | $1,950 | $2.26 | 26d | 1 | 0.68mi |
| 519 Martin Luther King Junior Blvd Unit B Boynton Beach, FL | 2.0 | 1.0 | 800 | $1,950 | $2.44 | 26d | 1 | 0.76mi |
| 8076 Ambach Way Hypoluxo, FL | 2.0 | 2.0 | 1243 | $2,200 | $1.77 | 26d | 1 | 0.77mi |
| 806 NW 1st St Boynton Beach, FL | 3.0 | 2.0 | 1169 | $3,500 | $2.99 | 21d | 1 | 0.77mi |
Listing history 7 events
-
2026-04-21status Pending
-
2025-11-12$266,100 Active
-
2025-09-17$5,000 Active
-
2022-05-30status Pending
-
2022-02-21historical
-
2022-02-21historical
-
2022-02-16$225,000 Active
ⓘ Source: listings_history table (triggers on properties + properties_extension) + one-shot
backfill from property_details.listing_events for pre-trigger history.
Tax reassessment forecast FL · Resets to sale price
- Current annual tax
- $5,033 · $419/mo
- Projected year-2 tax
- $5,033 · $419/mo
- Expected delta
- $0/yr ($0/mo · 0.0%)
ⓘ Screening estimate from a state-policy table — verify with the county assessor before closing.
Climate risk First Street
- Flood 1/10 Low FEMA zone X (unshaded) · 0% chance over 30 yrs
- Wildfire 1/10 Low
- Heat 10/10 Extreme 7 d/yr ≥105°F today · 28 d/yr by 30 yrs out
- Wind 10/10 Extreme 99% chance of damaging wind over 30 yrs
- Air quality 2/10 Low 1 unhealthy d/yr today · 2 by 30 yrs out
Nearby sold comps map
Loading sold comps map…
Walkable amenities ~0.75 mi
Loading nearby amenities…
Taxation est. · year 1
- Rental income
- $29,715
- − Mortgage interest
- −$14,906
- − Property taxes
- −$5,033
- − Insurance
- −$1,330
- − Repairs & maintenance
- −$2,377
- − Management
- −$2,377
- − Depreciation
- −$7,741
- Taxable loss
- −$4,050
- Est. tax savings @ 24.0%
- +$972
- After-tax cash flow
- $1,338/yr
For passive investors: Depreciation is non-cash, so a rental often shows a tax loss while cash-flowing — sheltering income. Rental losses are passive: they offset passive income freely, and up to $25,000/yr can offset ordinary (W-2) income if you actively participate and your MAGI is under $100k (phasing out to $0 by $150k); unused losses carry forward. On sale, claimed depreciation is recaptured at up to 25%, and gains may owe capital-gains tax (a 1031 exchange can defer both). Figures are a year-1 estimate at your 24.0% rate — not tax advice; consult a CPA.
Schools (NCES district)
- District
- Palm Beach
- NCES district ID
- 1201500
- Math proficiency
- 46% ▼ -16.00%
- Reading proficiency
- 53% ▼ -4.00%
- Median HH income
- $53,943
- Composite
- 42.72/100
- National rank
- #3160
- State rank
- #34 of 73 in FL
Livability — Boynton Beach
- Score
- 72/100
- State rank
- #351
- US rank
- #6098
Category grades
Schools grade is shown separately in the Schools card above.
Census & demographics
- Census place
- Boynton Beach, FL
- County
- Palm Beach County · 1,438,312 people
- City population
- 148,060
- Metro
- Miami-Fort Lauderdale-Pompano Beach, FL
- Population (ZIP)
- 37,833
- Household income
- $67,979
- Rent vs Own
- Severe rent burden
- 1623.0
Population outlook (Palm Beach County) Hauer SSP2
- Today (2025)
- 1,637,487 people
- By 2030
- 1,743,255 · +6.5%
- By 2040
- 1,948,712 · +19.0%
- By 2050
- 2,132,979 · +30.3%
- By 2075
- 2,530,027 · +54.5%
- By 2100
- 2,706,979 · +65.3%
Race, ethnicity, and origin ACS 2023
- Neighborhood character
- Diverse neighborhood (Simpson 0.65)
- Race & ethnicity
- White 41% Black 40% Hispanic / Latino 15% Two or more races 10%
- Hispanic origin (detail)
- Mexican 3% Puerto Rican 3% Cuban 2% Dominican 1%
- Common ancestry
- Hispanic 23% Romanian 2% Lithuanian 2%
- Foreign-born
- 30% · Canada, Jamaica
- Languages at home
- 61% English-only · French/Haitian/Cajun 24% Spanish 11% Other Indo-European 2%
Political lean MEDSL · Palm Beach
- 2024 margin
- Toss-up / Even · D 50.0% · R 49.2%
- 2008→2024 swing
- -22.1pp toward R · 2008: 22.9pp · 2024: 0.8pp
- All cycles
- 2024: D+0.8 2020: D+12.8 2016: D+15.3 2012: D+17.0 2008: D+22.9
Not yet ingested
- Civics
- —
Market trends
- HPI YoY
- ▼ -345.86%
- Current HPI
- 371.0527
- Rent YoY
- ▲ 3.64%
- Metro
- Miami-Fort Lauderdale-Pompano Beach, FL
- State GDP YoY
- ▲ 3.28%
- F500 in state
- 36
Industry mix (Fortune 500 HQ in FL)
| Industry | F500 HQs | Revenue |
|---|---|---|
| Industrial Technology | 2 | $29B |
|
||
| Insurance | 2 | $17B |
|
||
| Retail | 1 | $60B |
|
||
| Technology Distribution | 1 | $58B |
|
||
| Homebuilding | 1 | $35B |
|
||
| Technology Manufacturing | 1 | $35B |
|
||
Price history
+18.3% since first listed7 events — show timeline
- 2026-04-21 Pending — Beaches MLS
- 2025-11-12 Listed $266,100 Beaches MLS
- 2025-09-17 Listed $5,000 NFMLS
- 2022-05-30 Pending — Beaches MLS
- 2022-02-21 Listing Removed — Beaches MLS
- 2022-02-21 Listing Removed — Beaches MLS
- 2022-02-16 Listed $225,000 Beaches MLS
Property tax history
+21.2%/yrLatest (2025): $5,033 · +6.6% YoY. Source: county tax records.
Cash-flow waterfall
monthlySold comps — $/sqft
last 12 mo · ≤1 miLoading sold comps…