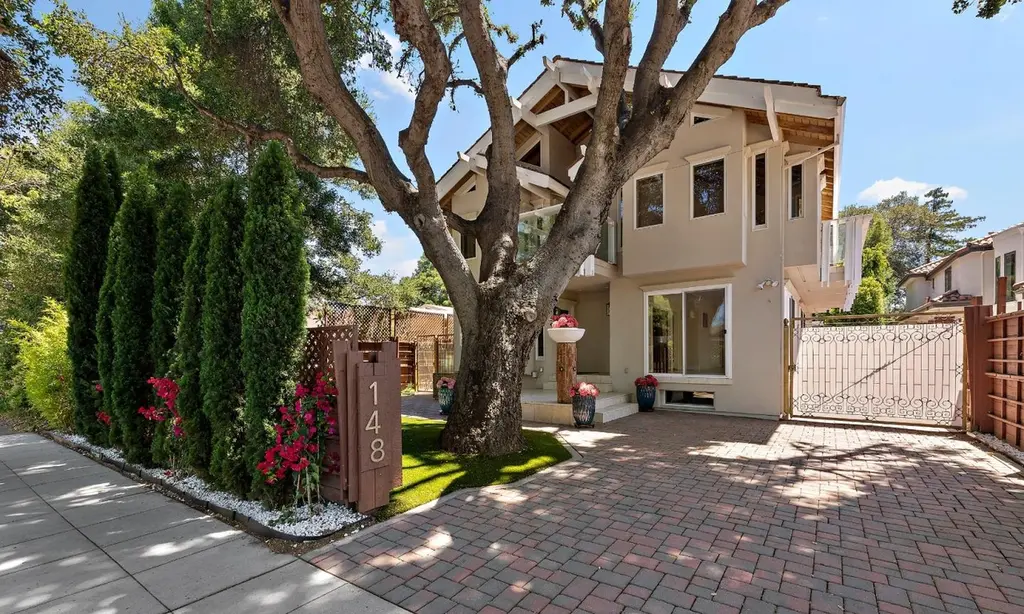
148 Kingsley Ave · Palo Alto, CA
Flood risk 3/10 · Minor
- FEMA flood zone
- X (shaded)
- Chance of flooding over 30 yrs
- 0.17%
- Est. flood insurance / yr
- $507 – $1,088
Fire risk 1/10 · Minimal
- Est. fire insurance / yr
- $659 – $1,223
Heat risk 3/10 · Minor
- Hot days now (above 92°F)
- 7 days/yr
- Hot days in 30 yrs
- 14 days/yr
Wind risk 1/10 · Minimal
- Chance of severe wind over 30 yrs
- —
Air-quality risk 7/10 · Major
- Unhealthy air days now
- 12 days/yr
- Unhealthy air days in 30 yrs
- 12 days/yr
Risk factors via First Street. Map © Google.
Why this score? — see what drove the D- grade
The composite is a weighted blend of 9 inputs, each scored 0–100. Each bar is that input's sub-score; the figure is the points it added to the 100-point composite (weight × sub-score).
- ARV discount +15.0/15.0
- Schools +7.4/10.0
- Appreciation +5.5/10.0
- Rent growth +4.3/5.0
- Livability +4.2/5.0
- Condition / age +2.5/5.0
- Cash flow +0.0/30.0
- 1% rule +0.0/10.0
- DSCR +0.0/10.0
$5,495,000
🖨 Deal sheet 📄 Offer letter ✓ Due diligence
Listing remarks MLS
Imagine the possibilities! Such a special fairytale jewel box home on one of Palo Alto's most coveted streets Kingsley in old Palo Alto. Freshened up with gorgeous new colorful landscaping, fresh new turf in front and back yards, new paint in the main home, come see this enchanting estate that is walking distance to all that makes Palo Alto special. Walk or bike to Stanford, town and country shopping plaza, Elizabeth gamble garden etc. Featuring three separate structures, the entire home was lovingly designed and built by the current owner for his family. Gorgeous oak floors and warm inviting rooms, included a marble tile sunroom offer special places for friends and family to gather. The back cottage and detached garage/office space provide ample living area for visiting friends or extended family. You can't miss this special home!
Key facts
- Marble tile sunroom
- Back cottage
- New turf
Tags
Property features AI
Finance
- Other: Living area approximately 4,060
Exterior
- Parking: Detached 3-car garage
- Utilities: Public water; Public sewer; Public utilities
- Home design: Detached property; 3 stories
- Construction: Other foundation
- Exterior features: Wood shakes/shingles roof; R1 zoning
Interior
- Bedrooms: 7 bedrooms
- Bathrooms: 6 full baths; 2 half baths
- Heating & cooling: Central forced air heating; Central forced air cooling
- Interior features: Separate family room; Dining area; Has fireplace (see remarks)
Neighborhood map
What this means for you Summary
Snapshot
- This is a 7-bed/8.0-bath single-family listed at $5.50M.
Deal economics
- At list price, monthly cash flow is $-28k ($-332k/yr) — negative.
- To cash-flow at today's rent, offer at most $605k (89.0% below list).
- To meet the 1% rule (rent ≥ 1% of price), the offer needs to be $695k (87.3% below list).
- Recommended offer: $605k (89.0% below list) — sets the bar for cash-flow.
- Cap rate 0.2% vs local median 0.4% in Palo Alto — below-typical yield; the buyer is paying a premium for something (appreciation thesis, condition, location) that the cap rate doesn't capture.
Location & tenants
- Location reads 84/100 on livability (#19 in CA, #821 nationally) — a professional / high-income tenant draw. Strengths: amenities A+, commute A+, employment A+; Watch: cost of living F.
- Palo Alto Unified (urban): math 79% / reading 80% proficiency, ranked #19 of 517 in CA (top 4%) — strong family-tenant draw, lease renewals of 3-5y typical; only 7% free/reduced lunch — higher-income household profile.
- Zoned schools: Walter Hays Elementary (math 72% / reading 72%, grade A-, #122 of 1,571 statewide, top 8%, 294 students, 17% FRL); Palo Alto High (math 87% / reading 87%, grade A, #21 of 1,170 statewide, top 2%, 1,992 students, 10% FRL).
- Market conditions: Rents rising fast (+7.4%/yr); 34 active listings in the ZIP; high-income renter base; 3,838 units permitted in Santa Clara County in 2024 (1,886 in 5+ unit buildings).
- This rent runs 34% of the median local income ($242k/yr) — at the standard rent-burdened threshold; future hikes will face affordability resistance.
Forward outlook
- In year one you build about $90k of equity ($38k loan paydown + $52k appreciation (0.9% local appreciation)).
- Santa Clara County population projected at +24% by 2050 — long-run rental-demand tailwind backs the buy-and-hold thesis.
- By year 4, paydown + projected appreciation supports a ~$328k cash-out refi (75% LTV) — recoverable capital for the next deal without selling this one.
Negotiation context
- It's been on market 35 days — a 3% lower offer ($5.33M) is reasonable based on typical stale-listing flexibility.
- 4 sale attempts with the ask held roughly flat each time — persistent listings suggest the price (not the market) is what's stuck; bring a comps-based counter.
- Current owner paid $360k; list at $5.50M implies a 1426% gain — meaningful room to come down on a strong offer.
Questions for the listing agent
- What do current leases actually rent for vs. the listed asking? Can we see a recent rent roll and the last 12 months of T-12 income?
- It's been on market 35 days. Have you received any prior offers? Is the seller open to a 89% concession, seller financing, or rate buy-down credit?
- Is there a deadline driving the sale (1031 exchange, divorce, estate, relocation)? That informs how much negotiation room exists.
- Schools are A-rated — typically a magnet for longer-tenancy family renters. What's the average tenant stay here, and is there a school-zone premium baked into asking?
- The area grade is low — what's the realistic commute time and amenity access for the typical tenant pool here? Any planned neighborhood developments (good or bad) we should know about?
- What's the average days-on-market for RENTAL listings here right now (not sales)? A rising rental-DOM trend means longer vacancies and softer asking-rent achievability than the comps imply.
- What's the recent tenant-quality profile in this submarket — average credit score on applications, eviction rate, late-payment / NSF rate, and stable-employment percentage? A property-management company in the area should have these aggregated.
- How much new for-sale + rental construction is in the pipeline within 1–3 miles? Heavy new supply typically softens prices + rents 12–24 months out; constrained supply supports both.
Investment metrics
- 1% rule
- 0.13% ✗
- Cap rate
- 0.25%
- Cash-on-cash
- -21.59%
- DSCR
- 0.04
- GRM
- 65.9
CMA / ARV
- ARV (median comp)
- $6,883,999
- List price
- $5,495,000
- Delta
- -20.18%
- Verdict
- UNDERPRICED
- Comps
- 20 within 1.0 mi
Show comp detail 6 sales within ~0.75 mi
| Address | Dist | Beds/Ba | Sqft | Sold | Price | $/sf | Match |
|---|---|---|---|---|---|---|---|
| 1650 Waverley St | 0.43mi | 6/6.0 (-1) | 5,787 (-0%) | 12mo | $17,998,000 | $3,110 | 56 |
| 543 Seale Ave | 0.70mi | 7/6.5 | 5,673 (-2%) | 1mo | $13,500,000 | $2,380 | 56 |
| 265 Coleridge Ave | 0.34mi | 6/7.0 (-1) | 5,153 (-11%) | 3mo | $10,388,888 | $2,016 | 54 |
| 543 Tennyson Ave | 0.63mi | 7/6.5 | 5,756 (-1%) | 15mo | $13,350,000 | $2,319 | 50 |
| 1932 Emerson St | 0.63mi | 6/6.0 (-1) | 5,310 (-8%) | 1mo | $9,800,000 | $1,846 | 43 |
| 1480 Byron St | 0.55mi | 8/7.5 (+1) | 5,272 (-9%) | 21mo | $8,580,000 | $1,627 | 34 |
Match score weights: distance 35% · size 25% · config 20% · recency 20%. Top-matched comps best support the ARV.
Projected returns pro-forma
0.94% appreciation · 7.38% rent growth · sell at horizon
- IRR
- -21.5%
- Equity multiple
- -0.07×
- Total profit
- $-1,646,829
- Equity at exit
- $1,859,287
- IRR
- -13.5%
- Equity multiple
- -0.66×
- Total profit
- $-2,559,482
- Equity at exit
- $2,458,033
Cash invested: $1,538,600 (down + closing). Projections, not guarantees.
Landlord ↔ Tenant lean methodology
- Overall (STATE)
- 18 Strongly Tenant-Friendly
- State California
- 18 Strongly Tenant-Friendly · D+13
- County
- — inherits STATE
- City
- — inherits STATE
ZIP-level market 94301
- Home prices YoY
- 0.3%
- Rents YoY
- 7.4%
- Active inventory
- 34
- Price-to-rent
- 65.9×
Monthly cashflow live
- Estimated rent
- $6,951 medium interval (Pro) →
- Mortgage (P&I)
- −$28,816
- Tax from tax record
- −$2,068 /mo · $24,818/yr
- Insurance
- −$2,290
- HOA
- −$0
- Vacancy / Maint / Mgmt
- −$1,460
- Net cashflow
- $-27,682
Break-even live
UW: 25.0% down · 7.5% · 30yr · 1.5% tax · 5.0% vac · 8.0% maint · 8.0% mgmt
Financing live
Cash to close
- Down payment
- $1,373,750
- Closing costs
- $164,850
- Reserves months
- —
- Total cash needed
- —
Loan-product check · same deal, 3 products live
Conventional
25% down · 7.5% · 30yr
- Down + closing
- —
- Monthly P&I
- —
- Monthly cashflow
- —
- DSCR
- —
- Eligible?
- —
Personal DTI + credit; lowest rate.
DSCR
20% down · 8.5% · 30yr
- Down + closing
- —
- Monthly P&I
- —
- Monthly cashflow
- —
- DSCR
- —
- Eligible?
- —
No personal income docs; deal must DSCR.
Hard money
10% down · 12.0% · 12mo
- Down + closing
- —
- Monthly P&I
- —
- Monthly cashflow
- —
- DSCR
- —
- Eligible?
- —
Short-term bridge; refi at stabilization.
Listing history 23 events
-
2026-06-18days on market $5,495,000 Active 35 DOM
-
2026-06-17days on market $5,495,000 Active 34 DOM
-
2026-06-16days on market $5,495,000 Active 33 DOM
-
2026-06-15days on market $5,495,000 Active 32 DOM
-
2026-06-13days on market $5,495,000 Active 30 DOM
-
2026-06-13days on market $5,495,000 Active 29 DOM
-
2026-06-09days on market $5,495,000 Active 26 DOM
-
2026-06-08days on market $5,495,000 Active 25 DOM
-
2026-06-07days on market $5,495,000 Active 24 DOM
-
2026-06-03days on market $5,495,000 Active 20 DOM
-
2026-06-02days on market $5,495,000 Active 19 DOM
-
2026-06-01days on market $5,495,000 Active 18 DOM
-
2026-05-31days on market $5,495,000 Active 17 DOM
-
2026-05-15$5,495,000 Active 843-char remark
Show marketing remark (843 chars)
Imagine the possibilities! Such a special fairytale jewel box home on one of Palo Alto's most coveted streets Kingsley in old Palo Alto. Freshened up with gorgeous new colorful landscaping, fresh new turf in front and back yards, new paint in the main home, come see this enchanting estate that is walking distance to all that makes Palo Alto special. Walk or bike to Stanford, town and country shopping plaza, Elizabeth gamble garden etc. Featuring three separate structures, the entire home was lovingly designed and built by the current owner for his family. Gorgeous oak floors and warm inviting rooms, included a marble tile sunroom offer special places for friends and family to gather. The back cottage and detached garage/office space provide ample living area for visiting friends or extended family. You can't miss this special home!
-
2025-11-12historical
-
2025-09-12Active
-
2025-05-16historical
-
2025-04-16historical
-
2025-04-06price
-
2025-03-21price
-
2025-01-09Active
-
1988-08-01soldstatus $360,000
ⓘ Source: listings_history table (triggers on properties + properties_extension) + one-shot
backfill from property_details.listing_events for pre-trigger history.
Tax reassessment forecast CA · Resets to sale price
- Current annual tax
- $24,818 · $2,068/mo
- Projected year-2 tax
- $41,762 · $3,480/mo
- Expected delta
- +$16,944/yr (+$1,412/mo · 68.3%)
ⓘ Screening estimate from a state-policy table — verify with the county assessor before closing.
Climate risk First Street
- Flood 3/10 Moderate FEMA zone X (shaded) · 17% chance over 30 yrs
- Wildfire 1/10 Low
- Heat 3/10 Moderate 7 d/yr ≥92°F today · 14 d/yr by 30 yrs out
- Wind 1/10 Low
- Air quality 7/10 Severe 12 unhealthy d/yr today · 12 by 30 yrs out
Nearby sold comps map
Loading sold comps map…
Walkable amenities ~0.75 mi
Loading nearby amenities…
Taxation est. · year 1
- Rental income
- $83,418
- − Mortgage interest
- −$307,805
- − Property taxes
- −$24,818
- − Insurance
- −$27,475
- − Repairs & maintenance
- −$6,673
- − Management
- −$6,673
- − Depreciation
- −$159,855
- Taxable loss
- −$449,882
- Est. tax savings @ 24.0%
- +$107,972
- After-tax cash flow
- $-224,218/yr
For passive investors: Depreciation is non-cash, so a rental often shows a tax loss while cash-flowing — sheltering income. Rental losses are passive: they offset passive income freely, and up to $25,000/yr can offset ordinary (W-2) income if you actively participate and your MAGI is under $100k (phasing out to $0 by $150k); unused losses carry forward. On sale, claimed depreciation is recaptured at up to 25%, and gains may owe capital-gains tax (a 1031 exchange can defer both). Figures are a year-1 estimate at your 24.0% rate — not tax advice; consult a CPA.
Schools (NCES district)
- District
- Palo Alto Unified
- NCES district ID
- 0629610
- Math proficiency
- 79% ▼ -2.00%
- Reading proficiency
- 80% ▼ -1.00%
- Median HH income
- $124,038
- Composite
- 74.33/100
- National rank
- #161
- State rank
- #19 of 517 in CA
Livability — Palo Alto
- Score
- 84/100
- State rank
- #19
- US rank
- #821
Category grades
Schools grade is shown separately in the Schools card above.
Census & demographics
- Census place
- Palo Alto, CA
- County
- Santa Clara County · 1,806,974 people
- City population
- 44,691
- Metro
- San Jose-Sunnyvale-Santa Clara, CA
- Population (ZIP)
- 17,508
- Household income
- $242,006
- Rent vs Own
- Severe rent burden
- 609.0
Population outlook (Santa Clara County) Hauer SSP2
- Today (2025)
- 2,179,074 people
- By 2030
- 2,301,297 · +5.6%
- By 2040
- 2,528,195 · +16.0%
- By 2050
- 2,712,135 · +24.5%
- By 2075
- 2,998,701 · +37.6%
- By 2100
- 2,931,429 · +34.5%
Race, ethnicity, and origin ACS 2023
- Neighborhood character
- Diverse neighborhood (Simpson 0.60)
- Race & ethnicity
- White 58% Asian 26% Two or more races 11% Hispanic / Latino 6% Black 2%
- Hispanic origin (detail)
- Mexican 1%
- Common ancestry
- Romanian 3% Scotch-Irish 3% Lithuanian 3%
- Foreign-born
- 32% · China, Canada, South Korea
- Languages at home
- 70% English-only · Chinese 8% Other Indo-European 6% Spanish 5%
Political lean MEDSL · Santa Clara
- 2024 margin
- Solid D (+40.0) · D 68.1% · R 28.1% · Other 3.8%
- 2008→2024 swing
- -0.9pp no change · 2008: 40.9pp · 2024: 40.0pp
- All cycles
- 2024: D+40.0 2020: D+47.4 2016: D+52.5 2012: D+42.1 2008: D+40.9
Not yet ingested
- Civics
- —
Market trends
- HPI YoY
- ▲ 0.94%
- Current HPI
- 339.4966
- Rent YoY
- ▲ 7.38%
- Metro
- San Jose-Sunnyvale-Santa Clara, CA
- State GDP YoY
- ▲ 3.21%
- F500 in state
- 116
Industry mix (Fortune 500 HQ in CA)
| Industry | F500 HQs | Revenue |
|---|---|---|
| Technology | 27 | $1,492B |
|
||
| Financial Services | 3 | $174B |
|
||
| Retail | 3 | $44B |
|
||
| Insurance | 3 | $26B |
|
||
| Media / Entertainment | 2 | $115B |
|
||
| Pharmaceuticals / Biotech | 2 | $62B |
|
||
Price history
+1426.4% since first listed10 events — show timeline
- 2026-05-15 Listed $5,495,000 bridgeMLS, Bay East AOR, or Contra Costa AOR
- 2026-05-15 Listed $5,495,000 MLSListings
- 2025-11-12 Listing Removed — bridgeMLS, Bay East AOR, or Contra Costa AOR
- 2025-09-12 Listed — bridgeMLS, Bay East AOR, or Contra Costa AOR
- 2025-05-16 Listing Removed — bridgeMLS, Bay East AOR, or Contra Costa AOR
- 2025-04-16 Listing Removed — bridgeMLS, Bay East AOR, or Contra Costa AOR
- 2025-04-06 Price Changed — bridgeMLS, Bay East AOR, or Contra Costa AOR
- 2025-03-21 Price Changed — bridgeMLS, Bay East AOR, or Contra Costa AOR
- 2025-01-09 Listed — bridgeMLS, Bay East AOR, or Contra Costa AOR
- 1988-08-01 Sold (Public Records) $360,000 Public Records
Property tax history
+2.2%/yrLatest (2025): $24,818 · +4.3% YoY. Source: county tax records.
Cash-flow waterfall
monthlySold comps — $/sqft
last 12 mo · ≤1 miLoading sold comps…