3704 N Foster Dr · Baton Rouge, LA
Flood risk 6/10 · Moderate
- FEMA flood zone
- AE
- Chance of flooding over 30 yrs
- 0.74%
- Est. flood insurance / yr
- $1,737 – $8,500
Fire risk 1/10 · Minimal
- Est. fire insurance / yr
- $1,269 – $2,357
Heat risk 8/10 · Major
- Hot days now (above 108°F)
- 7 days/yr
- Hot days in 30 yrs
- 19 days/yr
Wind risk 9/10 · Severe
- Chance of severe wind over 30 yrs
- 99.0%
Air-quality risk 3/10 · Minor
- Unhealthy air days now
- 3 days/yr
- Unhealthy air days in 30 yrs
- 4 days/yr
Risk factors via First Street. Map © Google.
Why this score? — see what drove the B- grade
The composite is a weighted blend of 9 inputs, each scored 0–100. Each bar is that input's sub-score; the figure is the points it added to the 100-point composite (weight × sub-score).
- Cash flow +30.0/30.0
- 1% rule +10.0/10.0
- DSCR +10.0/10.0
- ARV discount +7.5/15.0
- Livability +3.7/5.0
- Schools +2.4/10.0
- Rent growth +2.2/5.0
- Condition / age +1.0/5.0
- Appreciation +0.0/10.0
$38,000
🖨 Deal sheet 📄 Offer letter ✓ Due diligence
Listing remarks MLS
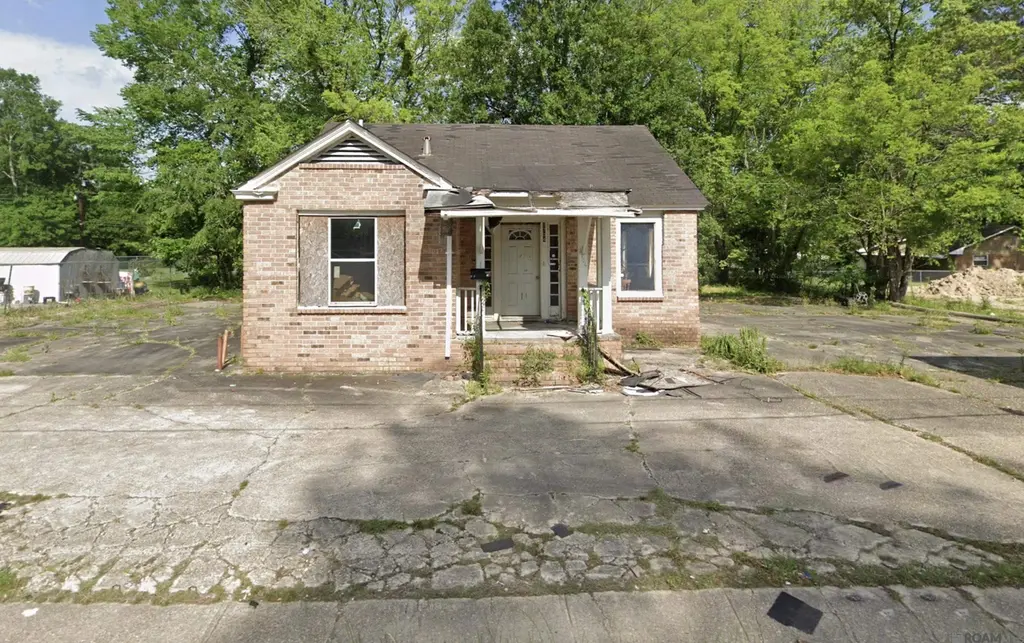
THIS PROPERTY REQUIRES A COMPLETE OVERHAUL AND IS IDEAL FOR INVESTORS! Previously used a finance company. Paved lot, open canvas for multiple business types or a house. Property has been gutted, treated, and is boarded up.
Key facts
- Open canvas
- Paved lot
- 8,712 sq ft lot
Tags
Neighborhood map
What this means for you Summary
Snapshot
- This is a 2-bed/1.5-bath single-family listed at $38k. Condition is rated poor.
Deal economics
- At list price, monthly cash flow is $167 ($2k/yr) — positive.
- The deal already cash-flows at list — no discount required.
- Meets the 1% rule at list price ($1k rent vs $38k).
- Recommended offer: $33k (12.0% below list) — sets the bar for market timing.
- Cap rate 25.0% vs local median 4.3% in Baton Rouge — top-decile yield for the area; either an underpriced asset or a hidden risk that comps aren't pricing in. Stress-test before assuming the spread holds.
Location & tenants
- Location reads 74/100 on livability (#24 in LA, #4,535 nationally) — a middle-class / working-renter tenant base. Strengths: commute A+, cost of living A+, health & safety A+; Watch: amenities D, crime F, employment D-.
- East Baton Rouge Parish (urban): math 22% / reading 34% proficiency, ranked #47 of 98 in LA (top 48%) — low school quality limits family demand, transient renter base, plan for 1-2y turnover; 77% free/reduced lunch — lower-income household profile, screen leases tightly.
- Market conditions: Rents soft (-1.2%/yr); 155 active listings in the ZIP; 21 comparable units currently listed for rent nearby; rentals at typical pace (median 24d on market — plan ~3-4 weeks tenant-placement turnaround); lower-income renter base — watch delinquency; 2,252 units permitted in East Baton Rouge Parish in 2024 (440 in 5+ unit buildings).
- At $1,084/mo this rent would consume 51% of the median local household income ($25k/yr) (locally 1980% of renters already pay >50% of income on rent) — very limited rent-growth headroom before tenants either downsize or default.
Forward outlook
- Local home prices are declining (-3.0%/yr); year-one equity from $263 of loan paydown is wiped out by about $1k of value loss. Plan a longer hold.
- East Baton Rouge County population projected at +4% by 2050 — modest demand growth; plan on rents tracking national, not racing it.
Negotiation context
- It's been on market 346 days — a 12% lower offer ($33k) is reasonable based on typical stale-listing flexibility.
- 3 sale attempts with the ask held roughly flat each time — persistent listings suggest the price (not the market) is what's stuck; bring a comps-based counter.
Risks & watch-outs
- Watch-outs: flood insurance adds $427/mo.
- Climate carrying-cost: in FEMA flood zone AE (mandatory federal flood insurance); severe wind risk, 99% chance of damaging wind over 30y; extreme-heat days projected 7→19/yr by 2055 (HVAC capex compounding) — expect insurance premiums to compound above CPI over the hold.
Questions for the listing agent
- It's been on market 346 days. Have you received any prior offers? Is the seller open to a 12% concession, seller financing, or rate buy-down credit?
- Have any recent inspections been done? Can we get a copy of the seller's disclosures and any deferred-maintenance estimates?
- What's the actual annual flood-insurance premium (NFIP or private), and is the property in a SFHA with mandatory coverage?
- Why hasn't it sold? Are there any deal-killer items the seller is aware of (foundation, flood, title, zoning, code violations)?
- Is there a deadline driving the sale (1031 exchange, divorce, estate, relocation)? That informs how much negotiation room exists.
- Crime grade is F in this area — have there been break-ins, vandalism, or insurance claims at this property in the last 3 years? What carrier currently insures it and at what premium?
- What's the average days-on-market for RENTAL listings here right now (not sales)? A rising rental-DOM trend means longer vacancies and softer asking-rent achievability than the comps imply.
- What's the recent tenant-quality profile in this submarket — average credit score on applications, eviction rate, late-payment / NSF rate, and stable-employment percentage? A property-management company in the area should have these aggregated.
- How much new for-sale + rental construction is in the pipeline within 1–3 miles? Heavy new supply typically softens prices + rents 12–24 months out; constrained supply supports both.
Investment metrics
- 1% rule
- 2.85% ✓
- Cap rate
- 25.03%
- Cash-on-cash
- 66.92%
- DSCR
- 3.98
- GRM
- 2.9
CMA / ARV
- ARV (median comp)
- $145,424
- List price
- $38,000
- Delta
- -73.87%
- Verdict
- UNDERPRICED
- Comps
- 20 within 1.0 mi
Show comp detail 11 sales within ~0.75 mi
| Address | Dist | Beds/Ba | Sqft | Sold | Price | $/sf | Match |
|---|---|---|---|---|---|---|---|
| 3536 Beechwood Dr | 0.18mi | 3/1.5 (+1) | 1,288 (-11%) | 2mo | $77,500 | $60 | 66 |
| 5354 Linden St | 0.30mi | 3/2.0 (+1) | 1,400 (-3%) | 11mo | $169,900 | $121 | 65 |
| 4624 Winnebago St | 0.22mi | 3/2.0 (+1) | 1,500 (+4%) | 16mo | $148,500 | $99 | 63 |
| 3555 Eleanor Dr | 0.16mi | 3/2.0 (+1) | 1,660 (+15%) | 5mo | $195,000 | $117 | 57 |
| 3115 Garnet Dr | 0.69mi | 3/2.0 (+1) | 1,453 (+0%) | 5mo | $160,000 | $110 | 56 |
| 4126 Prescott Ct | 0.34mi | 3/1.0 (+1) | 1,300 (-10%) | 5mo | $135,000 | $104 | 56 |
| 4938 Shelley St | 0.60mi | 3/1.0 (+1) | 1,400 (-3%) | 12mo | $99,900 | $71 | 50 |
| 3871 Winbourne Ave | 0.69mi | 3/2.0 (+1) | 1,499 (+4%) | 9mo | $179,995 | $120 | 47 |
| 3045 Voss Dr | 0.47mi | 3/1.5 (+1) | 1,650 (+14%) | 7mo | $17,900 | $11 | 44 |
| 3238 Eaton St | 0.47mi | 3/2.0 (+1) | 1,300 (-10%) | 15mo | $85,000 | $65 | 42 |
| 5111 Ritterman Ave | 0.57mi | 3/1.0 (+1) | 1,317 (-9%) | 16mo | $150,000 | $114 | 38 |
Match score weights: distance 35% · size 25% · config 20% · recency 20%. Top-matched comps best support the ARV.
Projected returns pro-forma
-3.0% appreciation · 0.0% rent growth · sell at horizon
- IRR
- 4.1%
- Equity multiple
- 1.15×
- Total profit
- $1,572
- Equity at exit
- $5,666
- IRR
- 6.8%
- Equity multiple
- 1.37×
- Total profit
- $3,913
- Equity at exit
- $3,286
Cash invested: $10,640 (down + closing). Projections, not guarantees.
Landlord ↔ Tenant lean methodology
- Overall (STATE)
- 90 Strongly Landlord-Friendly
- State Louisiana
- 90 Strongly Landlord-Friendly · R+12
- County
- — inherits STATE
- City
- — inherits STATE
ZIP-level market 70805
- Rents YoY
- -1.2%
- Active inventory
- 155
- Price-to-rent
- 2.9×
Monthly cashflow live
- Estimated rent
- $1,084 high interval (Pro) →
- Mortgage (P&I)
- −$199
- Tax est. 1.5%
- −$48 /mo · $570/yr
- Insurance
- −$16
- Flood insurance flood zone
- −$427 /mo · $5,118/yr
- HOA
- −$0
- Vacancy / Maint / Mgmt
- −$228
- Net cashflow
- $167
Break-even live
UW: 25.0% down · 7.5% · 30yr · 1.5% tax · 5.0% vac · 8.0% maint · 8.0% mgmt
Financing live
Cash to close
- Down payment
- $9,500
- Closing costs
- $1,140
- Reserves months
- —
- Total cash needed
- —
Loan-product check · same deal, 3 products live
Conventional
25% down · 7.5% · 30yr
- Down + closing
- —
- Monthly P&I
- —
- Monthly cashflow
- —
- DSCR
- —
- Eligible?
- —
Personal DTI + credit; lowest rate.
DSCR
20% down · 8.5% · 30yr
- Down + closing
- —
- Monthly P&I
- —
- Monthly cashflow
- —
- DSCR
- —
- Eligible?
- —
No personal income docs; deal must DSCR.
Hard money
10% down · 12.0% · 12mo
- Down + closing
- —
- Monthly P&I
- —
- Monthly cashflow
- —
- DSCR
- —
- Eligible?
- —
Short-term bridge; refi at stabilization.
Rent comps 21 comps
| Address | Beds | Baths | Sqft | Rent | $/sqft | DOM | Units | Dist |
|---|---|---|---|---|---|---|---|---|
| 3540 N Foster Dr Baton Rouge, LA | 2.0 | 1.0 | 1000 | $1,000 | $1.00 | 23d | 1 | 0.13mi |
| 3647 Mission Dr Baton Rouge, LA | 3.0 | 1.0 | 900 | $895 | $0.99 | 23d | 1 | 0.27mi |
| 4380 Mohican-Prescott Crossover Baton Rouge, LA | 2.0 | 2.0 | 910 | $1,055 | $1.16 | 43d | 1 | 0.36mi |
| 3888 Charles St Baton Rouge, LA | 3.0 | 2.0 | 1600 | $1,500 | $0.94 | 19d | 1 | 0.60mi |
| 3888 Charles St Baton Rouge, LA | 3.0 | 2.0 | 1650 | $1,425 | $0.86 | 23d | 1 | 0.60mi |
| 5350 Clayton Dr Baton Rouge, LA | 3.0 | 1.0 | 1050 | $850 | $0.81 | 43d | 1 | 0.63mi |
| 4236 Delaware St Baton Rouge, LA | 3.0 | 2.0 | 1600 | $1,500 | $0.94 | 23d | 1 | 0.67mi |
| 3567 Charles St Baton Rouge, LA | 3.0 | 1.0 | 1400 | $1,250 | $0.89 | 43d | 1 | 0.78mi |
| 3936 Dalton St Baton Rouge, LA | 2.0 | 1.0 | 900 | $750 | $0.83 | 19d | 1 | 0.85mi |
| 3160 Wyandotte St Baton Rouge, LA | 2.0 | 1.0 | 1100 | $800 | $0.73 | 43d | 1 | 1.02mi |
| 2347 Rhodes Ave Baton Rouge, LA | 2.0 | 1.0 | 1250 | $950 | $0.76 | 19d | 1 | 1.04mi |
| 5315 McClelland Dr Baton Rouge, LA | 3.0 | 2.0 | 1369 | $1,000 | $0.73 | 23d | 1 | 1.09mi |
| 2654 Sheldon Dr Baton Rouge, LA | 3.0 | 1.0 | 1400 | $1,200 | $0.86 | 23d | 1 | 1.20mi |
| 2852 Dayton St Baton Rouge, LA | 2.0 | 1.0 | 1020 | $850 | $0.83 | 23d | 1 | 1.25mi |
| 4809 Longfellow Dr Baton Rouge, LA | 3.0 | 2.0 | 1786 | $1,900 | $1.06 | 14d | 1 | 1.32mi |
| 4963 Greenwell St Baton Rouge, LA | 3.0 | 2.0 | 1400 | $1,500 | $1.07 | 23d | 1 | 1.33mi |
| 2606 Weller Ave Baton Rouge, LA | 2.0 | 1.0 | 1000 | $650 | $0.65 | 43d | 1 | 1.34mi |
| 3906 S Barrow Dr Baton Rouge, LA | 3.0 | 2.0 | 1523 | $1,295 | $0.85 | 23d | 1 | 1.34mi |
| 3225 Victoria Dr Baton Rouge, LA | 1.0–3.0 | 1.0–3.0 | 1062 | $1,019 | $0.96 | 14d | 18 | 1.35mi |
| 2121 Lobdell Blvd Unit H54 Baton Rouge, LA | 3.0 | 2.0 | 950 | $1,194 | $1.26 | 14d | 1 | 1.45mi |
| 2645 Seneca St Baton Rouge, LA | 3.0 | 2.0 | 1650 | $1,550 | $0.94 | 23d | 1 | 1.45mi |
Listing history 4 events
-
2025-08-23status Active 222-char remark
Show marketing remark (222 chars)
THIS PROPERTY REQUIRES A COMPLETE OVERHAUL AND IS IDEAL FOR INVESTORS! Previously used a finance company. Paved lot, open canvas for multiple business types or a house. Property has been gutted, treated, and is boarded up.
-
2025-08-05status Pending 222-char remark
Show marketing remark (222 chars)
THIS PROPERTY REQUIRES A COMPLETE OVERHAUL AND IS IDEAL FOR INVESTORS! Previously used a finance company. Paved lot, open canvas for multiple business types or a house. Property has been gutted, treated, and is boarded up.
-
2025-05-27$38,000 Active 222-char remark
Show marketing remark (222 chars)
THIS PROPERTY REQUIRES A COMPLETE OVERHAUL AND IS IDEAL FOR INVESTORS! Previously used a finance company. Paved lot, open canvas for multiple business types or a house. Property has been gutted, treated, and is boarded up.
-
2025-05-27$38,000 Active 222-char remark
Show marketing remark (222 chars)
THIS PROPERTY REQUIRES A COMPLETE OVERHAUL AND IS IDEAL FOR INVESTORS! Previously used a finance company. Paved lot, open canvas for multiple business types or a house. Property has been gutted, treated, and is boarded up.
ⓘ Source: listings_history table (triggers on properties + properties_extension) + one-shot
backfill from property_details.listing_events for pre-trigger history.
Climate risk First Street
- Flood 6/10 Major FEMA zone AE · 74% chance over 30 yrs
- Wildfire 1/10 Low
- Heat 8/10 Severe 7 d/yr ≥108°F today · 19 d/yr by 30 yrs out
- Wind 9/10 Extreme 99% chance of damaging wind over 30 yrs
- Air quality 3/10 Moderate 3 unhealthy d/yr today · 4 by 30 yrs out
Nearby sold comps map
Loading sold comps map…
Walkable amenities ~0.75 mi
Loading nearby amenities…
Taxation est. · year 1
- Rental income
- $13,003
- − Mortgage interest
- −$2,129
- − Property taxes
- −$570
- − Insurance
- −$5,308
- − Repairs & maintenance
- −$1,040
- − Management
- −$1,040
- − Depreciation
- −$1,105
- Taxable income
- $1,810
- Est. tax owed @ 24.0%
- −$434
- After-tax cash flow
- $1,568/yr
For passive investors: Depreciation is non-cash, so a rental often shows a tax loss while cash-flowing — sheltering income. Rental losses are passive: they offset passive income freely, and up to $25,000/yr can offset ordinary (W-2) income if you actively participate and your MAGI is under $100k (phasing out to $0 by $150k); unused losses carry forward. On sale, claimed depreciation is recaptured at up to 25%, and gains may owe capital-gains tax (a 1031 exchange can defer both). Figures are a year-1 estimate at your 24.0% rate — not tax advice; consult a CPA.
Condition & rehab AI · 5 photos
This property requires a complete overhaul and is ideal for investors. The exterior is boarded up and overgrown, and the interior is gutted and in disarray. Significant repairs and maintenance are needed to restore the property to a livable condition.
Repairs flagged
- Major Exterior siding — Boarded up and damaged
- Major Interior framing — Exposed and in disarray
- Major Roof — No visible roof
Value-add opportunities
- Both Exterior siding repair and replacement — Improves curb appeal and structural integrity
- Both Interior framing and drywall repair — Restores structural integrity and prepares for renovation
- Both Roof repair or replacement — Ensures structural safety and prevents water damage
Renovation cost estimate screening
| Repair item | Severity | Est. cost |
|---|---|---|
| Exterior siding · Boarded up and damaged | Major | $15,000–50,000 |
| Interior framing · Exposed and in disarray | Major | $15,000–50,000 |
| Roof · No visible roof | Major | $15,000–50,000 |
| Total estimated repair cost · 3 items | $45,000–150,000 |
Value-add ROI direction
- Both Exterior siding repair and replacement — Improves curb appeal and structural integrity ↑
- Both Interior framing and drywall repair — Restores structural integrity and prepares for renovation ↑
- Both Roof repair or replacement — Ensures structural safety and prevents water damage ↑
ⓘ Cost ranges are severity-bucket heuristics (US national rule-of-thumb). Get contractor quotes + a written scope before underwriting a rehab budget.
Schools (NCES district)
- District
- East Baton Rouge Parish
- NCES district ID
- 2200540
- Math proficiency
- 22% ▼ -36.00%
- Reading proficiency
- 34% ▼ -31.00%
- Median HH income
- $46,263
- Composite
- 24.14/100
- National rank
- #7745
- State rank
- #47 of 98 in LA
Livability — Baton Rouge
- Score
- 74/100
- State rank
- #24
- US rank
- #4535
Category grades
Schools grade is shown separately in the Schools card above.
Census & demographics
- Census place
- Baton Rouge, LA
- County
- East Baton Rouge Parish · 399,686 people
- City population
- 351,868
- Metro
- Baton Rouge, LA
- Population (ZIP)
- 23,288
- Household income
- $25,397
- Rent vs Own
- Severe rent burden
- 1980.0
Population outlook (East Baton Rouge County) Hauer SSP2
- Today (2025)
- 464,810 people
- By 2030
- 472,137 · +1.6%
- By 2040
- 480,243 · +3.3%
- By 2050
- 484,422 · +4.2%
- By 2075
- 492,069 · +5.9%
- By 2100
- 476,347 · +2.5%
Race, ethnicity, and origin ACS 2023
- Neighborhood character
- Predominantly Black (95%)
- Race & ethnicity
- Black 95% Hispanic / Latino 2% White 2% Two or more races 1%
- Common ancestry
- Lithuanian 1%
- Foreign-born
- 1% · Canada
- Languages at home
- 98% English-only · Spanish 1%
Political lean MEDSL · East Baton Rouge
- 2024 margin
- D (+11.1) · D 54.5% · R 43.4% · Other 2.1%
- 2008→2024 swing
- +8.9pp toward D · 2008: 2.2pp · 2024: 11.1pp
- All cycles
- 2024: D+11.1 2020: D+13.1 2016: D+9.2 2012: D+5.2 2008: D+2.2
Not yet ingested
- Civics
- —
Market trends
- HPI YoY
- ▼ -110.79%
- Current HPI
- 75.7121
- Rent YoY
- ▼ -1.21%
- Metro
- Baton Rouge, LA
- State GDP YoY
- ▲ 3.29%
- F500 in state
- 10
Industry mix (Fortune 500 HQ in LA)
| Industry | F500 HQs | Revenue |
|---|---|---|
| Telecommunications | 2 | $23B |
|
||
| Utilities | 1 | $12B |
|
||
| Wholesale / Distribution | 1 | $5B |
|
||
| Advertising | 1 | $2B |
|
||
Price history
+0.0% since first listed4 events — show timeline
- 2025-08-23 Relisted — GBRMLS
- 2025-08-05 Pending — GBRMLS
- 2025-05-27 Listed $38,000 GBRMLS
- 2025-05-27 Listed $38,000 AcadianaMLS
Cash-flow waterfall
monthlySold comps — $/sqft
last 12 mo · ≤1 miLoading sold comps…