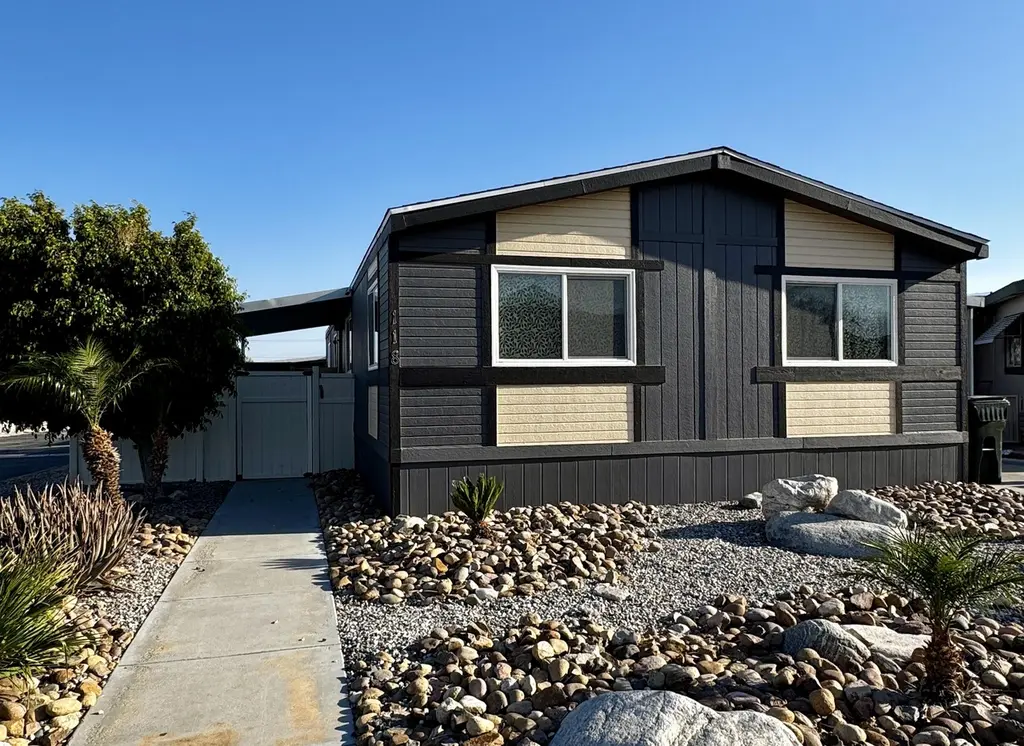
64550 Pierson Blvd #118 · Desert Hot Springs, CA
Flood risk 1/10 · Minimal
- FEMA flood zone
- AO
- Chance of flooding over 30 yrs
- 0.0%
- Est. flood insurance / yr
- $848 – $2,087
Fire risk 6/10 · Moderate
- Est. fire insurance / yr
- $659 – $1,223
Heat risk 8/10 · Major
- Hot days now (above 110°F)
- 7 days/yr
- Hot days in 30 yrs
- 20 days/yr
Wind risk 1/10 · Minimal
- Chance of severe wind over 30 yrs
- —
Air-quality risk 5/10 · Moderate
- Unhealthy air days now
- 7 days/yr
- Unhealthy air days in 30 yrs
- 10 days/yr
Risk factors via First Street. Map © Google.
Why this score? — see what drove the C+ grade
The composite is a weighted blend of 9 inputs, each scored 0–100. Each bar is that input's sub-score; the figure is the points it added to the 100-point composite (weight × sub-score).
- Cash flow +30.0/30.0
- 1% rule +10.0/10.0
- DSCR +10.0/10.0
- Rent growth +3.4/5.0
- Schools +2.7/10.0
- Livability +2.5/5.0
- Condition / age +2.5/5.0
- ARV discount +0.0/15.0
- Appreciation +0.0/10.0
$115,000
🖨 Deal sheet 📄 Offer letter ✓ Due diligence
Listing remarks
Seller to credit buyer $5,000 towards closing coast with full price offer. Welcome to Palm View Estates in Desert Hot Springs! This spacious 3 bedroom 2 bath double wide manufactured home offers comfortable living with recent remodeling updates throughout. Features include an open layout, updated finishes and generous living spaces. A great opportunity for full time living or desert retreat.
Key facts
- Garage
- Built 1988
- Listed 26 days
Property features AI
Finance
- Other: Sale terms: cash or cash to new loan; Property offered as-is; Washer, dryer, small freezer, and red refrigerator excluded from sale; Short-term rentals not allowed; Will not consider lease
- Financial info: Land is lease; monthly land lease listed separately; Land lease amount stated as $1,625 annually
- HOA & community: No monthly association fee
Exterior
- Parking: Attached carport; Two covered spaces; Two carport spaces; Four total parking spaces
- Security: Card/Code access
- Utilities: Water: in street; Sewer: unknown; PUD: no
- Home design: Detached double-wide mobile home; Single-story
- Construction: Year built: other
- Exterior features: Corner lot; Canyon view; Card/Code access
Interior
- Flooring: Laminate flooring
- Bathrooms: Two full bathrooms
- Heating & cooling: Central heating; Central air conditioning
- Interior features: Unfurnished; Dining Room; Living Room; No fireplace
- Laundry & utility: Washer and dryer excluded from sale
Neighborhood map
What this means for you Summary
Snapshot
- This is a 3-bed/2.0-bath manufactured listed at $115k.
Deal economics
- At list price, monthly cash flow is $1k ($12k/yr) — positive.
- The deal already cash-flows at list — no discount required.
- Meets the 1% rule at list price ($2k rent vs $115k).
- Recommended offer: $113k (1.5% below list) — sets the bar for market timing.
- Cap rate 18.4% vs local median 4.0% in Desert Hot Springs — top-decile yield for the area; either an underpriced asset or a hidden risk that comps aren't pricing in. Stress-test before assuming the spread holds.
Location & tenants
- Location reads 49/100 on livability (#1,149 in CA) — a working-class tenant base; expect higher turnover. Strengths: housing B+; Watch: crime D+, schools F, amenities F.
- Palm Springs Unified (suburban): math 21% / reading 42% proficiency, ranked #328 of 517 in CA (top 63%) — families likely to look elsewhere, expect single-tenant / working-renter base with shorter leases; 73% free/reduced lunch — lower-income household profile, screen leases tightly.
- Market conditions: Rents rising (+3.7%/yr); 515 active listings in the ZIP; 9 comparable units currently listed for rent nearby; rentals lingering (median 44d on market — plan ~5-8 weeks vacancy on turnover, expect pricing pressure); 67% of comp listings sitting > 30 days — soft ceiling on asking rent; 9,195 units permitted in Riverside County in 2024 (1,512 in 5+ unit buildings).
- At $2,382/mo this rent would consume 53% of the median local household income ($54k/yr) (locally 2095% of renters already pay >50% of income on rent) — very limited rent-growth headroom before tenants either downsize or default.
Forward outlook
- Local home prices are declining (-3.0%/yr); year-one equity from $795 of loan paydown is wiped out by about $3k of value loss. Plan a longer hold.
- Riverside County population projected at +22% by 2050 — long-run rental-demand tailwind backs the buy-and-hold thesis.
- At projected returns (-3.0% appreciation + 3.7% rent growth), your $32k cash investment doubles in ~4 years — after that, you're playing with house money.
Negotiation context
- It's been on market 27 days — a 2% lower offer ($113k) is reasonable based on typical stale-listing flexibility.
- 2 sale attempts since 2y ago with the ask held roughly flat each time — persistent listings suggest the price (not the market) is what's stuck; bring a comps-based counter.
Risks & watch-outs
- Watch-outs: flood insurance adds $122/mo.
- Climate carrying-cost: in FEMA flood zone AO (mandatory federal flood insurance); major wildfire risk; extreme-heat days projected 7→20/yr by 2055 (HVAC capex compounding) — expect insurance premiums to compound above CPI over the hold.
Questions for the listing agent
- What's the actual annual flood-insurance premium (NFIP or private), and is the property in a SFHA with mandatory coverage?
- Is there a deadline driving the sale (1031 exchange, divorce, estate, relocation)? That informs how much negotiation room exists.
- Schools are F-rated, which usually means shorter tenancies and higher turnover. Who's the typical renter profile here, and what's been the actual vacancy rate?
- Crime grade is D in this area — have there been break-ins, vandalism, or insurance claims at this property in the last 3 years? What carrier currently insures it and at what premium?
- What's the average days-on-market for RENTAL listings here right now (not sales)? A rising rental-DOM trend means longer vacancies and softer asking-rent achievability than the comps imply.
- What's the recent tenant-quality profile in this submarket — average credit score on applications, eviction rate, late-payment / NSF rate, and stable-employment percentage? A property-management company in the area should have these aggregated.
- How much new for-sale + rental construction is in the pipeline within 1–3 miles? Heavy new supply typically softens prices + rents 12–24 months out; constrained supply supports both.
Investment metrics
- 1% rule
- 2.07% ✓
- Cap rate
- 18.37%
- Cash-on-cash
- 43.14%
- DSCR
- 2.92
- GRM
- 4.0
CMA / ARV
- ARV (on-the-fly)
- $91,392
- Comps found
- 7
Show comp detail 7 sales within ~0.75 mi
| Address | Dist | Beds/Ba | Sqft | Sold | Price | $/sf | Match |
|---|---|---|---|---|---|---|---|
| 64625 Pierson Blvd Unit A20 | 0.16mi | 3/2.0 | 1,320 (-2%) | 1mo | $142,000 | $108 | 89 |
| 64550 Pierson Blvd #98 | 0.00mi | 3/2.0 | 1,248 (-7%) | 3mo | $95,000 | $76 | 86 |
| 64550 Pierson Blvd #117 | 0.00mi | 4/2.0 (+1) | 1,440 (+7%) | 10mo | $90,000 | $63 | 75 |
| 64550 Pierson Blvd #25 | 0.06mi | 2/2.0 (-1) | 1,215 (-10%) | 5mo | $100,000 | $82 | 72 |
| 64550 Pierson Blvd #56 | 0.00mi | 2/2.0 (-1) | 1,248 (-7%) | 13mo | $61,000 | $49 | 72 |
| 64625 Pierson Blvd Unit D18 | 0.16mi | 2/2.0 (-1) | 1,440 (+7%) | 7mo | $75,000 | $52 | 70 |
| 64625 Pierson Blvd Unit A32 | 0.19mi | 3/2.0 | 1,400 (+4%) | 19mo | $95,000 | $68 | 68 |
Match score weights: distance 35% · size 25% · config 20% · recency 20%. Top-matched comps best support the ARV.
Projected returns pro-forma
-3.0% appreciation · 3.66% rent growth · sell at horizon
- IRR
- 35.5%
- Equity multiple
- 2.52×
- Total profit
- $48,965
- Equity at exit
- $17,147
- IRR
- 42.6%
- Equity multiple
- 5.18×
- Total profit
- $134,444
- Equity at exit
- $9,943
Cash invested: $32,200 (down + closing). Projections, not guarantees.
Landlord ↔ Tenant lean methodology
- Overall (STATE)
- 18 Strongly Tenant-Friendly
- State California
- 18 Strongly Tenant-Friendly · D+13
- County
- — inherits STATE
- City
- — inherits STATE
ZIP-level market 92240
- Home prices YoY
- -19.6%
- Rents YoY
- 3.7%
- Active inventory
- 515
- Price-to-rent
- 4.0×
Monthly cashflow live
- Estimated rent
- $2,382 high interval (Pro) →
- Mortgage (P&I)
- −$603
- Tax from tax record
- −$73 /mo · $882/yr
- Insurance
- −$48
- Flood insurance flood zone
- −$122 /mo · $1,468/yr
- HOA
- −$0
- Vacancy / Maint / Mgmt
- −$500
- Net cashflow
- $1,035
Break-even live
UW: 25.0% down · 7.5% · 30yr · 1.5% tax · 5.0% vac · 8.0% maint · 8.0% mgmt
Financing live
Cash to close
- Down payment
- $28,750
- Closing costs
- $3,450
- Reserves months
- —
- Total cash needed
- —
Loan-product check · same deal, 3 products live
Conventional
25% down · 7.5% · 30yr
- Down + closing
- —
- Monthly P&I
- —
- Monthly cashflow
- —
- DSCR
- —
- Eligible?
- —
Personal DTI + credit; lowest rate.
DSCR
20% down · 8.5% · 30yr
- Down + closing
- —
- Monthly P&I
- —
- Monthly cashflow
- —
- DSCR
- —
- Eligible?
- —
No personal income docs; deal must DSCR.
Hard money
10% down · 12.0% · 12mo
- Down + closing
- —
- Monthly P&I
- —
- Monthly cashflow
- —
- DSCR
- —
- Eligible?
- —
Short-term bridge; refi at stabilization.
Rent comps 9 comps
| Address | Beds | Baths | Sqft | Rent | $/sqft | DOM | Units | Dist |
|---|---|---|---|---|---|---|---|---|
| 13175 Little Morongo Rd Desert Hot Springs, CA | 4.0 | 2.5 | 1056 | $1,995 | $1.89 | 43d | 1 | 0.81mi |
| 11693 Mountain Hawk Ln Desert Hot Springs, CA | 4.0 | 3.0 | 1666 | $2,500 | $1.50 | 43d | 1 | 0.86mi |
| 65568 Acoma Ave Desert Hot Springs, CA | 2.0 | 2.5 | 1320 | $2,095 | $1.59 | 14d | 1 | 0.99mi |
| 65565 Acoma Ave #49 Desert Hot Springs, CA | 3.0 | 2.0 | 1396 | $2,300 | $1.65 | 43d | 1 | 1.06mi |
| 9591 Capiland Rd Desert Hot Springs, CA | 3.0 | 2.0 | 1707 | $2,450 | $1.44 | 24d | 1 | 1.15mi |
| 65841 6th St Desert Hot Springs, CA | 2.0 | 2.0 | 1204 | $2,250 | $1.87 | 43d | 1 | 1.29mi |
| 66023 4th St Desert Hot Springs, CA | 4.0 | 2.0 | 1743 | $2,600 | $1.49 | 43d | 1 | 1.46mi |
| 13322 El Rio Ln Desert Hot Springs, CA | 3.0 | 2.0 | 1215 | $2,750 | $2.26 | 43d | 1 | 1.48mi |
| 65548 Avenida Barona Desert Hot Springs, CA | 3.0 | 2.0 | 1200 | $2,799 | $2.33 | 10d | 1 | 1.49mi |
Listing history 17 events
-
2026-06-18days on market $115,000 Active 27 DOM
-
2026-06-17days on market $115,000 Active 26 DOM
-
2026-06-16days on market $115,000 Active 25 DOM
-
2026-06-15days on market $115,000 Active 24 DOM
-
2026-06-13days on market $115,000 Active 22 DOM
-
2026-06-13days on market $115,000 Active 21 DOM
-
2026-06-09days on market $115,000 Active 18 DOM
-
2026-06-08days on market $115,000 Active 17 DOM
-
2026-06-07days on market $115,000 Active 16 DOM
-
2026-06-04days on market $115,000 Active 13 DOM
-
2026-06-03days on market $115,000 Active 12 DOM
-
2026-06-02days on market $115,000 Active 11 DOM
-
2026-06-01days on market $115,000 Active 10 DOM
-
2026-05-31days on market $115,000 Active 9 DOM
-
2026-05-21$115,000 Active
-
2024-01-08$80,000
-
2024-01-08historical
ⓘ Source: listings_history table (triggers on properties + properties_extension) + one-shot
backfill from property_details.listing_events for pre-trigger history.
Tax reassessment forecast CA · Resets to sale price
- Current annual tax
- $882 · $73/mo
- Projected year-2 tax
- $882 · $73/mo
- Expected delta
- $0/yr ($0/mo · 0.0%)
ⓘ Screening estimate from a state-policy table — verify with the county assessor before closing.
Climate risk First Street
- Flood 1/10 Low FEMA zone AO · 0% chance over 30 yrs
- Wildfire 6/10 Major
- Heat 8/10 Severe 7 d/yr ≥110°F today · 20 d/yr by 30 yrs out
- Wind 1/10 Low
- Air quality 5/10 Major 7 unhealthy d/yr today · 10 by 30 yrs out
Nearby sold comps map
Loading sold comps map…
Walkable amenities ~0.75 mi
Loading nearby amenities…
Taxation est. · year 1
- Rental income
- $28,589
- − Mortgage interest
- −$6,442
- − Property taxes
- −$882
- − Insurance
- −$2,042
- − Repairs & maintenance
- −$2,287
- − Management
- −$2,287
- − Depreciation
- −$3,345
- Taxable income
- $11,303
- Est. tax owed @ 24.0%
- −$2,713
- After-tax cash flow
- $9,711/yr
For passive investors: Depreciation is non-cash, so a rental often shows a tax loss while cash-flowing — sheltering income. Rental losses are passive: they offset passive income freely, and up to $25,000/yr can offset ordinary (W-2) income if you actively participate and your MAGI is under $100k (phasing out to $0 by $150k); unused losses carry forward. On sale, claimed depreciation is recaptured at up to 25%, and gains may owe capital-gains tax (a 1031 exchange can defer both). Figures are a year-1 estimate at your 24.0% rate — not tax advice; consult a CPA.
Schools (NCES district)
- District
- Palm Springs Unified
- NCES district ID
- 0629550
- Math proficiency
- 21% ▼ -7.00%
- Reading proficiency
- 42% ▬ 0.00%
- Median HH income
- $43,638
- Composite
- 26.76/100
- National rank
- #7131
- State rank
- #328 of 517 in CA
Livability — Desert Hot Springs
- Score
- 49/100
- State rank
- #1149
- US rank
- #25774
Category grades
Schools grade is shown separately in the Schools card above.
Census & demographics
- Census place
- Desert Hot Springs, CA
- County
- Riverside County · 2,287,001 people
- City population
- 41,615
- Metro
- Riverside-San Bernardino-Ontario, CA
- Population (ZIP)
- 41,615
- Household income
- $54,023
- Rent vs Own
- Severe rent burden
- 2095.0
Population outlook (Riverside County) Hauer SSP2
- Today (2025)
- 2,664,475 people
- By 2030
- 2,802,692 · +5.2%
- By 2040
- 3,050,904 · +14.5%
- By 2050
- 3,256,783 · +22.2%
- By 2075
- 3,655,058 · +37.2%
- By 2100
- 3,766,594 · +41.4%
Race, ethnicity, and origin ACS 2023
- Neighborhood character
- Majority Hispanic (64%)
- Race & ethnicity
- Hispanic / Latino 64% Two or more races 27% White 23% Black 7% Native American 2% Asian 2%
- Hispanic origin (detail)
- Mexican 53%
- Common ancestry
- Lithuanian 1% Romanian 1% Italian 1%
- Foreign-born
- 27% · Canada, Vietnam
- Languages at home
- 47% English-only · Spanish 50% Russian/Polish/Slavic 1%
Political lean MEDSL · Riverside
- 2024 margin
- Toss-up / Even · D 48.0% · R 49.3% · Other 2.6%
- 2008→2024 swing
- -3.6pp toward R · 2008: 2.3pp · 2024: -1.3pp
- All cycles
- 2024: R+1.3 2020: D+8.0 2016: D+4.3 2012: R+0.4 2008: D+2.3
Not yet ingested
- Civics
- —
Market trends
- HPI YoY
- ▼ -102.10%
- Current HPI
- 418.4691
- Rent YoY
- ▲ 3.66%
- Metro
- Riverside-San Bernardino-Ontario, CA
- State GDP YoY
- ▲ 3.21%
- F500 in state
- 116
Industry mix (Fortune 500 HQ in CA)
| Industry | F500 HQs | Revenue |
|---|---|---|
| Technology | 27 | $1,492B |
|
||
| Financial Services | 3 | $174B |
|
||
| Retail | 3 | $44B |
|
||
| Insurance | 3 | $26B |
|
||
| Media / Entertainment | 2 | $115B |
|
||
| Pharmaceuticals / Biotech | 2 | $62B |
|
||
Price history
+43.8% since first listed3 events — show timeline
- 2026-05-21 Listed $115,000 GPSMLS
- 2024-01-08 Listing Removed — CRMLS
- 2024-01-08 Listed $80,000 CRMLS
Property tax history
-0.6%/yrLatest (2025): $882 · -0.5% YoY. Source: county tax records.
Cash-flow waterfall
monthlySold comps — $/sqft
last 12 mo · ≤1 miLoading sold comps…