89 Waterfall Loop · Orofino, ID
Flood risk No data
- FEMA flood zone
- —
- Chance of flooding over 30 yrs
- —
- Est. flood insurance / yr
- —
Fire risk No data
- Est. fire insurance / yr
- —
Heat risk No data
- Hot days now (above threshold)
- —
- Hot days in 30 yrs
- —
Wind risk No data
- Chance of severe wind over 30 yrs
- —
Air-quality risk No data
- Unhealthy air days now
- —
- Unhealthy air days in 30 yrs
- —
Risk factors via First Street. Map © Google.
Why this score? — see what drove the D- grade
The composite is a weighted blend of 9 inputs, each scored 0–100. Each bar is that input's sub-score; the figure is the points it added to the 100-point composite (weight × sub-score).
- 1% rule +8.8/10.0
- Cash flow +7.9/30.0
- ARV discount +7.6/15.0
- Schools +3.9/10.0
- Livability +3.8/5.0
- Rent growth +2.5/5.0
- Condition / age +2.5/5.0
- DSCR +2.0/10.0
- Appreciation +0.0/10.0
$85,000
🖨 Deal sheet 📄 Offer letter ✓ Due diligence
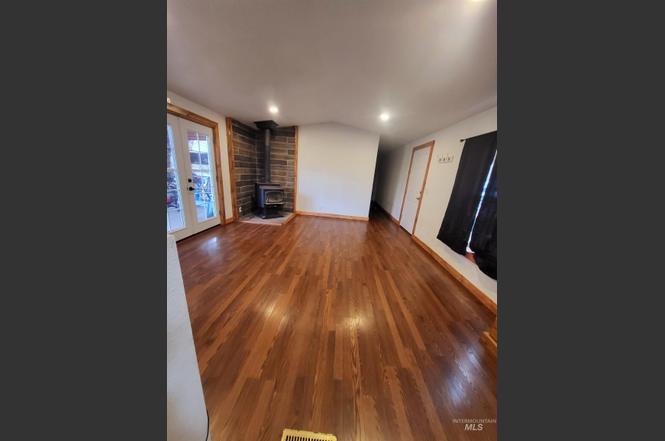
Listing remarks
Beautiful, move-in ready home located in one of the best parks Orofino has to offer, featuring low space rent and thoughtful upgrades throughout. The well-designed split floor plan offers an impressive master suite on one side of the home, complete with an en suite bathroom and walk-in closet, providing privacy and comfort. On the opposite side, you’ll find two additional bedrooms and a full hall bath—perfect for guests, family, or a home office. The kitchen, dining, and living areas come together in an open great-room concept, creating a warm and inviting space for everyday living and entertaining. A wood-burning stove serves as the focal point of this area, adding charm, effic
Key facts
- Master suite
- En suite bathroom
- Thoughtful upgrades
Tags
Property features AI
Finance
- Other: Homeowner tax exemption
- HOA & community: Monthly association fee of $425
Exterior
- Utilities: Community water service; Sewer connected; Electric water heater
- Home design: Mobile/manufactured home (rented lot); Built in 1997
- Construction: Metal roof
- Exterior features: Metal fencing; Located in a mobile home park
Interior
- Kitchen: Dishwasher; Built-in oven/range; Refrigerator; Breakfast bar
- Bedrooms: 3 bedrooms, all on the main level
- Flooring: Laminate
- Bathrooms: 2 bathrooms
- Heating & cooling: Forced air heating; Wood heating (wood burning stove); No central air
- Interior features: Master bedroom with en-suite bath; Great room; Walk-in closet(s); Breakfast bar
- Laundry & utility: Electric water heater
Neighborhood map
What this means for you Summary
Snapshot
- This is a 3-bed/2.0-bath manufactured listed at $85k.
Deal economics
- At list price, monthly cash flow is $-89 ($-1k/yr) — negative.
- To cash-flow at today's rent, offer at most $72k (15.1% below list).
- Meets the 1% rule at list price ($1k rent vs $85k).
- Recommended offer: $72k (15.1% below list) — sets the bar for cash-flow.
- Cap rate 5.0% vs local median 2.4% in Orofino — top-decile yield for the area; either an underpriced asset or a hidden risk that comps aren't pricing in. Stress-test before assuming the spread holds.
Location & tenants
- Location reads 76/100 on livability (#27 in ID, #3,806 nationally) — a middle-class / working-renter tenant base. Strengths: crime A+, cost of living A+, housing A+; Watch: amenities F, commute F, employment D-.
- Orofino Joint District (town): math 37% / reading 56% proficiency, ranked #45 of 92 in ID (top 49%) — families likely to look elsewhere, expect single-tenant / working-renter base with shorter leases.
- Zoned schools: Orofino Elementary School (math 42% / reading 52%, grade D-, #176 of 357 statewide, top 53%, 376 students, 41% FRL); Orofino High School (math 32% / reading 67%, grade D, #45 of 169 statewide, top 29%, 372 students, 25% FRL).
- Market conditions: 81 active listings in the ZIP; 51 units permitted in Clearwater County in 2024 (0 in 5+ unit buildings).
Forward outlook
- Local home prices are declining (-3.0%/yr); year-one equity from $588 of loan paydown is wiped out by about $3k of value loss. Plan a longer hold.
- Clearwater County population projected to shrink 6% by 2050 — rents likely to lag national; underwrite the cash flow, not the appreciation.
Negotiation context
- It's been on market 91 days — a 9% lower offer ($77k) is reasonable based on typical stale-listing flexibility.
Risks & watch-outs
- Watch-outs: HOA is 36% of rent.
Questions for the listing agent
- What do current leases actually rent for vs. the listed asking? Can we see a recent rent roll and the last 12 months of T-12 income?
- It's been on market 91 days. Have you received any prior offers? Is the seller open to a 15% concession, seller financing, or rate buy-down credit?
- What does the HOA fee cover, when was the last increase, and are there any pending special assessments or reserve-fund shortfalls?
- Why hasn't it sold? Are there any deal-killer items the seller is aware of (foundation, flood, title, zoning, code violations)?
- Is there a deadline driving the sale (1031 exchange, divorce, estate, relocation)? That informs how much negotiation room exists.
- Schools are D-rated, which usually means shorter tenancies and higher turnover. Who's the typical renter profile here, and what's been the actual vacancy rate?
- The area grade is low — what's the realistic commute time and amenity access for the typical tenant pool here? Any planned neighborhood developments (good or bad) we should know about?
- What's the average days-on-market for RENTAL listings here right now (not sales)? A rising rental-DOM trend means longer vacancies and softer asking-rent achievability than the comps imply.
- What's the recent tenant-quality profile in this submarket — average credit score on applications, eviction rate, late-payment / NSF rate, and stable-employment percentage? A property-management company in the area should have these aggregated.
- How much new for-sale + rental construction is in the pipeline within 1–3 miles? Heavy new supply typically softens prices + rents 12–24 months out; constrained supply supports both.
Investment metrics
- 1% rule
- 1.38% ✓
- Cap rate
- 5.04%
- Cash-on-cash
- -4.48%
- DSCR
- 0.80
- GRM
- 6.1
CMA / ARV
- ARV (on-the-fly)
- $85,120
- Comps found
- 3
Show comp detail 3 sales within ~0.75 mi
| Address | Dist | Beds/Ba | Sqft | Sold | Price | $/sf | Match |
|---|---|---|---|---|---|---|---|
| 89 Waterfall Loop | 0.00mi | 3/2.0 | 1,216 (0%) | 0mo | $85,000 | $70 | 100 |
| 12 141st St | 0.68mi | 3/2.0 | 1,134 (-7%) | 23mo | $105,000 | $93 | 38 |
| 7 Twilight Dr | 0.74mi | 2/2.0 (-1) | 1,072 (-12%) | 21mo | $69,000 | $64 | 24 |
Match score weights: distance 35% · size 25% · config 20% · recency 20%. Top-matched comps best support the ARV.
Projected returns pro-forma
-3.0% appreciation · 3.0% rent growth · sell at horizon
- IRR
- -23.4%
- Equity multiple
- 0.20×
- Total profit
- $-19,156
- Equity at exit
- $12,674
- IRR
- -17.1%
- Equity multiple
- 0.04×
- Total profit
- $-22,837
- Equity at exit
- $7,349
Cash invested: $23,800 (down + closing). Projections, not guarantees.
Landlord ↔ Tenant lean methodology
- Overall (STATE)
- 91 Strongly Landlord-Friendly
- State Idaho
- 91 Strongly Landlord-Friendly · R+18
- County
- — inherits STATE
- City
- — inherits STATE
ZIP-level market 83544
- Home prices YoY
- -18.4%
- Active inventory
- 81
- Price-to-rent
- 6.1×
Monthly cashflow live
- Estimated rent
- $1,169 medium interval (Pro) →
- Mortgage (P&I)
- −$446
- Tax est. 1.5%
- −$106 /mo · $1,275/yr
- Insurance
- −$35
- HOA
- −$425
- Vacancy / Maint / Mgmt
- −$245
- Net cashflow
- $-89
Break-even live
UW: 25.0% down · 7.5% · 30yr · 1.5% tax · 5.0% vac · 8.0% maint · 8.0% mgmt
Financing live
Cash to close
- Down payment
- $21,250
- Closing costs
- $2,550
- Reserves months
- —
- Total cash needed
- —
Loan-product check · same deal, 3 products live
Conventional
25% down · 7.5% · 30yr
- Down + closing
- —
- Monthly P&I
- —
- Monthly cashflow
- —
- DSCR
- —
- Eligible?
- —
Personal DTI + credit; lowest rate.
DSCR
20% down · 8.5% · 30yr
- Down + closing
- —
- Monthly P&I
- —
- Monthly cashflow
- —
- DSCR
- —
- Eligible?
- —
No personal income docs; deal must DSCR.
Hard money
10% down · 12.0% · 12mo
- Down + closing
- —
- Monthly P&I
- —
- Monthly cashflow
- —
- DSCR
- —
- Eligible?
- —
Short-term bridge; refi at stabilization.
HOA detail
- Monthly dues
- $425 · $5,100/yr
Listing history 2 events
-
2026-05-08status Pending
-
2026-02-06$85,000 Active
ⓘ Source: listings_history table (triggers on properties + properties_extension) + one-shot
backfill from property_details.listing_events for pre-trigger history.
Nearby sold comps map
Loading sold comps map…
Walkable amenities ~0.75 mi
Loading nearby amenities…
Taxation est. · year 1
- Rental income
- $14,028
- − Mortgage interest
- −$4,761
- − Property taxes
- −$1,275
- − Insurance
- −$425
- − Repairs & maintenance
- −$1,122
- − Management
- −$1,122
- − HOA
- −$5,100
- − Depreciation
- −$2,473
- Taxable loss
- −$2,250
- Est. tax savings @ 24.0%
- +$540
- After-tax cash flow
- $-527/yr
For passive investors: Depreciation is non-cash, so a rental often shows a tax loss while cash-flowing — sheltering income. Rental losses are passive: they offset passive income freely, and up to $25,000/yr can offset ordinary (W-2) income if you actively participate and your MAGI is under $100k (phasing out to $0 by $150k); unused losses carry forward. On sale, claimed depreciation is recaptured at up to 25%, and gains may owe capital-gains tax (a 1031 exchange can defer both). Figures are a year-1 estimate at your 24.0% rate — not tax advice; consult a CPA.
Schools (NCES district)
- District
- Orofino Joint District
- NCES district ID
- 1602520
- Math proficiency
- 37% ▼ -4.00%
- Reading proficiency
- 56% ▲ 3.00%
- Median HH income
- $41,114
- Composite
- 38.96/100
- National rank
- #4079
- State rank
- #45 of 92 in ID
Livability — Orofino
- Score
- 76/100
- State rank
- #27
- US rank
- #3806
Category grades
Schools grade is shown separately in the Schools card above.
Census & demographics
- Population (ZIP)
- 6,476
Population outlook (Clearwater County) Hauer SSP2
- Today (2025)
- 8,244 people
- By 2030
- 8,093 · -1.8%
- By 2040
- 7,821 · -5.1%
- By 2050
- 7,740 · -6.1%
- By 2075
- 7,777 · -5.7%
- By 2100
- 6,982 · -15.3%
Race, ethnicity, and origin ACS 2023
- Neighborhood character
- Predominantly White (87%)
- Race & ethnicity
- White 87% Two or more races 7% Hispanic / Latino 5% Asian 1% Native American 1%
- Hispanic origin (detail)
- Mexican 4%
- Common ancestry
- Slovak 4% Lithuanian 3% Portuguese 2%
- Foreign-born
- 3% · Canada
- Languages at home
- 97% English-only · Spanish 2% Tagalog/Filipino 1%
Political lean MEDSL · Clearwater
- 2024 margin
- Solid R (+62.8) · D 17.5% · R 80.3% · Other 2.1%
- 2008→2024 swing
- -28.1pp toward R · 2008: -34.8pp · 2024: -62.8pp
- All cycles
- 2024: R+62.8 2020: R+58.3 2016: R+56.5 2012: R+40.8 2008: R+34.8
Not yet ingested
- Civics
- —
Market trends
- HPI YoY
- ▼ -68.58%
- Current HPI
- 304.5259
- Rent YoY
- —
- Metro
- —
- State GDP YoY
- ▲ 4.51%
- F500 in state
- 6
Industry mix (Fortune 500 HQ in ID)
| Industry | F500 HQs | Revenue |
|---|---|---|
| Retail | 1 | $79B |
|
||
| Technology | 1 | $25B |
|
||
| Food / Agriculture | 1 | $6B |
|
||
Price history
2 events — show timeline
- 2026-05-08 Pending — IMLS
- 2026-02-06 Listed $85,000 IMLS
Cash-flow waterfall
monthlySold comps — $/sqft
last 12 mo · ≤1 miLoading sold comps…