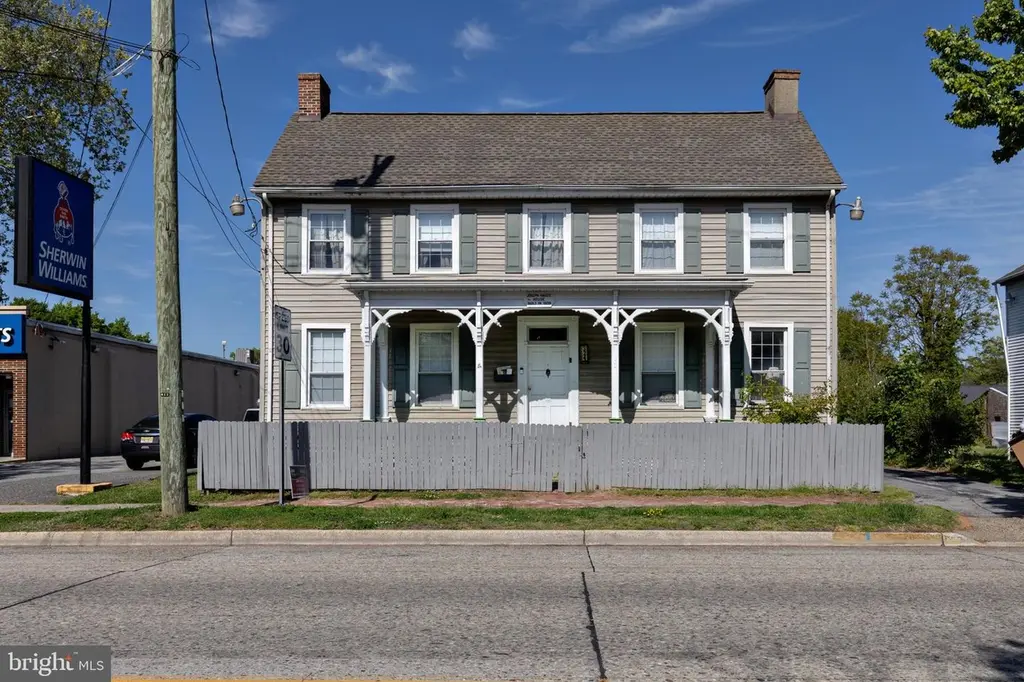
324 E Broadway · Salem, NJ
Flood risk 4/10 · Minor
- FEMA flood zone
- X (unshaded)
- Chance of flooding over 30 yrs
- 0.13%
- Est. flood insurance / yr
- $507 – $1,088
Fire risk 3/10 · Minor
- Est. fire insurance / yr
- $526 – $976
Heat risk 8/10 · Major
- Hot days now (above 103°F)
- 7 days/yr
- Hot days in 30 yrs
- 15 days/yr
Wind risk 6/10 · Moderate
- Chance of severe wind over 30 yrs
- 27.0%
Air-quality risk 3/10 · Minor
- Unhealthy air days now
- 2 days/yr
- Unhealthy air days in 30 yrs
- 4 days/yr
Risk factors via First Street. Map © Google.
Why this score? — see what drove the C+ grade
The composite is a weighted blend of 9 inputs, each scored 0–100. Each bar is that input's sub-score; the figure is the points it added to the 100-point composite (weight × sub-score).
- Cash flow +21.1/30.0
- ARV discount +15.0/15.0
- 1% rule +7.5/10.0
- DSCR +6.7/10.0
- Appreciation +4.8/10.0
- Livability +3.1/5.0
- Rent growth +2.5/5.0
- Condition / age +2.5/5.0
- Schools +1.2/10.0
$175,000
🖨 Deal sheet 📄 Offer letter ✓ Due diligence
Key facts
- 6,599 sq ft lot
- Garage
- Built 1809
Property features AI
Exterior
- Parking: Detached front-entry garage (1 car); Driveway; On-street parking
- Utilities: Public sewer; Private/community water
- Home design: Detached property; Above-grade finished living area recorded
- Construction: Frame construction; Brick/mortar foundation; Above- and below-grade structures
- Exterior features: Lot dimensions approximately 40 x 165; Not in a federal flood zone; Pets allowed (dogs and cats OK)
Interior
- Kitchen: Kitchen (appliances not specified)
- Bedrooms: Three bedrooms on the upper level; One bedroom on the main level
- Bathrooms: Three full bathrooms (two full baths on upper level, one full bath on main level)
- Heating & cooling: Baseboard hot water heating; Window cooling units (electric)
- Interior features: Living room; Dining room; Office; Attic; Full basement; Two fireplaces
- Laundry & utility: Hot water: Electric
Neighborhood map
What this means for you Summary
Snapshot
- This is a 4-bed/3.0-bath single-family listed at $175k.
Deal economics
- At list price, monthly cash flow is $248 ($3k/yr) — positive.
- The deal already cash-flows at list — no discount required.
- Meets the 1% rule at list price ($2k rent vs $175k).
Location & tenants
- Location reads 61/100 on livability (#462 in NJ) — a middle-class / working-renter tenant base. Strengths: cost of living A+, health & safety A+, crime B; Watch: schools D, amenities F, commute F.
- Salem City School District (town): math 6% / reading 24% proficiency, ranked #464 of 472 in NJ (top 98%) — low school quality limits family demand, transient renter base, plan for 1-2y turnover; 85% free/reduced lunch — lower-income household profile, screen leases tightly.
- Market conditions: 100 active listings in the ZIP; 1 comparable units currently listed for rent nearby; 95 units permitted in Salem County in 2024 (0 in 5+ unit buildings).
- At $2,179/mo this rent would consume 48% of the median local household income ($55k/yr) (locally 663% of renters already pay >50% of income on rent) — very limited rent-growth headroom before tenants either downsize or default.
Forward outlook
- In year one you build about $545 of equity ($1k loan paydown + $-665 appreciation (-0.4% local appreciation)).
- Salem County population projected at -23% by 2050 — secular population decline; favor cash flow + early exit over multi-decade hold.
- At projected returns (-0.4% appreciation + 3.0% rent growth), your $49k cash investment doubles in ~9 years — after that, you're playing with house money.
Negotiation context
- Only 10 days on market — expect competitive offers; lowballing is unlikely to land.
- 7 sale attempts since 15y ago with the ask held roughly flat each time — persistent listings suggest the price (not the market) is what's stuck; bring a comps-based counter.
- Current owner paid $75k; list at $175k implies a 133% gain — meaningful room to come down on a strong offer.
Risks & watch-outs
- Watch-outs: property tax is 3.3% of price; built in 1809 — expect roof / HVAC / electrical / plumbing capex.
- Climate carrying-cost: major wind risk, 27% chance of damaging wind over 30y; extreme-heat days projected 7→15/yr by 2055 (HVAC capex compounding) — expect insurance premiums to compound above CPI over the hold.
Questions for the listing agent
- Built in 1809 — when were the roof, HVAC, electrical panel, plumbing, and water heater last replaced?
- Property tax is high relative to price — has the assessment been appealed recently, and will the sale trigger a re-assessment?
- Is there a deadline driving the sale (1031 exchange, divorce, estate, relocation)? That informs how much negotiation room exists.
- Schools are D-rated, which usually means shorter tenancies and higher turnover. Who's the typical renter profile here, and what's been the actual vacancy rate?
- What's the average days-on-market for RENTAL listings here right now (not sales)? A rising rental-DOM trend means longer vacancies and softer asking-rent achievability than the comps imply.
- What's the recent tenant-quality profile in this submarket — average credit score on applications, eviction rate, late-payment / NSF rate, and stable-employment percentage? A property-management company in the area should have these aggregated.
- How much new for-sale + rental construction is in the pipeline within 1–3 miles? Heavy new supply typically softens prices + rents 12–24 months out; constrained supply supports both.
Investment metrics
- 1% rule
- 1.25% ✓
- Cap rate
- 8.00%
- Cash-on-cash
- 6.08%
- DSCR
- 1.27
- GRM
- 6.7
CMA / ARV
- ARV (on-the-fly)
- $231,840
- Comps found
- 12
Show comp detail 12 sales within ~0.75 mi
| Address | Dist | Beds/Ba | Sqft | Sold | Price | $/sf | Match |
|---|---|---|---|---|---|---|---|
| 19 Olive St | 0.12mi | 3/2.0 (-1) | 2,529 (+0%) | 16mo | $133,000 | $53 | 71 |
| 63 Seventh St | 0.53mi | 4/2.5 | 2,441 (-3%) | 0mo | $104,000 | $43 | 68 |
| 10 Davis Ave | 0.25mi | 5/2.0 (+1) | 2,685 (+6%) | 4mo | $249,999 | $93 | 65 |
| 349 E Broadway | 0.06mi | 5/2.0 (+1) | 2,348 (-7%) | 16mo | $65,000 | $28 | 64 |
| 26 Olive St | 0.13mi | 4/1.0 | 2,164 (-14%) | 3mo | $200,000 | $92 | 60 |
| 337 Craven Ave | 0.10mi | 5/2.0 (+1) | 2,205 (-12%) | 9mo | $306,000 | $139 | 58 |
| 154 Seventh St | 0.35mi | 4/2.0 | 2,692 (+7%) | 12mo | $45,000 | $17 | 58 |
| 35 Walnut St | 0.29mi | 4/1.5 | 2,278 (-10%) | 9mo | $180,000 | $79 | 57 |
| 49 Market St | 0.57mi | 5/2.5 (+1) | 2,459 (-2%) | 10mo | $247,000 | $100 | 54 |
| 61 Eighth St | 0.53mi | 4/2.5 | 2,344 (-7%) | 11mo | $230,000 | $98 | 53 |
| 168 Cook Ave | 0.67mi | 4/3.0 | 2,720 (+8%) | 9mo | $275,000 | $101 | 48 |
| 56 New Market St | 0.34mi | 4/1.5 | 2,240 (-11%) | 15mo | $50,000 | $22 | 47 |
Match score weights: distance 35% · size 25% · config 20% · recency 20%. Top-matched comps best support the ARV.
Projected returns pro-forma
-0.38% appreciation · 3.0% rent growth · sell at horizon
- IRR
- 3.4%
- Equity multiple
- 1.16×
- Total profit
- $7,797
- Equity at exit
- $47,513
- IRR
- 9.3%
- Equity multiple
- 1.97×
- Total profit
- $47,471
- Equity at exit
- $54,541
Cash invested: $49,000 (down + closing). Projections, not guarantees.
Landlord ↔ Tenant lean methodology
- Overall (STATE)
- 21 Tenant-Leaning
- State New Jersey
- 21 Tenant-Leaning · D+6
- County
- — inherits STATE
- City
- — inherits STATE
ZIP-level market 08079
- Home prices YoY
- -0.1%
- Active inventory
- 100
- Price-to-rent
- 6.7×
Monthly cashflow live
- Estimated rent
- $2,179 medium interval (Pro) →
- Mortgage (P&I)
- −$918
- Tax from tax record
- −$482 /mo · $5,789/yr
- Insurance
- −$73
- HOA
- −$0
- Vacancy / Maint / Mgmt
- −$458
- Net cashflow
- $248
Break-even live
UW: 25.0% down · 7.5% · 30yr · 1.5% tax · 5.0% vac · 8.0% maint · 8.0% mgmt
Financing live
Cash to close
- Down payment
- $43,750
- Closing costs
- $5,250
- Reserves months
- —
- Total cash needed
- —
Loan-product check · same deal, 3 products live
Conventional
25% down · 7.5% · 30yr
- Down + closing
- —
- Monthly P&I
- —
- Monthly cashflow
- —
- DSCR
- —
- Eligible?
- —
Personal DTI + credit; lowest rate.
DSCR
20% down · 8.5% · 30yr
- Down + closing
- —
- Monthly P&I
- —
- Monthly cashflow
- —
- DSCR
- —
- Eligible?
- —
No personal income docs; deal must DSCR.
Hard money
10% down · 12.0% · 12mo
- Down + closing
- —
- Monthly P&I
- —
- Monthly cashflow
- —
- DSCR
- —
- Eligible?
- —
Short-term bridge; refi at stabilization.
Rent comps 1 comps
| Address | Beds | Baths | Sqft | Rent | $/sqft | DOM | Units | Dist |
|---|---|---|---|---|---|---|---|---|
| 332 E Broadway Salem, NJ | 3.0 | 2.0 | 1844 | $1,980 | $1.07 | 43d | 1 | 0.01mi |
Listing history 19 events
-
2026-05-15status Pending
-
2026-05-04$175,000 Active
-
2025-09-30historical
-
2025-02-23$185,000 Active
-
2025-01-31historical
-
2025-01-25price $185,000
-
2024-09-17status Active
-
2024-08-28status Pending
-
2024-05-08$210,000 Active
-
2012-05-03soldstatus $75,000
-
2012-04-13soldstatus $36,500
-
2012-04-13soldstatus $36,500 Sold
-
2012-03-15status Under Contract
-
2012-03-15historical
-
2012-03-02historical
-
2012-02-29historical
-
2011-09-26$45,900
-
2011-09-26status Active
-
2011-09-26$45,900 Active
ⓘ Source: listings_history table (triggers on properties + properties_extension) + one-shot
backfill from property_details.listing_events for pre-trigger history.
Tax reassessment forecast NJ · Partial reset (capped growth)
- Current annual tax
- $5,789 · $482/mo
- Projected year-2 tax
- $5,789 · $482/mo
- Expected delta
- $0/yr ($0/mo · 0.0%)
ⓘ Screening estimate from a state-policy table — verify with the county assessor before closing.
Climate risk First Street
- Flood 4/10 Moderate FEMA zone X (unshaded) · 13% chance over 30 yrs
- Wildfire 3/10 Moderate
- Heat 8/10 Severe 7 d/yr ≥103°F today · 15 d/yr by 30 yrs out
- Wind 6/10 Major 27% chance of damaging wind over 30 yrs
- Air quality 3/10 Moderate 2 unhealthy d/yr today · 4 by 30 yrs out
Nearby sold comps map
Loading sold comps map…
Walkable amenities ~0.75 mi
Loading nearby amenities…
Taxation est. · year 1
- Rental income
- $26,150
- − Mortgage interest
- −$9,803
- − Property taxes
- −$5,789
- − Insurance
- −$875
- − Repairs & maintenance
- −$2,092
- − Management
- −$2,092
- − Depreciation
- −$5,091
- Taxable income
- $408
- Est. tax owed @ 24.0%
- −$98
- After-tax cash flow
- $2,884/yr
For passive investors: Depreciation is non-cash, so a rental often shows a tax loss while cash-flowing — sheltering income. Rental losses are passive: they offset passive income freely, and up to $25,000/yr can offset ordinary (W-2) income if you actively participate and your MAGI is under $100k (phasing out to $0 by $150k); unused losses carry forward. On sale, claimed depreciation is recaptured at up to 25%, and gains may owe capital-gains tax (a 1031 exchange can defer both). Figures are a year-1 estimate at your 24.0% rate — not tax advice; consult a CPA.
Schools (NCES district)
- District
- Salem City School District
- NCES district ID
- 3414550
- Math proficiency
- 6% ▼ -1.00%
- Reading proficiency
- 24% ▲ 2.00%
- Median HH income
- $27,118
- Composite
- 11.51/100
- National rank
- #9702
- State rank
- #464 of 472 in NJ
Livability — Salem
- Score
- 61/100
- State rank
- #462
- US rank
- #17533
Category grades
Schools grade is shown separately in the Schools card above.
Census & demographics
- Census place
- Salem, NJ
- County
- Salem County · 24,175 people
- City population
- 10,762
- Metro
- Philadelphia-Camden-Wilmington, PA-NJ-DE-MD
- Population (ZIP)
- 10,762
- Household income
- $54,641
- Rent vs Own
- Severe rent burden
- 663.0
Population outlook (Salem County) Hauer SSP2
- Today (2025)
- 59,905 people
- By 2030
- 57,351 · -4.3%
- By 2040
- 51,837 · -13.5%
- By 2050
- 46,356 · -22.6%
- By 2075
- 36,452 · -39.2%
- By 2100
- 28,907 · -51.7%
Race, ethnicity, and origin ACS 2023
- Neighborhood character
- Diverse neighborhood (Simpson 0.55)
- Race & ethnicity
- White 59% Black 31% Hispanic / Latino 6% Two or more races 5% Asian 1%
- Hispanic origin (detail)
- Puerto Rican 5%
- Common ancestry
- Romanian 3% Lithuanian 2% Italian 1%
- Foreign-born
- 2% · Canada
- Languages at home
- 94% English-only · Spanish 4% Tagalog/Filipino 1%
Political lean MEDSL · Salem
- 2024 margin
- R (+19.2) · D 39.6% · R 58.8% · Other 1.6%
- 2008→2024 swing
- -23.1pp toward R · 2008: 3.9pp · 2024: -19.2pp
- All cycles
- 2024: R+19.2 2020: R+12.8 2016: R+15.4 2012: D+0.8 2008: D+3.9
Not yet ingested
- Civics
- —
Market trends
- HPI YoY
- ▼ -0.38%
- Current HPI
- 258.0047
- Rent YoY
- —
- Metro
- Philadelphia-Camden-Wilmington, PA-NJ-DE-MD
- State GDP YoY
- ▲ 2.05%
- F500 in state
- 34
Industry mix (Fortune 500 HQ in NJ)
| Industry | F500 HQs | Revenue |
|---|---|---|
| Consumer Goods | 3 | $31B |
|
||
| Pharmaceuticals | 2 | $153B |
|
||
| Technology | 2 | $21B |
|
||
| Insurance | 2 | $20B |
|
||
| Healthcare | 2 | $19B |
|
||
| Financial Services | 1 | $70B |
|
||
Price history
+281.3% since first listed19 events — show timeline
- 2026-05-15 Pending — BRIGHT MLS
- 2026-05-04 Listed $175,000 BRIGHT MLS
- 2025-09-30 Listing Removed — BRIGHT MLS
- 2025-02-23 Listed $185,000 BRIGHT MLS
- 2025-01-31 Listing Removed — BRIGHT MLS
- 2025-01-25 Price Changed $185,000 BRIGHT MLS
- 2024-09-17 Relisted — BRIGHT MLS
- 2024-08-28 Pending — BRIGHT MLS
- 2024-05-08 Listed $210,000 BRIGHT MLS
- 2012-05-03 Sold (Public Records) $75,000 Public Records
- 2012-04-13 Sold (MLS) $36,500 TREND
- 2012-04-13 Sold (MLS) $36,500 BRIGHT MLS
- 2012-03-15 Pending — TREND
- 2012-03-15 Delisted — TREND
- 2012-03-02 Listing Removed — BRIGHT MLS
- 2012-02-29 Delisted — TREND
- 2011-09-26 Listed $45,900 TREND
- 2011-09-26 Relisted — TREND
- 2011-09-26 Listed $45,900 BRIGHT MLS
Property tax history
+0.3%/yrLatest (2025): $5,789 · +4.9% YoY. Source: county tax records.
Cash-flow waterfall
monthlySold comps — $/sqft
last 12 mo · ≤1 miLoading sold comps…