 Multi-family
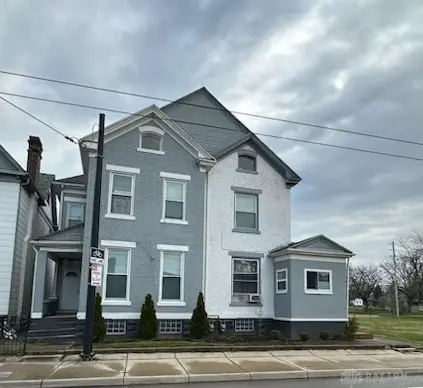
324 & 328 Warren St #324 · Dayton, OH
Flood risk 6/10 · Moderate
- FEMA flood zone
- X (unshaded)
- Chance of flooding over 30 yrs
- 0.75%
- Est. flood insurance / yr
- $473 – $860
Fire risk 1/10 · Minimal
- Est. fire insurance / yr
- $713 – $1,323
Heat risk 4/10 · Minor
- Hot days now (above 102°F)
- 7 days/yr
- Hot days in 30 yrs
- 18 days/yr
Wind risk 2/10 · Minimal
- Chance of severe wind over 30 yrs
- 0.0%
Air-quality risk 3/10 · Minor
- Unhealthy air days now
- 3 days/yr
- Unhealthy air days in 30 yrs
- 5 days/yr
Risk factors via First Street. Map © Google.
Why this score? — see what drove the B grade
The composite is a weighted blend of 9 inputs, each scored 0–100. Each bar is that input's sub-score; the figure is the points it added to the 100-point composite (weight × sub-score).
- Cash flow +30.0/30.0
- 1% rule +10.0/10.0
- DSCR +10.0/10.0
- ARV discount +9.3/15.0
- Condition / age +3.8/5.0
- Rent growth +3.5/5.0
- Livability +3.2/5.0
- Schools +1.3/10.0
- Appreciation +0.0/10.0
$435,000
🖨 Deal sheet 📄 Offer letter ✓ Due diligence
Multi-family units
County records classify this as Multi-Family (5+ Unit). Listing-text estimate: 1 unit. estimate disagrees with records
5+ unit building — per-unit beds/baths from public records are typically unavailable; the breakdown below (if shown) is an estimate from the listing text.
Listing remarks
Are you looking for passive income that makes sense? This property is ready to go with lots of opportunity. This duplex home has been transformed into an 8-bed boarding house with two additional studio apartments. Each side of the home serves as a four-bedroom boarding house with a studio apartment in the rear of each. A total of 10 rentable units!! The studio apartments rent for $800 and $850 and the eight rooms at the boarding house each rent for $600. Property historically keeps long-term renters. Detached garage can also be rented offering additional income potential. Close to Miami Valley Hospital and the University of Dayton. The possibilities are endless. Updated HVAC, windows and p
Key facts
- Duplex home
- Updated windows
- Updated paint
Tags
Property features AI
Finance
- Financial info: Gross rental income reported at $76,800; Offered for sale
Exterior
- Parking: Detached two-car garage
- Utilities: Has heating
- Home design: Two-story property; Multiple zoning
- Exterior features: Irregular-shaped lot
Interior
- Kitchen: Two main-level kitchens
- Bedrooms: Multiple bedrooms located on main and second levels
- Bathrooms: Four full bathrooms (two on the main level)
- Heating & cooling: Baseboard heating
- Interior features: Partially finished basement
Neighborhood map
What this means for you Summary
Snapshot
- This is a 10-bed/4.0-bath multifamily listed at $435k. Condition is rated good.
Deal economics
- At list price, monthly cash flow is $6k ($73k/yr) — positive.
- The deal already cash-flows at list — no discount required.
- Meets the 1% rule at list price ($11k rent vs $435k).
- Recommended offer: $422k (3.0% below list) — sets the bar for market timing.
- Cap rate 23.0% vs local median 7.4% in Dayton — top-decile yield for the area; either an underpriced asset or a hidden risk that comps aren't pricing in. Stress-test before assuming the spread holds.
Location & tenants
- Location reads 65/100 on livability (#716 in OH) — a middle-class / working-renter tenant base. Strengths: cost of living A+, housing A+, health & safety A; Watch: schools C-, amenities C-, crime F.
- Dayton City (urban): math 12% / reading 21% proficiency, ranked #641 of 656 in OH (top 98%) — low school quality limits family demand, transient renter base, plan for 1-2y turnover; 74% free/reduced lunch — lower-income household profile, screen leases tightly.
- Market conditions: Rents rising (+4.0%/yr); 83 active listings in the ZIP; 907 units permitted in Montgomery County in 2024 (416 in 5+ unit buildings).
- At $11,461/mo this rent would consume 284% of the median local household income ($48k/yr) (locally 404% of renters already pay >50% of income on rent) — very limited rent-growth headroom before tenants either downsize or default.
Forward outlook
- Local home prices are declining (-3.0%/yr); year-one equity from $3k of loan paydown is wiped out by about $13k of value loss. Plan a longer hold.
- Montgomery County population projected at -10% by 2050 — secular population decline; favor cash flow + early exit over multi-decade hold.
- At projected returns (-3.0% appreciation + 4.0% rent growth), your $122k cash investment doubles in ~2 years — after that, you're playing with house money.
Negotiation context
- It's been on market 41 days — a 3% lower offer ($422k) is reasonable based on typical stale-listing flexibility.
- 2 sale attempts with the ask held roughly flat each time — persistent listings suggest the price (not the market) is what's stuck; bring a comps-based counter.
Risks & watch-outs
- Watch-outs: built in 1919 — expect roof / HVAC / electrical / plumbing capex.
- Climate carrying-cost: major flood risk — expect insurance premiums to compound above CPI over the hold.
Questions for the listing agent
- It's been on market 41 days. Have you received any prior offers? Is the seller open to a 3% concession, seller financing, or rate buy-down credit?
- Built in 1919 — when were the roof, HVAC, electrical panel, plumbing, and water heater last replaced?
- Is there a deadline driving the sale (1031 exchange, divorce, estate, relocation)? That informs how much negotiation room exists.
- Crime grade is F in this area — have there been break-ins, vandalism, or insurance claims at this property in the last 3 years? What carrier currently insures it and at what premium?
- What's the average days-on-market for RENTAL listings here right now (not sales)? A rising rental-DOM trend means longer vacancies and softer asking-rent achievability than the comps imply.
- What's the recent tenant-quality profile in this submarket — average credit score on applications, eviction rate, late-payment / NSF rate, and stable-employment percentage? A property-management company in the area should have these aggregated.
- How much new apartment / multifamily construction is in the pipeline within 1–3 miles? Heavy new supply (>2% of stock underway) typically softens rents 12–24 months out; light construction supports rent growth.
Investment metrics
- 1% rule
- 2.63% ✓
- Cap rate
- 22.98%
- Cash-on-cash
- 59.59%
- DSCR
- 3.65
- GRM
- 3.2
CMA / ARV
- ARV (median comp)
- $453,526
- List price
- $435,000
- Delta
- -4.08%
- Verdict
- FAIR
- Comps
- 1 within 2.0 mi
Projected returns pro-forma
-3.0% appreciation · 3.98% rent growth · sell at horizon
- IRR
- 59.4%
- Equity multiple
- 3.68×
- Total profit
- $326,295
- Equity at exit
- $64,860
- IRR
- 64.5%
- Equity multiple
- 7.80×
- Total profit
- $828,610
- Equity at exit
- $37,611
Cash invested: $121,800 (down + closing). Projections, not guarantees.
Landlord ↔ Tenant lean methodology
- Overall (STATE)
- 73 Landlord-Friendly
- State Ohio
- 73 Landlord-Friendly · R+6
- County
- — inherits STATE
- City
- — inherits STATE
ZIP-level market 45402
- Rents YoY
- 4.0%
- Active inventory
- 83
- Price-to-rent
- 25.9×
Monthly cashflow live
- Estimated rent
- $11,461 medium interval (Pro) →
- Mortgage (P&I)
- −$2,281
- Tax est. 1.5%
- −$544 /mo · $6,525/yr
- Insurance
- −$181
- HOA
- −$0
- Vacancy / Maint / Mgmt
- −$2,407
- Net cashflow
- $6,048
Break-even live
10-unit breakdown (identical units grouped — click to expand)
| Units | Beds | Baths | Est. rent |
|---|---|---|---|
| 4× units | 4 | 1 | $5,604 |
| #1 | 4 | 1 | $1,401 |
| #2 | 4 | 1 | $1,401 |
| #3 | 4 | 1 | $1,401 |
| #4 | 4 | 1 | $1,401 |
| 6× units | 1 | 1 | $5,856 |
| #5 | 1 | 1 | $976 |
| #6 | 1 | 1 | $976 |
| #7 | 1 | 1 | $976 |
| #8 | 1 | 1 | $976 |
| #9 | 1 | 1 | $976 |
| #10 | 1 | 1 | $976 |
| Total (10 units) | $11,461 | ||
UW: 25.0% down · 7.5% · 30yr · 1.5% tax · 5.0% vac · 8.0% maint · 8.0% mgmt
Financing live
Cash to close
- Down payment
- $108,750
- Closing costs
- $13,050
- Reserves months
- —
- Total cash needed
- —
Loan-product check · same deal, 3 products live
Conventional
25% down · 7.5% · 30yr
- Down + closing
- —
- Monthly P&I
- —
- Monthly cashflow
- —
- DSCR
- —
- Eligible?
- —
Personal DTI + credit; lowest rate.
DSCR
20% down · 8.5% · 30yr
- Down + closing
- —
- Monthly P&I
- —
- Monthly cashflow
- —
- DSCR
- —
- Eligible?
- —
No personal income docs; deal must DSCR.
Hard money
10% down · 12.0% · 12mo
- Down + closing
- —
- Monthly P&I
- —
- Monthly cashflow
- —
- DSCR
- —
- Eligible?
- —
Short-term bridge; refi at stabilization.
Listing history 18 events
-
2026-06-18days on market $435,000 Active 41 DOM
-
2026-06-17days on market $435,000 Active 40 DOM
-
2026-06-16days on market $435,000 Active 39 DOM
-
2026-06-15days on market $435,000 Active 38 DOM
-
2026-06-14days on market $435,000 Active 36 DOM
-
2026-06-13days on market $435,000 Active 35 DOM
-
2026-06-10days on market $435,000 Active 33 DOM
-
2026-06-09days on market $435,000 Active 32 DOM
-
2026-06-08days on market $435,000 Active 31 DOM
-
2026-06-07days on market $435,000 Active 30 DOM
-
2026-06-05days on market $435,000 Active 27 DOM
-
2026-06-03days on market $435,000 Active 26 DOM
-
2026-06-02days on market $435,000 Active 25 DOM
-
2026-06-01days on market $435,000 Active 24 DOM
-
2026-05-31days on market $435,000 Active 23 DOM
-
2026-05-07$435,000 Active 726-char remark
-
2026-04-15historical
-
2025-10-15$449,500 Active
ⓘ Source: listings_history table (triggers on properties + properties_extension) + one-shot
backfill from property_details.listing_events for pre-trigger history.
Climate risk First Street
- Flood 6/10 Major FEMA zone X (unshaded) · 75% chance over 30 yrs
- Wildfire 1/10 Low
- Heat 4/10 Moderate 7 d/yr ≥102°F today · 18 d/yr by 30 yrs out
- Wind 2/10 Low 0% chance of damaging wind over 30 yrs
- Air quality 3/10 Moderate 3 unhealthy d/yr today · 5 by 30 yrs out
Nearby sold comps map
Loading sold comps map…
Walkable amenities ~0.75 mi
Loading nearby amenities…
Taxation est. · year 1
- Rental income
- $137,532
- − Mortgage interest
- −$24,367
- − Property taxes
- −$6,525
- − Insurance
- −$2,175
- − Repairs & maintenance
- −$11,003
- − Management
- −$11,003
- − Depreciation
- −$12,655
- Taxable income
- $69,806
- Est. tax owed @ 24.0%
- −$16,753
- After-tax cash flow
- $55,823/yr
For passive investors: Depreciation is non-cash, so a rental often shows a tax loss while cash-flowing — sheltering income. Rental losses are passive: they offset passive income freely, and up to $25,000/yr can offset ordinary (W-2) income if you actively participate and your MAGI is under $100k (phasing out to $0 by $150k); unused losses carry forward. On sale, claimed depreciation is recaptured at up to 25%, and gains may owe capital-gains tax (a 1031 exchange can defer both). Figures are a year-1 estimate at your 24.0% rate — not tax advice; consult a CPA.
Condition & rehab AI · 10 photos
This multi-family home is in good condition with cosmetic updates needed to modernize the kitchen and bathrooms. It has a good roof and foundation, and is located in a desirable location.
Repairs flagged
- Minor kitchen cabinets — dated and could be replaced
- Minor bathroom fixtures — dated and could be replaced
Value-add opportunities
- Both update kitchen cabinets and countertops — modernizing the kitchen would appeal to both buyers and renters
- Both update bathroom fixtures — modernizing the bathrooms would appeal to both buyers and renters
- Both paint interior walls — painting the interior walls would improve the home's curb appeal and make it more inviting
Renovation cost estimate screening
| Repair item | Severity | Est. cost |
|---|---|---|
| kitchen cabinets · dated and could be replaced | Minor | $500–3,000 |
| bathroom fixtures · dated and could be replaced | Minor | $500–3,000 |
| Total estimated repair cost · 2 items | $1,000–6,000 |
Value-add ROI direction
- Both update kitchen cabinets and countertops — modernizing the kitchen would appeal to both buyers and renters ↑
- Both update bathroom fixtures — modernizing the bathrooms would appeal to both buyers and renters ↑
- Both paint interior walls — painting the interior walls would improve the home's curb appeal and make it more inviting ↑
ⓘ Cost ranges are severity-bucket heuristics (US national rule-of-thumb). Get contractor quotes + a written scope before underwriting a rehab budget.
Schools (NCES district)
- District
- Dayton City
- NCES district ID
- 3904384
- Math proficiency
- 12% ▼ -12.00%
- Reading proficiency
- 21% ▼ -11.00%
- Median HH income
- $28,688
- Composite
- 12.94/100
- National rank
- #9579
- State rank
- #641 of 656 in OH
Livability — Dayton
- Score
- 65/100
- State rank
- #716
- US rank
- #12895
Category grades
Schools grade is shown separately in the Schools card above.
Census & demographics
- Census place
- Dayton, OH
- County
- Montgomery County · 459,541 people
- City population
- 164,387
- Metro
- Dayton-Kettering, OH
- Population (ZIP)
- 9,407
- Household income
- $48,401
- Rent vs Own
- Severe rent burden
- 404.0
Population outlook (Montgomery County) Hauer SSP2
- Today (2025)
- 523,241 people
- By 2030
- 514,948 · -1.6%
- By 2040
- 493,378 · -5.7%
- By 2050
- 469,639 · -10.2%
- By 2075
- 418,360 · -20.0%
- By 2100
- 353,315 · -32.5%
Race, ethnicity, and origin ACS 2023
- Neighborhood character
- Diverse neighborhood (Simpson 0.57)
- Race & ethnicity
- Black 57% White 32% Two or more races 7% Hispanic / Latino 5%
- Hispanic origin (detail)
- Mexican 1%
- Common ancestry
- Italian 2% Serbian 2% Slovak 1%
- Foreign-born
- 5% · Canada, Vietnam, Jamaica
- Languages at home
- 94% English-only · Spanish 4% Other Asian/Pacific 1% Arabic 1%
Political lean MEDSL · Montgomery
- 2024 margin
- Toss-up / Even · D 49.8% · R 49.3%
- 2008→2024 swing
- -5.8pp toward R · 2008: 6.2pp · 2024: 0.5pp
- All cycles
- 2024: D+0.5 2020: D+2.2 2016: R+1.2 2012: D+3.1 2008: D+6.2
Not yet ingested
- Civics
- —
Market trends
- HPI YoY
- ▼ -81.89%
- Current HPI
- 149.7909
- Rent YoY
- ▲ 3.98%
- Metro
- Dayton-Kettering, OH
- State GDP YoY
- ▲ 1.98%
- F500 in state
- 48
Industry mix (Fortune 500 HQ in OH)
| Industry | F500 HQs | Revenue |
|---|---|---|
| Insurance | 3 | $145B |
|
||
| Industrial Machinery | 3 | $49B |
|
||
| Financial Services | 3 | $24B |
|
||
| Consumer Goods | 2 | $93B |
|
||
| Aerospace / Defense | 2 | $47B |
|
||
| Utilities | 2 | $33B |
|
||
Price history
-3.2% since first listed3 events — show timeline
- 2026-05-07 Listed $435,000 Dayton MLS
- 2026-04-15 Listing Removed — Dayton MLS
- 2025-10-15 Listed $449,500 Dayton MLS
Cash-flow waterfall
monthlySold comps — $/sqft
last 12 mo · ≤1 miLoading sold comps…