4801 W County Road 38e #4 · Fort Collins, CO
Flood risk 1/10 · Minimal
- FEMA flood zone
- X (unshaded)
- Chance of flooding over 30 yrs
- 0.0%
- Est. flood insurance / yr
- $507 – $1,088
Fire risk 8/10 · Major
- Est. fire insurance / yr
- $939 – $1,743
Heat risk 2/10 · Minimal
- Hot days now (above 90°F)
- 8 days/yr
- Hot days in 30 yrs
- 22 days/yr
Wind risk 1/10 · Minimal
- Chance of severe wind over 30 yrs
- —
Air-quality risk 4/10 · Minor
- Unhealthy air days now
- 5 days/yr
- Unhealthy air days in 30 yrs
- 5 days/yr
Risk factors via First Street. Map © Google.
Why this score? — see what drove the C grade
The composite is a weighted blend of 9 inputs, each scored 0–100. Each bar is that input's sub-score; the figure is the points it added to the 100-point composite (weight × sub-score).
- Cash flow +24.2/30.0
- DSCR +7.8/10.0
- ARV discount +7.5/15.0
- 1% rule +6.3/10.0
- Schools +4.5/10.0
- Livability +4.0/5.0
- Rent growth +2.9/5.0
- Condition / age +2.5/5.0
- Appreciation +0.0/10.0
$199,900
🖨 Deal sheet 📄 Offer letter ✓ Due diligence
Listing remarks
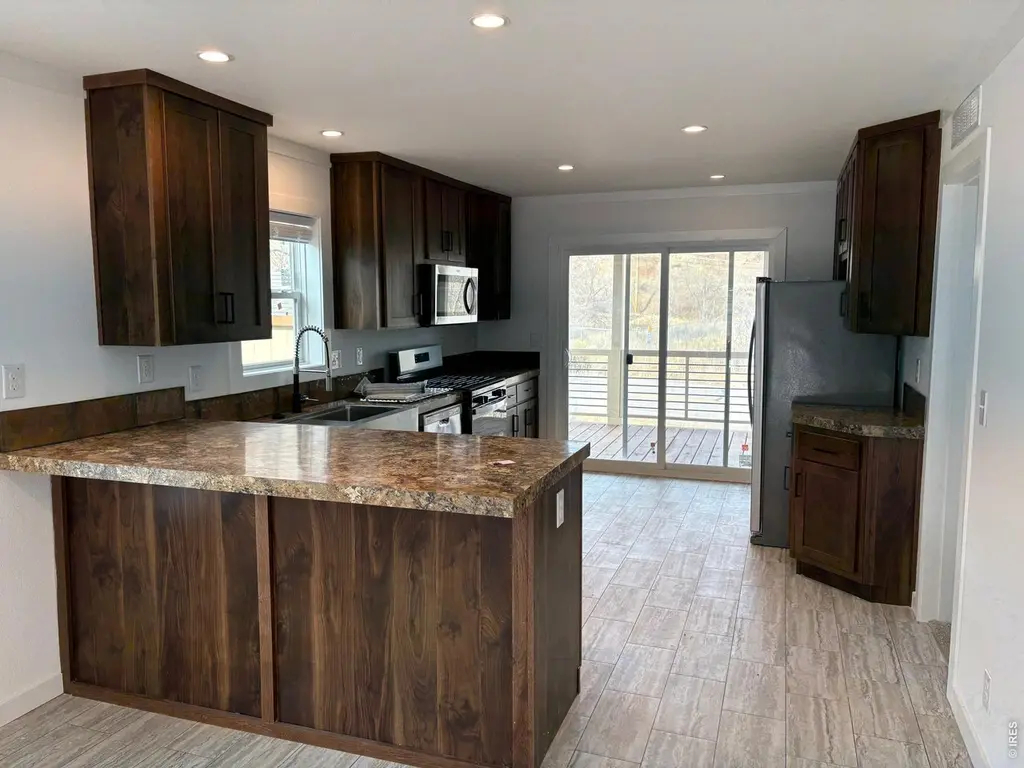
New Home in unique manufactured home community near Inlet Bay at Horsetooth Reservoir. Enjoy quiet mountain living close to Horsetooth Reservoir and Horsetooth Mountain Open Space. New 1,166 sq. ft. 3 Bedroom with 1 3/4 Bathrooms, Energy Star Certified and Champion Homes 7 year warranty. Monthly site fee only $850 per month. Picture sitting on your covered porch enjoying the sunset over the red rocks. Hiking and Biking trails, picnic spots and water sports & fishing just minutes away. Walk to the Horsetooth Inn for dinner and live entertainment.
Key facts
- Covered porch
- Picnic spots
- Fishing
Tags
Property features AI
Finance
- Other: Minimal flood risk / C rating
- HOA & community: No association fees or transfer fees
Exterior
- Parking: No garage; No designated parking features
- Utilities: District water (meter installed); No water rights; Electricity available; Propane gas; Trash service: Foothills MHC
- Home design: Manufactured in-park home; Manufactured home
- Construction: Frame construction; Composition roof; Post and pier foundation
- Exterior features: Storage structure on property; Native grass; Rolling lot; Paved driveway/approach; Property faces southwest; Gravel road access; County-maintained road
Interior
- Kitchen: Gas range; Dishwasher; Microwave; Garbage disposal
- Bedrooms: 3 bedrooms
- Bathrooms: 1 full bathroom; 1 three-quarter bathroom
- Heating & cooling: Forced air heating
- Interior features: Open floorplan; Window coverings; Fire alarm
Neighborhood map
What this means for you Summary
Snapshot
- This is a 3-bed/1.0-bath manufactured listed at $200k.
Deal economics
- At list price, monthly cash flow is $399 ($5k/yr) — positive.
- The deal already cash-flows at list — no discount required.
- Meets the 1% rule at list price ($2k rent vs $200k).
- Recommended offer: $182k (9.0% below list) — sets the bar for market timing.
- Cap rate 8.7% vs local median 2.6% in Fort Collins — top-decile yield for the area; either an underpriced asset or a hidden risk that comps aren't pricing in. Stress-test before assuming the spread holds.
Location & tenants
- Location reads 80/100 on livability (#11 in CO, #1,750 nationally) — a professional / high-income tenant draw. Strengths: amenities A+, commute A+, health & safety A+; Watch: cost of living F.
- Poudre School District R-1 (urban): math 45% / reading 60% proficiency, ranked #10 of 86 in CO (top 12%) — acceptable for families but not a draw, mixed tenant base, ~2y average lease.
- Zoned schools: Mcgraw Elementary School (math 52% / reading 62%, grade C+, #115 of 966 statewide, top 14%, 395 students, 27% FRL); Rocky Mountain High School (math 46% / reading 69%, grade C, #68 of 381 statewide, top 18%, 2,069 students, 27% FRL) — zoned schools at 27% FRL track the district average.
- Market conditions: Rents rising (+1.5%/yr); 170 active listings in the ZIP; 1 comparable units currently listed for rent nearby; solid renter incomes; 1,786 units permitted in Larimer County in 2024 (402 in 5+ unit buildings).
- This rent runs 30% of the median local income ($89k/yr) — at the standard rent-burdened threshold; future hikes will face affordability resistance.
Forward outlook
- Local home prices are declining (-3.0%/yr); year-one equity from $1k of loan paydown is wiped out by about $6k of value loss. Plan a longer hold.
- Larimer County population projected at +51% by 2050 — long-run rental-demand tailwind backs the buy-and-hold thesis.
Negotiation context
- It's been on market 94 days — a 9% lower offer ($182k) is reasonable based on typical stale-listing flexibility.
Risks & watch-outs
- Climate carrying-cost: severe wildfire risk — expect insurance premiums to compound above CPI over the hold.
Questions for the listing agent
- It's been on market 94 days. Have you received any prior offers? Is the seller open to a 9% concession, seller financing, or rate buy-down credit?
- Why hasn't it sold? Are there any deal-killer items the seller is aware of (foundation, flood, title, zoning, code violations)?
- Is there a deadline driving the sale (1031 exchange, divorce, estate, relocation)? That informs how much negotiation room exists.
- Schools are B-rated — typically a magnet for longer-tenancy family renters. What's the average tenant stay here, and is there a school-zone premium baked into asking?
- What's the average days-on-market for RENTAL listings here right now (not sales)? A rising rental-DOM trend means longer vacancies and softer asking-rent achievability than the comps imply.
- What's the recent tenant-quality profile in this submarket — average credit score on applications, eviction rate, late-payment / NSF rate, and stable-employment percentage? A property-management company in the area should have these aggregated.
- How much new for-sale + rental construction is in the pipeline within 1–3 miles? Heavy new supply typically softens prices + rents 12–24 months out; constrained supply supports both.
Investment metrics
- 1% rule
- 1.13% ✓
- Cap rate
- 8.69%
- Cash-on-cash
- 8.55%
- DSCR
- 1.38
- GRM
- 7.4
CMA / ARV
- ARV (on-the-fly)
- $126,336
- Comps found
- 1
Show comp detail 1 sale within ~0.75 mi
| Address | Dist | Beds/Ba | Sqft | Sold | Price | $/sf | Match |
|---|---|---|---|---|---|---|---|
| 4801 W County Road 38e #2 | 0.00mi | 2/2.0 (-1) | 970 (+8%) | 8mo | $136,900 | $141 | 70 |
Match score weights: distance 35% · size 25% · config 20% · recency 20%. Top-matched comps best support the ARV.
Projected returns pro-forma
-3.0% appreciation · 1.46% rent growth · sell at horizon
- IRR
- -5.1%
- Equity multiple
- 0.81×
- Total profit
- $-10,409
- Equity at exit
- $29,806
- IRR
- 2.7%
- Equity multiple
- 1.18×
- Total profit
- $10,084
- Equity at exit
- $17,284
Cash invested: $55,972 (down + closing). Projections, not guarantees.
Landlord ↔ Tenant lean methodology
- Overall (STATE)
- 38 Tenant-Leaning
- State Colorado
- 38 Tenant-Leaning · D+4
- County
- — inherits STATE
- City
- — inherits STATE
ZIP-level market 80526
- Rents YoY
- 1.5%
- Active inventory
- 170
- Price-to-rent
- 7.4×
Monthly cashflow live
- Estimated rent
- $2,253 medium interval (Pro) →
- Mortgage (P&I)
- −$1,048
- Tax est. 1.5%
- −$250 /mo · $2,998/yr
- Insurance
- −$83
- HOA
- −$0
- Vacancy / Maint / Mgmt
- −$473
- Net cashflow
- $399
Break-even live
UW: 25.0% down · 7.5% · 30yr · 1.5% tax · 5.0% vac · 8.0% maint · 8.0% mgmt
Financing live
Cash to close
- Down payment
- $49,975
- Closing costs
- $5,997
- Reserves months
- —
- Total cash needed
- —
Loan-product check · same deal, 3 products live
Conventional
25% down · 7.5% · 30yr
- Down + closing
- —
- Monthly P&I
- —
- Monthly cashflow
- —
- DSCR
- —
- Eligible?
- —
Personal DTI + credit; lowest rate.
DSCR
20% down · 8.5% · 30yr
- Down + closing
- —
- Monthly P&I
- —
- Monthly cashflow
- —
- DSCR
- —
- Eligible?
- —
No personal income docs; deal must DSCR.
Hard money
10% down · 12.0% · 12mo
- Down + closing
- —
- Monthly P&I
- —
- Monthly cashflow
- —
- DSCR
- —
- Eligible?
- —
Short-term bridge; refi at stabilization.
Rent comps 1 comps
| Address | Beds | Baths | Sqft | Rent | $/sqft | DOM | Units | Dist |
|---|---|---|---|---|---|---|---|---|
| 4332 Edith Dr Fort Collins, CO | 2.0 | 1.0 | 1102 | $2,800 | $2.54 | 13d | 1 | 0.56mi |
Listing history 15 events
-
2026-06-18days on market $199,900 Active 94 DOM
-
2026-06-17days on market $199,900 Active 93 DOM
-
2026-06-16days on market $199,900 Active 92 DOM
-
2026-06-15days on market $199,900 Active 91 DOM
-
2026-06-14days on market $199,900 Active 89 DOM
-
2026-06-10days on market $199,900 Active 86 DOM
-
2026-06-09days on market $199,900 Active 85 DOM
-
2026-06-08days on market $199,900 Active 84 DOM
-
2026-06-07days on market $199,900 Active 83 DOM
-
2026-06-03days on market $199,900 Active 79 DOM
-
2026-06-02days on market $199,900 Active 78 DOM
-
2026-06-01days on market $199,900 Active 77 DOM
-
2026-05-31days on market $199,900 Active 76 DOM
-
2026-05-30days on market $199,900 Active 75 DOM
-
2026-03-16$199,900 Active
ⓘ Source: listings_history table (triggers on properties + properties_extension) + one-shot
backfill from property_details.listing_events for pre-trigger history.
Climate risk First Street
- Flood 1/10 Low FEMA zone X (unshaded) · 0% chance over 30 yrs
- Wildfire 8/10 Severe
- Heat 2/10 Low 8 d/yr ≥90°F today · 22 d/yr by 30 yrs out
- Wind 1/10 Low
- Air quality 4/10 Moderate 5 unhealthy d/yr today · 5 by 30 yrs out
Nearby sold comps map
Loading sold comps map…
Walkable amenities ~0.75 mi
Loading nearby amenities…
Taxation est. · year 1
- Rental income
- $27,039
- − Mortgage interest
- −$11,198
- − Property taxes
- −$2,998
- − Insurance
- −$1,000
- − Repairs & maintenance
- −$2,163
- − Management
- −$2,163
- − Depreciation
- −$5,815
- Taxable income
- $1,702
- Est. tax owed @ 24.0%
- −$408
- After-tax cash flow
- $4,375/yr
For passive investors: Depreciation is non-cash, so a rental often shows a tax loss while cash-flowing — sheltering income. Rental losses are passive: they offset passive income freely, and up to $25,000/yr can offset ordinary (W-2) income if you actively participate and your MAGI is under $100k (phasing out to $0 by $150k); unused losses carry forward. On sale, claimed depreciation is recaptured at up to 25%, and gains may owe capital-gains tax (a 1031 exchange can defer both). Figures are a year-1 estimate at your 24.0% rate — not tax advice; consult a CPA.
Schools (NCES district)
- District
- Poudre School District R-1
- NCES district ID
- 0803990
- Math proficiency
- 45% ▼ -7.00%
- Reading proficiency
- 60% ▼ -2.00%
- Median HH income
- $57,281
- Composite
- 45.5/100
- National rank
- #2610
- State rank
- #10 of 86 in CO
Livability — Fort Collins
- Score
- 80/100
- State rank
- #11
- US rank
- #1750
Category grades
Schools grade is shown separately in the Schools card above.
Census & demographics
- County
- Larimer County · 338,255 people
- City population
- 202,303
- Metro
- Fort Collins, CO
- Population (ZIP)
- 44,326
- Household income
- $88,686
- Rent vs Own
- Severe rent burden
- 2386.0
Population outlook (Larimer County) Hauer SSP2
- Today (2025)
- 415,361 people
- By 2030
- 457,762 · +10.2%
- By 2040
- 542,310 · +30.6%
- By 2050
- 627,048 · +51.0%
- By 2075
- 833,722 · +100.7%
- By 2100
- 952,590 · +129.3%
Race, ethnicity, and origin ACS 2023
- Neighborhood character
- Predominantly White (80%)
- Race & ethnicity
- White 80% Hispanic / Latino 12% Two or more races 10% Asian 2%
- Hispanic origin (detail)
- Mexican 8%
- Common ancestry
- Italian 4% Slovak 4% Romanian 4%
- Foreign-born
- 5% · Canada, China, Vietnam
- Languages at home
- 93% English-only · Spanish 5% Other Indo-European 1%
Political lean MEDSL · Larimer
- 2024 margin
- D (+17.6) · D 57.4% · R 39.8% · Other 2.9%
- 2008→2024 swing
- +7.9pp toward D · 2008: 9.7pp · 2024: 17.6pp
- All cycles
- 2024: D+17.6 2020: D+15.4 2016: D+4.9 2012: D+5.2 2008: D+9.7
Not yet ingested
- Civics
- —
Market trends
- HPI YoY
- ▼ -437.47%
- Current HPI
- 280.4791
- Rent YoY
- ▲ 1.46%
- Metro
- Fort Collins, CO
- State GDP YoY
- ▲ 1.95%
- F500 in state
- 14
Industry mix (Fortune 500 HQ in CO)
| Industry | F500 HQs | Revenue |
|---|---|---|
| Technology Distribution | 1 | $31B |
|
||
| Food / Agriculture | 1 | $18B |
|
||
| Packaging | 1 | $14B |
|
||
| Healthcare | 1 | $13B |
|
||
| Energy | 1 | $10B |
|
||
| Technology | 1 | $4B |
|
||
Price history
1 event — show timeline
- 2026-03-16 Listed $199,900 IRES
Property tax history
+2.7%/yrLatest (2021): $31 · -3.1% YoY. Source: county tax records.
Cash-flow waterfall
monthlySold comps — $/sqft
last 12 mo · ≤1 miLoading sold comps…