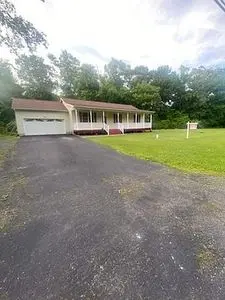
2428 Edwards Ln · Bel Air South, MD
Flood risk 1/10 · Minimal
- FEMA flood zone
- X (unshaded)
- Chance of flooding over 30 yrs
- 0.0%
- Est. flood insurance / yr
- $507 – $1,088
Fire risk 3/10 · Minor
- Est. fire insurance / yr
- $755 – $1,403
Heat risk 6/10 · Moderate
- Hot days now (above 105°F)
- 7 days/yr
- Hot days in 30 yrs
- 15 days/yr
Wind risk 6/10 · Moderate
- Chance of severe wind over 30 yrs
- 27.0%
Air-quality risk 3/10 · Minor
- Unhealthy air days now
- 2 days/yr
- Unhealthy air days in 30 yrs
- 3 days/yr
Risk factors via First Street. Map © Google.
Why this score? — see what drove the B- grade
The composite is a weighted blend of 9 inputs, each scored 0–100. Each bar is that input's sub-score; the figure is the points it added to the 100-point composite (weight × sub-score).
- Cash flow +28.1/30.0
- DSCR +10.0/10.0
- 1% rule +7.0/10.0
- Appreciation +6.2/10.0
- Livability +4.1/5.0
- ARV discount +3.1/15.0
- Schools +2.9/10.0
- Rent growth +2.5/5.0
- Condition / age +2.5/5.0
$374,900
🖨 Deal sheet 📄 Offer letter ✓ Due diligence
Listing remarks
Country Rancher setting on a corner lot. Spacey 2-car garage. Finished deck and unfinished basement. New roof replaced in 2025! Centrally located to Bel Air, Aberdeen, Havre De Grace, and 10 minutes from I-95.
Key facts
- Unfinished basement
- Centrally located
- Corner lot
Tags
Neighborhood map
What this means for you Summary
Snapshot
- This is a 3-bed/2.0-bath single-family listed at $375k.
Deal economics
- At list price, monthly cash flow is $1k ($14k/yr) — positive.
- The deal already cash-flows at list — no discount required.
- Meets the 1% rule at list price ($4k rent vs $375k).
- Recommended offer: $369k (1.5% below list) — sets the bar for market timing.
- Cap rate 10.1% vs local median 4.1% in Bel Air South — top-decile yield for the area; either an underpriced asset or a hidden risk that comps aren't pricing in. Stress-test before assuming the spread holds.
Location & tenants
- Location reads 82/100 on livability (#33 in MD, #1,172 nationally) — a professional / high-income tenant draw. Strengths: employment A+, housing A+, health & safety A+; Watch: crime D, cost of living D.
- Harford County Public Schools (suburban): math 22% / reading 39% proficiency, ranked #9 of 24 in MD (top 38%) — families likely to look elsewhere, expect single-tenant / working-renter base with shorter leases.
- Market conditions: 9 active listings in the ZIP; 1 comparable units currently listed for rent nearby; 803 units permitted in Harford County in 2024 (26 in 5+ unit buildings).
Forward outlook
- In year one you build about $12k of equity ($3k loan paydown + $9k appreciation (2.4% local appreciation)).
- At projected returns (2.4% appreciation + 3.0% rent growth), your $105k cash investment doubles in ~4 years — after that, you're playing with house money.
- By year 4, paydown + projected appreciation supports a ~$40k cash-out refi (75% LTV) — recoverable capital for the next deal without selling this one.
Negotiation context
- It's been on market 16 days — a 2% lower offer ($369k) is reasonable based on typical stale-listing flexibility.
- 5 sale attempts since 23y ago with the ask held roughly flat each time — persistent listings suggest the price (not the market) is what's stuck; bring a comps-based counter.
Risks & watch-outs
- Climate carrying-cost: major wind risk, 27% chance of damaging wind over 30y; extreme-heat days projected 7→15/yr by 2055 (HVAC capex compounding) — expect insurance premiums to compound above CPI over the hold.
Questions for the listing agent
- Is there a deadline driving the sale (1031 exchange, divorce, estate, relocation)? That informs how much negotiation room exists.
- Schools are B-rated — typically a magnet for longer-tenancy family renters. What's the average tenant stay here, and is there a school-zone premium baked into asking?
- Crime grade is D in this area — have there been break-ins, vandalism, or insurance claims at this property in the last 3 years? What carrier currently insures it and at what premium?
- What's the average days-on-market for RENTAL listings here right now (not sales)? A rising rental-DOM trend means longer vacancies and softer asking-rent achievability than the comps imply.
- What's the recent tenant-quality profile in this submarket — average credit score on applications, eviction rate, late-payment / NSF rate, and stable-employment percentage? A property-management company in the area should have these aggregated.
- How much new for-sale + rental construction is in the pipeline within 1–3 miles? Heavy new supply typically softens prices + rents 12–24 months out; constrained supply supports both.
Investment metrics
- 1% rule
- 1.20% ✓
- Cap rate
- 10.07%
- Cash-on-cash
- 13.49%
- DSCR
- 1.60
- GRM
- 6.9
CMA / ARV
- ARV (on-the-fly)
- $341,320
- Comps found
- 1
Show comp detail 1 sale within ~0.75 mi
| Address | Dist | Beds/Ba | Sqft | Sold | Price | $/sf | Match |
|---|---|---|---|---|---|---|---|
| 612 Calvary Rd | 0.64mi | 3/1.0 | 1,300 (+1%) | 6mo | $345,000 | $265 | 60 |
Match score weights: distance 35% · size 25% · config 20% · recency 20%. Top-matched comps best support the ARV.
Projected returns pro-forma
2.43% appreciation · 3.0% rent growth · sell at horizon
- IRR
- 18.8%
- Equity multiple
- 2.04×
- Total profit
- $108,963
- Equity at exit
- $156,585
- IRR
- 20.6%
- Equity multiple
- 3.83×
- Total profit
- $296,919
- Equity at exit
- $232,381
Cash invested: $104,972 (down + closing). Projections, not guarantees.
Landlord ↔ Tenant lean methodology
- Overall (STATE)
- 27 Tenant-Leaning
- State Maryland
- 27 Tenant-Leaning · D+14
- County
- — inherits STATE
- City
- — inherits STATE
ZIP-level market 21028
- Home prices YoY
- 0.9%
- Active inventory
- 9
- Price-to-rent
- 6.9×
Monthly cashflow live
- Estimated rent
- $4,500 medium interval (Pro) →
- Mortgage (P&I)
- −$1,966
- Tax from tax record
- −$253 /mo · $3,038/yr
- Insurance
- −$156
- HOA
- −$0
- Vacancy / Maint / Mgmt
- −$945
- Net cashflow
- $1,180
Break-even live
UW: 25.0% down · 7.5% · 30yr · 1.5% tax · 5.0% vac · 8.0% maint · 8.0% mgmt
Financing live
Cash to close
- Down payment
- $93,725
- Closing costs
- $11,247
- Reserves months
- —
- Total cash needed
- —
Loan-product check · same deal, 3 products live
Conventional
25% down · 7.5% · 30yr
- Down + closing
- —
- Monthly P&I
- —
- Monthly cashflow
- —
- DSCR
- —
- Eligible?
- —
Personal DTI + credit; lowest rate.
DSCR
20% down · 8.5% · 30yr
- Down + closing
- —
- Monthly P&I
- —
- Monthly cashflow
- —
- DSCR
- —
- Eligible?
- —
No personal income docs; deal must DSCR.
Hard money
10% down · 12.0% · 12mo
- Down + closing
- —
- Monthly P&I
- —
- Monthly cashflow
- —
- DSCR
- —
- Eligible?
- —
Short-term bridge; refi at stabilization.
Rent comps 1 comps
| Address | Beds | Baths | Sqft | Rent | $/sqft | DOM | Units | Dist |
|---|---|---|---|---|---|---|---|---|
| 309 Calvary Rd Churchville, MD | 3.0 | 1.5 | 1373 | $4,500 | $3.28 | 43d | 1 | 0.82mi |
Listing history 11 events
-
2026-06-18days on market $374,900 Active 16 DOM
-
2026-06-17days on market $374,900 Active 15 DOM
-
2026-06-16days on market $374,900 Active 14 DOM
-
2026-06-15days on market $374,900 Active 13 DOM
-
2026-06-13days on market $374,900 Active 11 DOM
-
2026-06-09days on market $374,900 Active 7 DOM
-
2026-06-08days on market $374,900 Active 6 DOM
-
2026-06-07days on market $374,900 Active 5 DOM
-
2026-06-04days on market $374,900 Active 2 DOM
-
2026-06-02remarks 209-char remark
-
2026-06-02$374,900 Active 1 DOM
ⓘ Source: listings_history table (triggers on properties + properties_extension) + one-shot
backfill from property_details.listing_events for pre-trigger history.
Tax reassessment forecast MD · Partial reset (capped growth)
- Current annual tax
- $3,038 · $253/mo
- Projected year-2 tax
- $3,562 · $297/mo
- Expected delta
- +$524/yr (+$44/mo · 17.3%)
ⓘ Screening estimate from a state-policy table — verify with the county assessor before closing.
Climate risk First Street
- Flood 1/10 Low FEMA zone X (unshaded) · 0% chance over 30 yrs
- Wildfire 3/10 Moderate
- Heat 6/10 Major 7 d/yr ≥105°F today · 15 d/yr by 30 yrs out
- Wind 6/10 Major 27% chance of damaging wind over 30 yrs
- Air quality 3/10 Moderate 2 unhealthy d/yr today · 3 by 30 yrs out
Nearby sold comps map
Loading sold comps map…
Walkable amenities ~0.75 mi
Loading nearby amenities…
Taxation est. · year 1
- Rental income
- $54,000
- − Mortgage interest
- −$21,000
- − Property taxes
- −$3,038
- − Insurance
- −$1,874
- − Repairs & maintenance
- −$4,320
- − Management
- −$4,320
- − Depreciation
- −$10,906
- Taxable income
- $8,541
- Est. tax owed @ 24.0%
- −$2,050
- After-tax cash flow
- $12,106/yr
For passive investors: Depreciation is non-cash, so a rental often shows a tax loss while cash-flowing — sheltering income. Rental losses are passive: they offset passive income freely, and up to $25,000/yr can offset ordinary (W-2) income if you actively participate and your MAGI is under $100k (phasing out to $0 by $150k); unused losses carry forward. On sale, claimed depreciation is recaptured at up to 25%, and gains may owe capital-gains tax (a 1031 exchange can defer both). Figures are a year-1 estimate at your 24.0% rate — not tax advice; consult a CPA.
Schools (NCES district)
- District
- Harford County Public Schools
- NCES district ID
- 2400390
- Math proficiency
- 22% ▼ -23.00%
- Reading proficiency
- 39% ▼ -12.00%
- Median HH income
- $79,569
- Composite
- 29.38/100
- National rank
- #6527
- State rank
- #9 of 24 in MD
Livability — Bel Air South
- Score
- 82/100
- State rank
- #33
- US rank
- #1172
Category grades
Schools grade is shown separately in the Schools card above.
Census & demographics
- City population
- 63,895
- Population (ZIP)
- 2,872
Population outlook (Harford County) Hauer SSP2
- Today (2025)
- 262,292 people
- By 2030
- 266,437 · +1.6%
- By 2040
- 269,954 · +2.9%
- By 2050
- 265,659 · +1.3%
- By 2075
- 252,886 · -3.6%
- By 2100
- 224,014 · -14.6%
Race, ethnicity, and origin ACS 2023
- Neighborhood character
- Predominantly White (86%)
- Race & ethnicity
- White 86% Two or more races 7% Hispanic / Latino 5% Asian 1% Black 1%
- Hispanic origin (detail)
- Puerto Rican 3%
- Common ancestry
- Romanian 7% Italian 4% Slovak 2%
- Foreign-born
- 3% · China, Canada
- Languages at home
- 96% English-only · German/W. Germanic 2% Spanish 1% Chinese 1%
Political lean MEDSL · Harford
- 2024 margin
- R (+13.8) · D 41.9% · R 55.7% · Other 2.4%
- 2008→2024 swing
- +5.0pp toward D · 2008: -18.8pp · 2024: -13.8pp
- All cycles
- 2024: R+13.8 2020: R+12.0 2016: R+24.5 2012: R+19.5 2008: R+18.8
Not yet ingested
- Civics
- —
Market trends
- HPI YoY
- ▲ 2.43%
- Current HPI
- 263.1997
- Rent YoY
- —
- Metro
- —
- State GDP YoY
- ▲ 2.97%
- F500 in state
- 12
Industry mix (Fortune 500 HQ in MD)
| Industry | F500 HQs | Revenue |
|---|---|---|
| Aerospace / Defense | 1 | $71B |
|
||
| Utilities | 1 | $25B |
|
||
| Hotels | 1 | $24B |
|
||
| Consumer Goods | 1 | $7B |
|
||
| Real Estate | 1 | $6B |
|
||
| Chemicals | 1 | $2B |
|
||
Price history
+837.2% since first listed16 events — show timeline
- 2026-06-03 Listed $374,900 FSBO.com
- 2026-03-04 Listing Removed — BRIGHT MLS
- 2025-12-03 Relisted — BRIGHT MLS
- 2025-11-19 Pending — BRIGHT MLS
- 2025-11-03 Price Changed $369,900 BRIGHT MLS
- 2025-10-13 Price Changed $379,900 BRIGHT MLS
- 2025-09-29 Price Changed $389,900 BRIGHT MLS
- 2025-09-12 Price Changed $399,900 BRIGHT MLS
- 2025-08-29 Listed $409,900 BRIGHT MLS
- 2023-06-23 Sold (Public Records) $350,000 Public Records
- 2003-08-31 Delisted — MRIS
- 2003-03-27 Sold (Public Records) $42,500 Public Records
- 2003-03-08 Listed — MRIS
- 2003-02-28 Sold (MLS) $42,500 MRIS
- 2003-02-17 Delisted — MRIS
- 2003-02-10 Listed $40,000 MRIS
Property tax history
+0.3%/yrLatest (2025): $3,038 · +4.0% YoY. Source: county tax records.
Cash-flow waterfall
monthlySold comps — $/sqft
last 12 mo · ≤1 miLoading sold comps…