 🏗️ New Construction
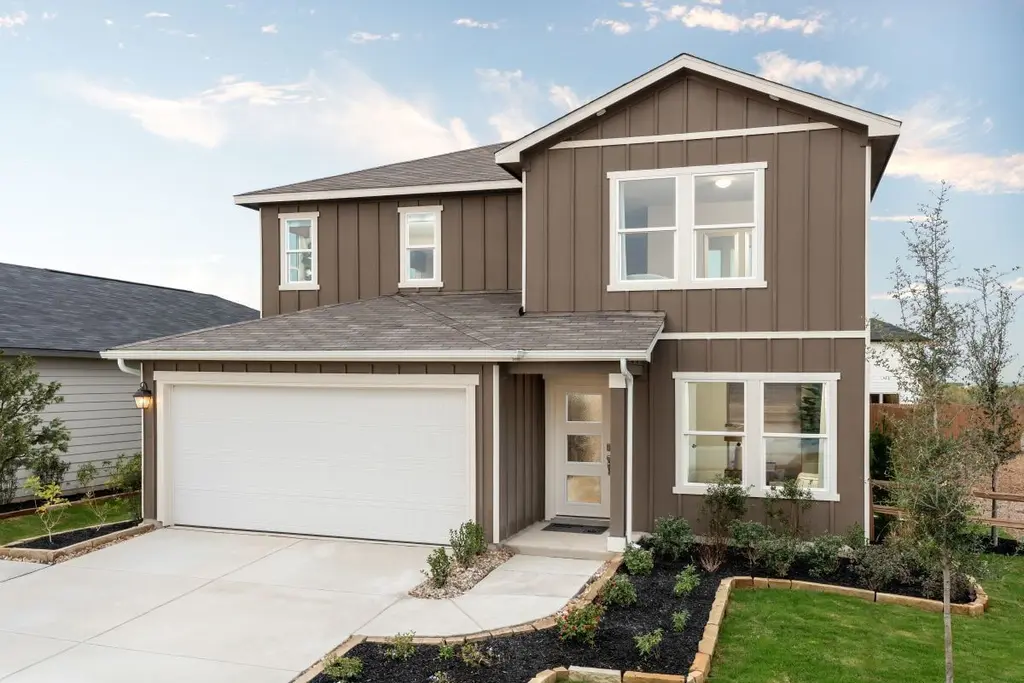
Plan 2702 Modeled Plan · San Antonio, TX
Flood risk 1/10 · Minimal
- FEMA flood zone
- X (unshaded)
- Chance of flooding over 30 yrs
- 0.0%
- Est. flood insurance / yr
- $507 – $1,088
Fire risk 2/10 · Minimal
- Est. fire insurance / yr
- $1,222 – $2,270
Heat risk 8/10 · Major
- Hot days now (above 107°F)
- 7 days/yr
- Hot days in 30 yrs
- 22 days/yr
Wind risk 8/10 · Major
- Chance of severe wind over 30 yrs
- 80.0%
Air-quality risk 2/10 · Minimal
- Unhealthy air days now
- 0 days/yr
- Unhealthy air days in 30 yrs
- 1 days/yr
Risk factors via First Street. Map © Google.
Why this score? — see what drove the F grade
The composite is a weighted blend of 9 inputs, each scored 0–100. Each bar is that input's sub-score; the figure is the points it added to the 100-point composite (weight × sub-score).
- Cash flow +7.5/30.0
- ARV discount +7.5/15.0
- Schools +4.4/10.0
- Livability +4.0/5.0
- Condition / age +4.0/5.0
- 1% rule +2.2/10.0
- Rent growth +2.2/5.0
- DSCR +1.7/10.0
- Appreciation +0.0/10.0
$266,995
🖨 Deal sheet 📄 Offer letter ✓ Due diligence
Listing remarks
* Open floor plan * Upstairs laundry room * Large upstairs linen closet * 3.25-in. finger-joint Colonial baseboards * Downstairs primary suite * Extra storage space * Spacious great room * Walk-in kitchen pantry * Game room * Smart thermostat * Flex Space * ENERGY STAR® certified home * Swimming pool * Playground * Near top-rated schools * Close to popular restaurants * Near entertainment and leisure * Outdoor recreation nearby
Key facts
- Extra storage space
- Open floor plan
- 2 garage spots
Tags
Property features AI
Finance
- Financial info: List price $266,995
Exterior
- Parking: 2 total parking spaces, including 2-car garage
- Home design: Single-family plan (Plan 2702 Modeled)
- Exterior features: Property located at 7711 Inca Dove Way, San Antonio, TX 78253
Interior
- Bedrooms: 4 bedrooms
- Bathrooms: 2 full bathrooms and 1 half bathroom
- Interior features: New construction plan; Living area approximately 2702
Neighborhood map
What this means for you Summary
Snapshot
- This is a 4-bed/2.5-bath single-family listed at $267k. Condition is rated good.
Deal economics
- At list price, monthly cash flow is $-365 ($-4k/yr) — negative.
- To cash-flow at today's rent, offer at most $244k (8.4% below list).
- To meet the 1% rule (rent ≥ 1% of price), the offer needs to be $214k (19.9% below list).
- Recommended offer: $214k (19.9% below list) — sets the bar for 1% rule.
- Cap rate 4.8% vs local median 3.8% in San Antonio — meaningfully above typical; check what's discounted (condition, days-on-market, listing class) to confirm the premium yield is real.
Location & tenants
- Location reads 80/100 on livability (#31 in TX, #1,616 nationally) — a professional / high-income tenant draw. Strengths: amenities A+, commute A+, cost of living A+; Watch: schools C-, crime F.
- Medina Valley ISD (rural): math 48% / reading 53% proficiency, ranked #148 of 826 in TX (top 18%) — acceptable for families but not a draw, mixed tenant base, ~2y average lease.
- Market conditions: Rents soft (-1.1%/yr); 697 active listings in the ZIP; 19 comparable units currently listed for rent nearby; rentals at typical pace (median 24d on market — plan ~3-4 weeks tenant-placement turnaround); 42% of comp listings sitting > 30 days — soft ceiling on asking rent; solid renter incomes; 8,308 units permitted in Bexar County in 2024 (2,506 in 5+ unit buildings).
Forward outlook
- Local home prices are declining (-3.0%/yr); year-one equity from $2k of loan paydown is wiped out by about $9k of value loss. Plan a longer hold.
- Bexar County population projected at +50% by 2050 — long-run rental-demand tailwind backs the buy-and-hold thesis.
Negotiation context
- It's been on market 55 days — a 3% lower offer ($259k) is reasonable based on typical stale-listing flexibility.
Risks & watch-outs
- Climate carrying-cost: severe wind risk, 80% chance of damaging wind over 30y; extreme-heat days projected 7→22/yr by 2055 (HVAC capex compounding) — expect insurance premiums to compound above CPI over the hold.
Questions for the listing agent
- What do current leases actually rent for vs. the listed asking? Can we see a recent rent roll and the last 12 months of T-12 income?
- It's been on market 55 days. Have you received any prior offers? Is the seller open to a 20% concession, seller financing, or rate buy-down credit?
- Is there a deadline driving the sale (1031 exchange, divorce, estate, relocation)? That informs how much negotiation room exists.
- Crime grade is F in this area — have there been break-ins, vandalism, or insurance claims at this property in the last 3 years? What carrier currently insures it and at what premium?
- The area grade is low — what's the realistic commute time and amenity access for the typical tenant pool here? Any planned neighborhood developments (good or bad) we should know about?
- What's the average days-on-market for RENTAL listings here right now (not sales)? A rising rental-DOM trend means longer vacancies and softer asking-rent achievability than the comps imply.
- What's the recent tenant-quality profile in this submarket — average credit score on applications, eviction rate, late-payment / NSF rate, and stable-employment percentage? A property-management company in the area should have these aggregated.
- How much new for-sale + rental construction is in the pipeline within 1–3 miles? Heavy new supply typically softens prices + rents 12–24 months out; constrained supply supports both.
Investment metrics
- 1% rule
- 0.72% ✗
- Cap rate
- 4.82%
- Cash-on-cash
- -5.26%
- DSCR
- 0.77
- GRM
- 11.6
CMA / ARV
- ARV (median comp)
- $297,301
- List price
- $266,995
- Delta
- -10.19%
- Verdict
- UNDERPRICED
- Comps
- 20 within 1.0 mi
Show comp detail 12 sales within ~0.75 mi
| Address | Dist | Beds/Ba | Sqft | Sold | Price | $/sf | Match |
|---|---|---|---|---|---|---|---|
| 7919 Mariposa Mnr | 0.26mi | 4/2.5 | 2,708 (+0%) | 2mo | $315,618 | $117 | 86 |
| 7826 Kingfisher Ldg | 0.09mi | 3/2.5 (-1) | 2,788 (+3%) | 1mo | $292,320 | $105 | 85 |
| 8022 Kingfisher Lndg | 0.27mi | 4/2.5 | 2,719 (+1%) | 5mo | $355,000 | $131 | 82 |
| 7524 Corral Smt | 0.21mi | 5/3.0 (+1) | 2,609 (-3%) | 0mo | $339,490 | $130 | 77 |
| 7517 Corral Smt | 0.21mi | 5/3.0 (+1) | 2,609 (-3%) | 3mo | $327,490 | $126 | 75 |
| 7504 Corral Smt | 0.26mi | 5/3.0 (+1) | 2,609 (-3%) | 4mo | $324,990 | $125 | 72 |
| 8003 Kingfisher Lndg | 0.22mi | 3/2.5 (-1) | 2,880 (+7%) | 2mo | $343,733 | $119 | 72 |
| 7919 Bearcat Fld | 0.59mi | 4/2.5 | 2,696 (-0%) | 1mo | $299,900 | $111 | 71 |
| 14859 Wild Hog | 0.28mi | 4/3.5 | 2,510 (-7%) | 2mo | $299,900 | $119 | 70 |
| 7811 Rock Wren Fall | 0.19mi | 4/2.5 | 2,348 (-13%) | 1mo | $274,745 | $117 | 68 |
| 14751 Prairie Clover | 0.49mi | 4/3.0 | 2,489 (-8%) | 1mo | $385,540 | $155 | 61 |
| 14383 Palm Rdg | 0.62mi | 5/3.0 (+1) | 2,581 (-4%) | 2mo | $324,860 | $126 | 55 |
Match score weights: distance 35% · size 25% · config 20% · recency 20%. Top-matched comps best support the ARV.
Projected returns pro-forma
-3.0% appreciation · 0.0% rent growth · sell at horizon
- IRR
- -28.7%
- Equity multiple
- 0.07×
- Total profit
- $-77,671
- Equity at exit
- $44,329
- IRR
- -45.6%
- Equity multiple
- -0.46×
- Total profit
- $-121,675
- Equity at exit
- $25,705
Cash invested: $83,244 (down + closing). Projections, not guarantees.
Landlord ↔ Tenant lean methodology
- Overall (STATE)
- 87 Strongly Landlord-Friendly
- State Texas
- 87 Strongly Landlord-Friendly · R+5
- County
- — inherits STATE
- City
- — inherits STATE
ZIP-level market 78253
- Home prices YoY
- -33.4%
- Rents YoY
- -1.1%
- Active inventory
- 697
- Price-to-rent
- 10.4×
Monthly cashflow live
- Estimated rent
- $2,138 high interval (Pro) →
- Mortgage (P&I)
- −$1,559
- Tax est. 1.5%
- −$372 /mo · $4,460/yr
- Insurance
- −$124
- HOA
- −$0
- Vacancy / Maint / Mgmt
- −$449
- Net cashflow
- $-365
Break-even live
UW: 25.0% down · 7.5% · 30yr · 1.5% tax · 5.0% vac · 8.0% maint · 8.0% mgmt
Financing live
Cash to close
- Down payment
- $74,325
- Closing costs
- $8,919
- Reserves months
- —
- Total cash needed
- —
Loan-product check · same deal, 3 products live
Conventional
25% down · 7.5% · 30yr
- Down + closing
- —
- Monthly P&I
- —
- Monthly cashflow
- —
- DSCR
- —
- Eligible?
- —
Personal DTI + credit; lowest rate.
DSCR
20% down · 8.5% · 30yr
- Down + closing
- —
- Monthly P&I
- —
- Monthly cashflow
- —
- DSCR
- —
- Eligible?
- —
No personal income docs; deal must DSCR.
Hard money
10% down · 12.0% · 12mo
- Down + closing
- —
- Monthly P&I
- —
- Monthly cashflow
- —
- DSCR
- —
- Eligible?
- —
Short-term bridge; refi at stabilization.
Rent comps 19 comps
| Address | Beds | Baths | Sqft | Rent | $/sqft | DOM | Units | Dist |
|---|---|---|---|---|---|---|---|---|
| 14838 House Wren Fall San Antonio, TX | 5.0 | 3.0 | 2500 | $2,150 | $0.86 | 43d | 1 | 0.19mi |
| 7919 Mariposa Mnr San Antonio, TX | 4.0 | 2.5 | 2708 | $2,450 | $0.90 | 2d | 1 | 0.25mi |
| 7404 Cottontail Clf San Antonio, TX | 4.0 | 2.5 | 2338 | $1,950 | $0.83 | 3d | 1 | 0.32mi |
| 14715 Gecko Lndg San Antonio, TX | 3.0 | 2.0 | 2381 | $1,897 | $0.80 | 43d | 1 | 0.35mi |
| 14507 Gecko Lndg San Antonio, TX | 4.0 | 2.5 | 2805 | $2,150 | $0.77 | 23d | 1 | 0.45mi |
| 14477 Gunsight Pass San Antonio, TX | 3.0 | 2.5 | 1851 | $1,950 | $1.05 | 14d | 1 | 0.54mi |
| 15214 Ohare Lndg San Antonio, TX | 4.0 | 2.5 | 2563 | $2,175 | $0.85 | 3d | 1 | 0.54mi |
| 14537 Flatiron Clf San Antonio, TX | 4.0 | 3.5 | 2501 | $2,500 | $1.00 | 14d | 1 | 0.56mi |
| 15321 Sherwin Oak San Antonio, TX | 3.0 | 2.5 | 1773 | $1,700 | $0.96 | 43d | 1 | 0.58mi |
| 7915 Bonsai Bay San Antonio, TX | 3.0 | 2.5 | 2088 | $1,795 | $0.86 | 43d | 1 | 0.62mi |
| 14374 Elkhorn Crst San Antonio, TX | 5.0 | 3.0 | 2581 | $1,895 | $0.73 | 43d | 1 | 0.65mi |
| 14644 Maple Ter San Antonio, TX | 3.0 | 2.5 | 1826 | $1,799 | $0.99 | 43d | 1 | 0.71mi |
| 14338 Palm Rdg San Antonio, TX | 3.0 | 2.5 | 1826 | $1,779 | $0.97 | 43d | 1 | 0.71mi |
| 14347 Gunsight Pass San Antonio, TX | 3.0 | 2.5 | 1826 | $1,789 | $0.98 | 43d | 1 | 0.78mi |
| 14311 Gila Xing San Antonio, TX | 4.0 | 3.0 | 1912 | $1,850 | $0.97 | 23d | 1 | 0.79mi |
| 14339 Gunsight Pass San Antonio, TX | 4.0 | 3.0 | 1912 | $2,099 | $1.10 | 23d | 1 | 0.79mi |
| 7810 Asp Pt San Antonio, TX | 4.0 | 3.0 | 1912 | $1,900 | $0.99 | 4d | 1 | 0.84mi |
| 15126 Nettleton Ml Unit Nettleton Ml unit San Antonio, TX | 4.0 | 3.0 | 2666 | $2,500 | $0.94 | 21d | 1 | 1.36mi |
| 7003 Anacua Crk San Antonio, TX | 3.0–4.0 | 2.0–3.0 | 1902 | $2,495 | $1.31 | 3d | 8 | 1.44mi |
Listing history 15 events
-
2026-06-18days on market $266,995 Active 55 DOM
-
2026-06-17days on market $266,995 Active 54 DOM
-
2026-06-16days on market $266,995 Active 53 DOM
-
2026-06-15days on market $266,995 Active 52 DOM
-
2026-06-13days on market $266,995 Active 50 DOM
-
2026-06-09days on market $266,995 Active 46 DOM
-
2026-06-08days on market $266,995 Active 45 DOM
-
2026-06-07days on market $266,995 Active 44 DOM
-
2026-06-04days on market $266,995 Active 41 DOM
-
2026-06-03days on market $266,995 Active 40 DOM
-
2026-06-02days on market $266,995 Active 39 DOM
-
2026-06-02days on market $266,995 Active 38 DOM
-
2026-05-31days on market $266,995 Active 37 DOM
-
2026-05-17price $266,995 470-char remark
-
2026-04-24$276,995 Active 470-char remark
ⓘ Source: listings_history table (triggers on properties + properties_extension) + one-shot
backfill from property_details.listing_events for pre-trigger history.
Climate risk First Street
- Flood 1/10 Low FEMA zone X (unshaded) · 0% chance over 30 yrs
- Wildfire 2/10 Low
- Heat 8/10 Severe 7 d/yr ≥107°F today · 22 d/yr by 30 yrs out
- Wind 8/10 Severe 80% chance of damaging wind over 30 yrs
- Air quality 2/10 Low 0 unhealthy d/yr today · 1 by 30 yrs out
Nearby sold comps map
Loading sold comps map…
Walkable amenities ~0.75 mi
Loading nearby amenities…
Taxation est. · year 1
- Rental income
- $25,661
- − Mortgage interest
- −$16,654
- − Property taxes
- −$4,460
- − Insurance
- −$1,487
- − Repairs & maintenance
- −$2,053
- − Management
- −$2,053
- − Depreciation
- −$8,649
- Taxable loss
- −$9,693
- Est. tax savings @ 24.0%
- +$2,326
- After-tax cash flow
- $-2,056/yr
For passive investors: Depreciation is non-cash, so a rental often shows a tax loss while cash-flowing — sheltering income. Rental losses are passive: they offset passive income freely, and up to $25,000/yr can offset ordinary (W-2) income if you actively participate and your MAGI is under $100k (phasing out to $0 by $150k); unused losses carry forward. On sale, claimed depreciation is recaptured at up to 25%, and gains may owe capital-gains tax (a 1031 exchange can defer both). Figures are a year-1 estimate at your 24.0% rate — not tax advice; consult a CPA.
Condition & rehab AI · 12 photos
This home is in excellent condition with modern amenities and a well-maintained exterior. Landscaping and smart home integration would further enhance its value.
Value-add opportunities
- Both landscaping — enhances curb appeal and adds value
- Both smart home integration — increases home's appeal and marketability
Renovation cost estimate screening
Value-add ROI direction
- Both landscaping — enhances curb appeal and adds value ↑
- Both smart home integration — increases home's appeal and marketability ↑
ⓘ Cost ranges are severity-bucket heuristics (US national rule-of-thumb). Get contractor quotes + a written scope before underwriting a rehab budget.
Schools (NCES district)
- District
- Medina Valley ISD
- NCES district ID
- 4830060
- Math proficiency
- 48% ▼ -9.00%
- Reading proficiency
- 53% ▼ -2.00%
- Median HH income
- $60,596
- Composite
- 44.2/100
- National rank
- #2851
- State rank
- #148 of 826 in TX
Livability — San Antonio
- Score
- 80/100
- State rank
- #31
- US rank
- #1616
Category grades
Schools grade is shown separately in the Schools card above.
Census & demographics
- County
- Bexar County · 1,990,555 people
- City population
- 1,806,925
- Metro
- San Antonio-New Braunfels, TX
- Population (ZIP)
- 69,282
- Household income
- $106,373
- Rent vs Own
- Severe rent burden
- 1496.0
Population outlook (Bexar County) Hauer SSP2
- Today (2025)
- 2,336,851 people
- By 2030
- 2,560,728 · +9.6%
- By 2040
- 3,020,569 · +29.3%
- By 2050
- 3,493,522 · +49.5%
- By 2075
- 4,668,459 · +99.8%
- By 2100
- 5,533,242 · +136.8%
Race, ethnicity, and origin ACS 2023
- Neighborhood character
- Diverse neighborhood (Simpson 0.65)
- Race & ethnicity
- Hispanic / Latino 47% White 34% Two or more races 27% Black 9% Asian 4% Native American 2%
- Hispanic origin (detail)
- Mexican 38% Puerto Rican 3%
- Common ancestry
- Italian 2% Lithuanian 1% Romanian 1%
- Foreign-born
- 9% · Canada
- Languages at home
- 73% English-only · Spanish 22% Other Asian/Pacific 1% Tagalog/Filipino 1%
Political lean MEDSL · Bexar
- 2024 margin
- Lean D (+9.8) · D 54.3% · R 44.6% · Other 1.1%
- 2008→2024 swing
- +4.2pp toward D · 2008: 5.6pp · 2024: 9.8pp
- All cycles
- 2024: D+9.8 2020: D+18.2 2016: D+13.5 2012: D+4.6 2008: D+5.6
Not yet ingested
- Civics
- —
Market trends
- HPI YoY
- ▼ -99.92%
- Current HPI
- 199.1827
- Rent YoY
- ▼ -1.10%
- Metro
- San Antonio-New Braunfels, TX
- State GDP YoY
- ▲ 3.95%
- F500 in state
- 110
Industry mix (Fortune 500 HQ in TX)
| Industry | F500 HQs | Revenue |
|---|---|---|
| Energy | 16 | $1,198B |
|
||
| Technology | 5 | $198B |
|
||
| Engineering / Construction | 4 | $72B |
|
||
| Energy Services | 3 | $60B |
|
||
| Utilities | 3 | $41B |
|
||
| Healthcare | 2 | $330B |
|
||
Cash-flow waterfall
monthlySold comps — $/sqft
last 12 mo · ≤1 miLoading sold comps…