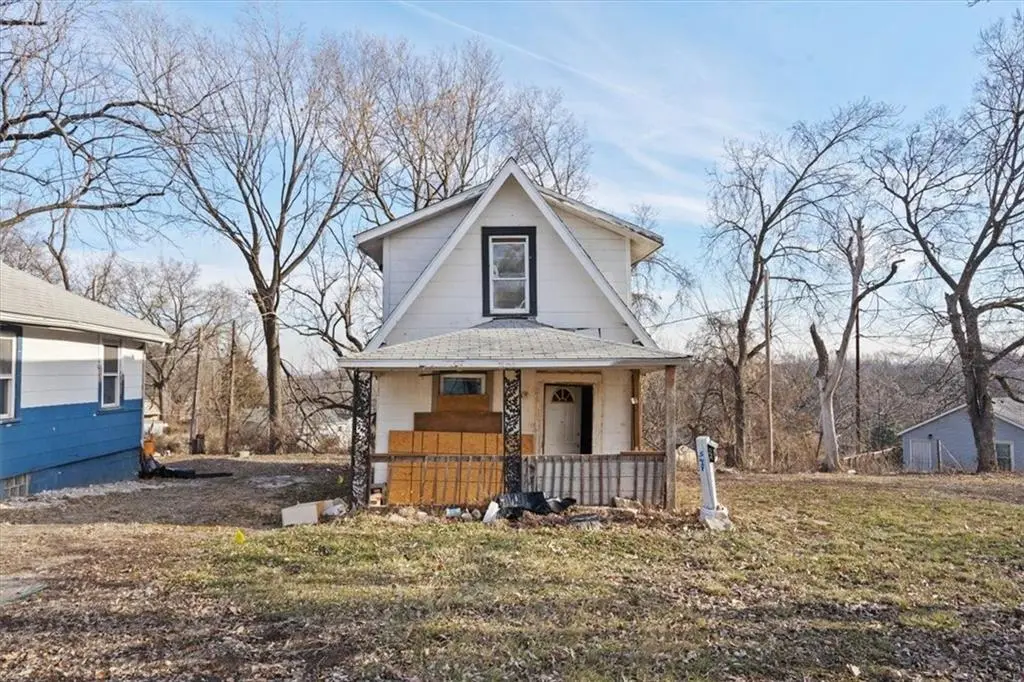
549 Blue Ridge Blvd · Kansas City, MO
Flood risk 1/10 · Minimal
- FEMA flood zone
- X (unshaded)
- Chance of flooding over 30 yrs
- 0.0%
- Est. flood insurance / yr
- $507 – $1,088
Fire risk 3/10 · Minor
- Est. fire insurance / yr
- $1,054 – $1,958
Heat risk 4/10 · Minor
- Hot days now (above 106°F)
- 7 days/yr
- Hot days in 30 yrs
- 16 days/yr
Wind risk 2/10 · Minimal
- Chance of severe wind over 30 yrs
- —
Air-quality risk 3/10 · Minor
- Unhealthy air days now
- 2 days/yr
- Unhealthy air days in 30 yrs
- 3 days/yr
Risk factors via First Street. Map © Google.
Why this score? — see what drove the A grade
The composite is a weighted blend of 9 inputs, each scored 0–100. Each bar is that input's sub-score; the figure is the points it added to the 100-point composite (weight × sub-score).
- Cash flow +30.0/30.0
- ARV discount +15.0/15.0
- 1% rule +10.0/10.0
- DSCR +10.0/10.0
- Appreciation +10.0/10.0
- Livability +3.9/5.0
- Schools +2.7/10.0
- Rent growth +2.5/5.0
- Condition / age +2.5/5.0
$44,500
🖨 Deal sheet 📄 Offer letter ✓ Due diligence
Listing remarks MLS
Opportunity starts here. 549 Blue Ridge Blvd is a larger 2-bedroom home offered at just $44,500, sitting on a rare double lot that adds flexibility and upside rarely found at this price point. Whether you’re planning a full renovation, long-term hold, resale, or future expansion, the additional land creates options that most entry-level investments simply don’t offer. No remodeling has been started, giving investors full control over layout, finishes, and scope. The main level features an open living and kitchen area ready for reconfiguration and modernization. At the rear of the home is a laundry area and a generously sized bathroom footprint. Upstairs offers two bedrooms separated from the main living space. There is no basement. Electrical main service still needs to be run to the building. Renovation will be required, and City of Kansas City, Missouri permits are likely necessary to complete improvements. With the right renovation plan and execution, comparable renovated homes in the area suggest potential after-repair values in the $130,000–$150,000 range. Buyer to verify all assumptions and comparable sales. The double lot provides additional upside potential through expanded yard space, parking improvements, or other creative possibilities. 549 Blue Ridge can be purchased individually or as part of a package with the neighboring property at 547 Blue Ridge Blvd (2601958), offering a rare chance to control side-by-side assets for scale and long-term upside. Property should be considered an active construction site. Enter at your own risk and take appropriate precautions. Seller will accept as-is offers only with box 2 or 3 checked on the form.
Key facts
- Laundry area
- Parking improvements
- Double lot
Tags
Neighborhood map
What this means for you Summary
Snapshot
- This is a 2-bed/1.0-bath single-family listed at $44k.
Deal economics
- At list price, monthly cash flow is $476 ($6k/yr) — positive.
- The deal already cash-flows at list — no discount required.
- Meets the 1% rule at list price ($988 rent vs $44k).
- Recommended offer: $39k (12.0% below list) — sets the bar for market timing.
- Cap rate 19.1% vs local median 3.9% in Kansas City — top-decile yield for the area; either an underpriced asset or a hidden risk that comps aren't pricing in. Stress-test before assuming the spread holds.
Location & tenants
- Location reads 78/100 on livability (#28 in MO, #2,671 nationally) — a middle-class / working-renter tenant base. Strengths: amenities A+, commute A+, cost of living A+; Watch: schools C-, crime F.
- Independence 30 (suburban): math 26% / reading 38% proficiency, ranked #252 of 324 in MO (top 78%) — families likely to look elsewhere, expect single-tenant / working-renter base with shorter leases.
- Market conditions: 12 active listings in the ZIP; 12 comparable units currently listed for rent nearby; rentals lingering (median 44d on market — plan ~5-8 weeks vacancy on turnover, expect pricing pressure); 50% of comp listings sitting > 30 days — soft ceiling on asking rent; 4,002 units permitted in Jackson County in 2024 (2,271 in 5+ unit buildings).
Forward outlook
- In year one you build about $5k of equity ($308 loan paydown + $4k appreciation (10.0% local appreciation)).
- Jackson County population projected at +4% by 2050 — modest demand growth; plan on rents tracking national, not racing it.
- At projected returns (10.0% appreciation + 3.0% rent growth), your $12k cash investment doubles in ~2 years — after that, you're playing with house money.
- By year 7, paydown + projected appreciation supports a ~$34k cash-out refi (75% LTV) — recoverable capital for the next deal without selling this one.
Negotiation context
- It's been on market 125 days — a 12% lower offer ($39k) is reasonable based on typical stale-listing flexibility.
Risks & watch-outs
- Watch-outs: built in 1918 — expect roof / HVAC / electrical / plumbing capex.
Questions for the listing agent
- It's been on market 125 days. Have you received any prior offers? Is the seller open to a 12% concession, seller financing, or rate buy-down credit?
- Built in 1918 — when were the roof, HVAC, electrical panel, plumbing, and water heater last replaced?
- Why hasn't it sold? Are there any deal-killer items the seller is aware of (foundation, flood, title, zoning, code violations)?
- Is there a deadline driving the sale (1031 exchange, divorce, estate, relocation)? That informs how much negotiation room exists.
- Crime grade is F in this area — have there been break-ins, vandalism, or insurance claims at this property in the last 3 years? What carrier currently insures it and at what premium?
- What's the average days-on-market for RENTAL listings here right now (not sales)? A rising rental-DOM trend means longer vacancies and softer asking-rent achievability than the comps imply.
- What's the recent tenant-quality profile in this submarket — average credit score on applications, eviction rate, late-payment / NSF rate, and stable-employment percentage? A property-management company in the area should have these aggregated.
- How much new for-sale + rental construction is in the pipeline within 1–3 miles? Heavy new supply typically softens prices + rents 12–24 months out; constrained supply supports both.
Investment metrics
- 1% rule
- 2.22% ✓
- Cap rate
- 19.13%
- Cash-on-cash
- 45.86%
- DSCR
- 3.04
- GRM
- 3.8
CMA / ARV
- ARV (median comp)
- $84,223
- List price
- $44,500
- Delta
- -47.16%
- Verdict
- UNDERPRICED
- Comps
- 20 within 1.0 mi
Show comp detail 12 sales within ~0.75 mi
| Address | Dist | Beds/Ba | Sqft | Sold | Price | $/sf | Match |
|---|---|---|---|---|---|---|---|
| 8806 E Smart Ave | 0.20mi | 2/1.0 | 908 (-4%) | 6mo | $95,000 | $105 | 79 |
| 8908 E Thompson Ave | 0.23mi | 2/1.0 | 859 (-9%) | 5mo | $68,500 | $80 | 70 |
| 8907 E Smart Ave | 0.25mi | 3/1.0 (+1) | 936 (-1%) | 17mo | $115,000 | $123 | 68 |
| 716 Lewis Ave | 0.14mi | 3/1.0 (+1) | 1,062 (+12%) | 8mo | $49,000 | $46 | 62 |
| 8715 E Roberts St | 0.06mi | 3/1.5 (+1) | 1,056 (+12%) | 12mo | $20,000 | $19 | 61 |
| 578 S Oxford Ave | 0.59mi | 3/1.0 (+1) | 990 (+5%) | 2mo | $89,000 | $90 | 58 |
| 107 N Ditzler Ave | 0.71mi | 3/2.0 (+1) | 934 (-1%) | 2mo | $178,500 | $191 | 55 |
| 548 S Brookside Ave | 0.51mi | 2/1.0 | 875 (-7%) | 17mo | $45,000 | $51 | 50 |
| 125 S Brookside St | 0.69mi | 2/1.0 | 855 (-9%) | 4mo | $90,000 | $105 | 49 |
| 604 S Glenwood Ave | 0.63mi | 3/1.0 (+1) | 865 (-8%) | 10mo | $50,000 | $58 | 44 |
| 526 S Brookside Ave | 0.53mi | 2/1.0 | 821 (-13%) | 14mo | $29,000 | $35 | 42 |
| 585 S Glenwood Ave | 0.66mi | 3/1.0 (+1) | 1,075 (+14%) | 14mo | $175,000 | $163 | 29 |
Match score weights: distance 35% · size 25% · config 20% · recency 20%. Top-matched comps best support the ARV.
Projected returns pro-forma
10.0% appreciation · 3.0% rent growth · sell at horizon
- IRR
- 60.1%
- Equity multiple
- 5.38×
- Total profit
- $54,580
- Equity at exit
- $40,089
- IRR
- 53.6%
- Equity multiple
- 11.99×
- Total profit
- $136,903
- Equity at exit
- $86,454
Cash invested: $12,460 (down + closing). Projections, not guarantees.
Landlord ↔ Tenant lean methodology
- Overall (STATE)
- 81 Strongly Landlord-Friendly
- State Missouri
- 81 Strongly Landlord-Friendly · R+10
- County
- — inherits STATE
- City
- — inherits STATE
ZIP-level market 64125
- Home prices YoY
- 3.1%
- Active inventory
- 12
- Price-to-rent
- 3.8×
Monthly cashflow live
- Estimated rent
- $988 high interval (Pro) →
- Mortgage (P&I)
- −$233
- Tax from tax record
- −$53 /mo · $632/yr
- Insurance
- −$19
- HOA
- −$0
- Vacancy / Maint / Mgmt
- −$208
- Net cashflow
- $476
Break-even live
UW: 25.0% down · 7.5% · 30yr · 1.5% tax · 5.0% vac · 8.0% maint · 8.0% mgmt
Financing live
Cash to close
- Down payment
- $11,125
- Closing costs
- $1,335
- Reserves months
- —
- Total cash needed
- —
Loan-product check · same deal, 3 products live
Conventional
25% down · 7.5% · 30yr
- Down + closing
- —
- Monthly P&I
- —
- Monthly cashflow
- —
- DSCR
- —
- Eligible?
- —
Personal DTI + credit; lowest rate.
DSCR
20% down · 8.5% · 30yr
- Down + closing
- —
- Monthly P&I
- —
- Monthly cashflow
- —
- DSCR
- —
- Eligible?
- —
No personal income docs; deal must DSCR.
Hard money
10% down · 12.0% · 12mo
- Down + closing
- —
- Monthly P&I
- —
- Monthly cashflow
- —
- DSCR
- —
- Eligible?
- —
Short-term bridge; refi at stabilization.
Rent comps 12 comps
| Address | Beds | Baths | Sqft | Rent | $/sqft | DOM | Units | Dist |
|---|---|---|---|---|---|---|---|---|
| 8705 E Smart Ave Independence, MO | 2.0 | 1.0 | 750 | $1,000 | $1.33 | 43d | 1 | 0.17mi |
| 576 S Oxford Ave Independence, MO | 3.0 | 2.0 | 1098 | $1,400 | $1.28 | 43d | 1 | 0.57mi |
| 600 S Glenwood Ave Unit F Independence, MO | 2.0 | 1.0 | 750 | $995 | $1.33 | 20d | 1 | 0.61mi |
| 600 S Glenwood Ave Unit E Independence, MO | 1.0 | 1.0 | 600 | $725 | $1.21 | 43d | 1 | 0.61mi |
| 600 S Glenwood Ave Unit I Independence, MO | 1.0 | 1.0 | 700 | $695 | $0.99 | 43d | 1 | 0.62mi |
| 9528 E Winner Rd Independence, MO | 1.0–3.0 | 1.0 | 730 | $999 | $1.37 | 43d | 1 | 0.83mi |
| 1601 Blue Ridge Blvd Independence, MO | 1.0 | 1.0 | 515 | $909 | $1.77 | 12d | 3 | 0.85mi |
| 563 S Ash Ave Unit 3 Independence, MO | 2.0 | 1.0 | 650 | $950 | $1.46 | 2d | 1 | 1.22mi |
| 611 Ewing Ave Unit B Kansas City, MO | 1.0 | 1.0 | 700 | $800 | $1.14 | 23d | 1 | 1.32mi |
| 10522 E 10th St S Independence, MO | 2.0 | 1.0 | 1020 | $1,099 | $1.08 | 23d | 1 | 1.42mi |
| 10561 E Lake Dr Independence, MO | 2.0 | 1.0 | 800 | $1,000 | $1.25 | 43d | 1 | 1.46mi |
| 10119 E Winner Rd Unit 2 Independence, MO | 1.0 | 1.0 | 1000 | $1,045 | $1.04 | 21d | 1 | 1.46mi |
Listing history 15 events
-
2026-06-18days on market $44,500 Active 125 DOM
-
2026-06-17days on market $44,500 Active 124 DOM
-
2026-06-16days on market $44,500 Active 123 DOM
-
2026-06-15days on market $44,500 Active 122 DOM
-
2026-06-13days on market $44,500 Active 120 DOM
-
2026-06-09days on market $44,500 Active 116 DOM
-
2026-06-08days on market $44,500 Active 115 DOM
-
2026-06-07days on market $44,500 Active 114 DOM
-
2026-06-05days on market $44,500 Active 111 DOM
-
2026-06-03days on market $44,500 Active 110 DOM
-
2026-06-02days on market $44,500 Active 109 DOM
-
2026-06-01days on market $44,500 Active 108 DOM
-
2026-05-31days on market $44,500 Active 107 DOM
-
2026-02-13$44,500 Active 1694-char remark
Show marketing remark (1694 chars)
Opportunity starts here. 549 Blue Ridge Blvd is a larger 2-bedroom home offered at just $44,500, sitting on a rare double lot that adds flexibility and upside rarely found at this price point. Whether you’re planning a full renovation, long-term hold, resale, or future expansion, the additional land creates options that most entry-level investments simply don’t offer. No remodeling has been started, giving investors full control over layout, finishes, and scope. The main level features an open living and kitchen area ready for reconfiguration and modernization. At the rear of the home is a laundry area and a generously sized bathroom footprint. Upstairs offers two bedrooms separated from the main living space. There is no basement. Electrical main service still needs to be run to the building. Renovation will be required, and City of Kansas City, Missouri permits are likely necessary to complete improvements. With the right renovation plan and execution, comparable renovated homes in the area suggest potential after-repair values in the $130,000–$150,000 range. Buyer to verify all assumptions and comparable sales. The double lot provides additional upside potential through expanded yard space, parking improvements, or other creative possibilities. 549 Blue Ridge can be purchased individually or as part of a package with the neighboring property at 547 Blue Ridge Blvd (2601958), offering a rare chance to control side-by-side assets for scale and long-term upside. Property should be considered an active construction site. Enter at your own risk and take appropriate precautions. Seller will accept as-is offers only with box 2 or 3 checked on the form.
-
1980-11-01soldstatus
ⓘ Source: listings_history table (triggers on properties + properties_extension) + one-shot
backfill from property_details.listing_events for pre-trigger history.
Tax reassessment forecast MO · Resets to sale price
- Current annual tax
- $632 · $53/mo
- Projected year-2 tax
- $632 · $53/mo
- Expected delta
- $0/yr ($0/mo · 0.0%)
ⓘ Screening estimate from a state-policy table — verify with the county assessor before closing.
Climate risk First Street
- Flood 1/10 Low FEMA zone X (unshaded) · 0% chance over 30 yrs
- Wildfire 3/10 Moderate
- Heat 4/10 Moderate 7 d/yr ≥106°F today · 16 d/yr by 30 yrs out
- Wind 2/10 Low
- Air quality 3/10 Moderate 2 unhealthy d/yr today · 3 by 30 yrs out
Nearby sold comps map
Loading sold comps map…
Walkable amenities ~0.75 mi
Loading nearby amenities…
Taxation est. · year 1
- Rental income
- $11,861
- − Mortgage interest
- −$2,493
- − Property taxes
- −$632
- − Insurance
- −$222
- − Repairs & maintenance
- −$949
- − Management
- −$949
- − Depreciation
- −$1,295
- Taxable income
- $5,321
- Est. tax owed @ 24.0%
- −$1,277
- After-tax cash flow
- $4,438/yr
For passive investors: Depreciation is non-cash, so a rental often shows a tax loss while cash-flowing — sheltering income. Rental losses are passive: they offset passive income freely, and up to $25,000/yr can offset ordinary (W-2) income if you actively participate and your MAGI is under $100k (phasing out to $0 by $150k); unused losses carry forward. On sale, claimed depreciation is recaptured at up to 25%, and gains may owe capital-gains tax (a 1031 exchange can defer both). Figures are a year-1 estimate at your 24.0% rate — not tax advice; consult a CPA.
Schools (NCES district)
- District
- Independence 30
- NCES district ID
- 2915480
- Math proficiency
- 26% ▼ -8.00%
- Reading proficiency
- 38% ▼ -5.00%
- Median HH income
- $41,843
- Composite
- 27.04/100
- National rank
- #7054
- State rank
- #252 of 324 in MO
Livability — Kansas City
- Score
- 78/100
- State rank
- #28
- US rank
- #2671
Category grades
Schools grade is shown separately in the Schools card above.
Census & demographics
- Census place
- Kansas City, MO
- City population
- 439,467
- Population (ZIP)
- 2,723
Population outlook (Jackson County) Hauer SSP2
- Today (2025)
- 719,589 people
- By 2030
- 731,456 · +1.6%
- By 2040
- 746,689 · +3.8%
- By 2050
- 749,289 · +4.1%
- By 2075
- 736,227 · +2.3%
- By 2100
- 668,210 · -7.1%
Race, ethnicity, and origin ACS 2023
- Neighborhood character
- Majority Hispanic (61%)
- Race & ethnicity
- Hispanic / Latino 61% White 26% Black 10% Two or more races 7%
- Hispanic origin (detail)
- Mexican 50% Puerto Rican 1%
- Common ancestry
- Serbian 1% Slovak 1%
- Foreign-born
- 15% · Canada, South Korea
- Languages at home
- 52% English-only · Spanish 48%
Political lean MEDSL · Jackson
- 2024 margin
- D (+19.3) · D 58.9% · R 39.5% · Other 1.6%
- 2008→2024 swing
- -6.1pp toward R · 2008: 25.4pp · 2024: 19.3pp
- All cycles
- 2024: D+19.3 2020: D+22.0 2016: D+16.6 2012: D+19.0 2008: D+25.4
Not yet ingested
- Civics
- —
Market trends
- HPI YoY
- ▲ 14.18%
- Current HPI
- 471.552
- Rent YoY
- —
- Metro
- —
- State GDP YoY
- ▲ 1.84%
- F500 in state
- 20
Industry mix (Fortune 500 HQ in MO)
| Industry | F500 HQs | Revenue |
|---|---|---|
| Healthcare | 1 | $163B |
|
||
| Insurance | 1 | $21B |
|
||
| Industrial Technology | 1 | $17B |
|
||
| Retail | 1 | $16B |
|
||
| Industrial Distribution | 1 | $10B |
|
||
| Utilities | 1 | $9B |
|
||
Price history
2 events — show timeline
- 2026-02-13 Listed $44,500 Heartland MLS as Distributed by MLS Grid
- 1980-11-01 Sold (Public Records) — Public Records
Property tax history
+6.6%/yrLatest (2025): $632 · -39.3% YoY. Source: county tax records.
Cash-flow waterfall
monthlySold comps — $/sqft
last 12 mo · ≤1 miLoading sold comps…