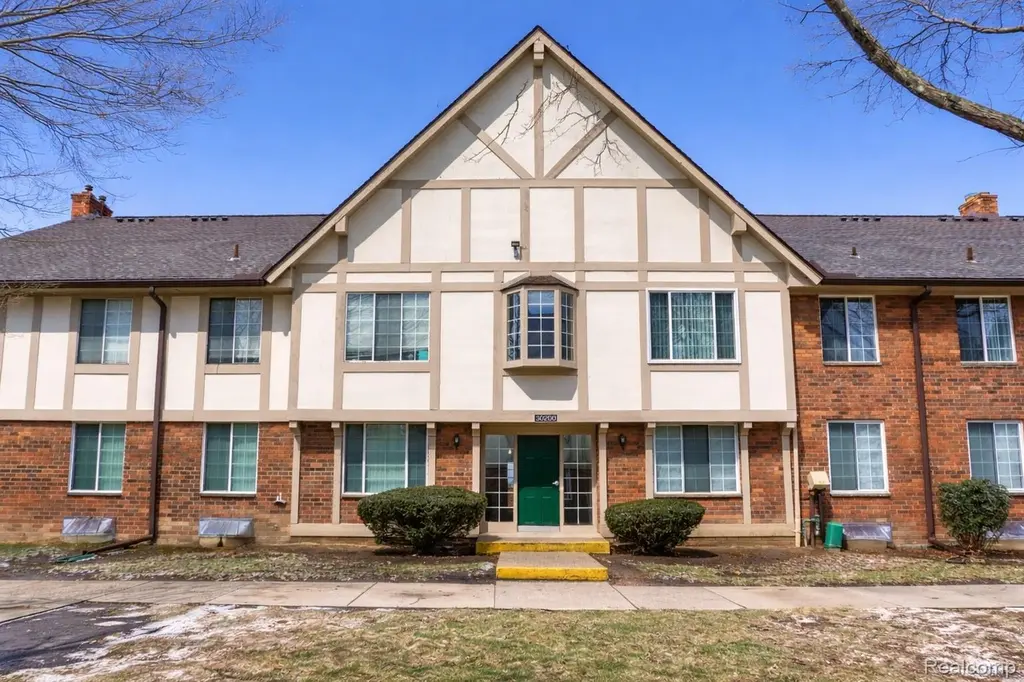
30200 Southfield Rd #204 · Southfield, MI
Flood risk 1/10 · Minimal
- FEMA flood zone
- X (unshaded)
- Chance of flooding over 30 yrs
- 0.0%
- Est. flood insurance / yr
- $473 – $860
Fire risk 1/10 · Minimal
- Est. fire insurance / yr
- $784 – $1,456
Heat risk 3/10 · Minor
- Hot days now (above 97°F)
- 7 days/yr
- Hot days in 30 yrs
- 15 days/yr
Wind risk 2/10 · Minimal
- Chance of severe wind over 30 yrs
- —
Air-quality risk 4/10 · Minor
- Unhealthy air days now
- 3 days/yr
- Unhealthy air days in 30 yrs
- 6 days/yr
Risk factors via First Street. Map © Google.
Why this score? — see what drove the B- grade
The composite is a weighted blend of 9 inputs, each scored 0–100. Each bar is that input's sub-score; the figure is the points it added to the 100-point composite (weight × sub-score).
- Cash flow +24.5/30.0
- ARV discount +12.7/15.0
- 1% rule +10.0/10.0
- DSCR +7.9/10.0
- Rent growth +3.7/5.0
- Livability +3.6/5.0
- Condition / age +2.5/5.0
- Schools +2.4/10.0
- Appreciation +0.0/10.0
$105,999
🖨 Deal sheet (PDF) 📄 Offer letter ✓ Due diligence
Listing remarks
Welcome to this move-in ready 2-bedroom, 2-bath condo ideally located in the heart of Southfield, right on the border of Beverly Hills and just minutes from downtown Birmingham, major expressways, shopping, and dining. This second-floor ranch-style unit offers comfortable single-level living with no upstairs neighbors and a layout that maximizes both space and functionality. The updated kitchen features granite countertops, a tile backsplash, and newer stainless steel appliances, making it both stylish and practical for everyday living or rental use. The condo is vacant and ready for immediate occupancy, making it a great option for both owner-occupants and investors. Enjoy the convenience
Key facts
- $315 HOA
- Built 1966
- Listed 9 days
Property features AI
Finance
- Other: Property occupies part of a larger condominium subdivision; Acreage listed for the parcel: 12.37 acres
- HOA & community: Balmoral Condominium Association; Association fee $315 per month; Association phone available
Exterior
- Parking: Covered parking
- Utilities: Natural gas heat/fuel; Forced air heating system; Public water; Public sanitary sewer
- Home design: Condominium; Condo/Apartment on 2nd floor or above; Unit/Building number 204; Built in 1966; Facing/entry level: Entry
- Construction: Basement foundation
- Exterior features: Brick exterior
Interior
- Kitchen: Kitchen (Entry): approximately 9 x 9
- Bedrooms: Bedroom 1 (Entry): 17 x 12, wood flooring; Bedroom 2 (Entry): 12 x 10, wood flooring
- Flooring: Wood flooring in living room, dining room, and bedrooms; Ceramic flooring in bathrooms
- Bathrooms: 2 full bathrooms; Bathroom 1 (Entry): ceramic floor, approx. 5 x 7; Bathroom 2 (Entry): ceramic floor, approx. 6 x 9
- Interior features: 7 total rooms; Basement
Neighborhood map
What this means for you Summary
Snapshot
- This is a 2-bed/2.0-bath condo listed at $106k.
Deal economics
- At list price, monthly cash flow is $217 ($3k/yr) — positive.
- The deal already cash-flows at list — no discount required.
- Meets the 1% rule at list price ($2k rent vs $106k).
- Cap rate 8.8% vs local median 4.6% in Southfield — top-decile yield for the area; either an underpriced asset or a hidden risk that comps aren't pricing in. Stress-test before assuming the spread holds.
Location & tenants
- Location reads 72/100 on livability (#248 in MI) — a middle-class / working-renter tenant base. Strengths: commute A+, cost of living A+, housing A+; Watch: health & safety D, crime F, amenities F.
- Southfield Public School District (urban): math 17% / reading 37% proficiency, ranked #392 of 540 in MI (top 73%) — low school quality limits family demand, transient renter base, plan for 1-2y turnover.
- Zoned schools: Vandenberg Elementary School (math 17% / reading 27%, grade F, #1,035 of 1,397 statewide, top 77%, 306 students, 69% FRL) — zoned schools average 69% FRL vs 52% district-wide (17 pts higher); higher-poverty schools than district average — tighter screening recommended.
- Market conditions: Rents rising fast (+4.8%/yr); 96 active listings in the ZIP; 23 comparable units currently listed for rent nearby; rentals at typical pace (median 22d on market — plan ~3-4 weeks tenant-placement turnaround); solid renter incomes; 2,614 units permitted in Oakland County in 2024 (721 in 5+ unit buildings).
Forward outlook
- Local home prices are declining (-3.0%/yr); year-one equity from $733 of loan paydown is wiped out by about $3k of value loss. Plan a longer hold.
- Oakland County population projected at +10% by 2050 — modest demand growth; plan on rents tracking national, not racing it.
- At projected returns (-3.0% appreciation + 4.8% rent growth), your $30k cash investment doubles in ~9 years — after that, you're playing with house money.
Negotiation context
- Only 9 days on market — expect competitive offers; lowballing is unlikely to land.
- 14 sale attempts since 26y ago with the ask held roughly flat each time — persistent listings suggest the price (not the market) is what's stuck; bring a comps-based counter.
- Current owner paid $16k; list at $106k implies a 571% gain — meaningful room to come down on a strong offer.
Questions for the listing agent
- Built in 1966 — when were the roof, HVAC, electrical panel, plumbing, and water heater last replaced?
- What does the HOA fee cover, when was the last increase, and are there any pending special assessments or reserve-fund shortfalls?
- Any open or pending special assessments — roof, HVAC, plumbing, elevator, façade? What's the per-unit balance and payoff schedule, and is the seller paying it off at close or rolling it to the buyer?
- Is there a deadline driving the sale (1031 exchange, divorce, estate, relocation)? That informs how much negotiation room exists.
- Schools are D-rated, which usually means shorter tenancies and higher turnover. Who's the typical renter profile here, and what's been the actual vacancy rate?
- Crime grade is F in this area — have there been break-ins, vandalism, or insurance claims at this property in the last 3 years? What carrier currently insures it and at what premium?
- What's the average days-on-market for RENTAL listings here right now (not sales)? A rising rental-DOM trend means longer vacancies and softer asking-rent achievability than the comps imply.
- What's the recent tenant-quality profile in this submarket — average credit score on applications, eviction rate, late-payment / NSF rate, and stable-employment percentage? A property-management company in the area should have these aggregated.
- How much new apartment / multifamily construction is in the pipeline within 1–3 miles? Heavy new supply (>2% of stock underway) typically softens rents 12–24 months out; light construction supports rent growth.
Investment metrics
- 1% rule
- 1.51% ✓
- Cap rate
- 8.75%
- Cash-on-cash
- 8.78%
- DSCR
- 1.39
- GRM
- 5.5
CMA / ARV
- ARV (median comp)
- $119,833
- List price
- $105,999
- Delta
- -8.21%
- Verdict
- FAIR
- Comps
- 20 within 1.0 mi
Projected returns pro-forma
-3.0% appreciation · 4.84% rent growth · sell at horizon
- IRR
- -0.1%
- Equity multiple
- 1.00×
- Total profit
- $-102
- Equity at exit
- $15,805
- IRR
- 12.0%
- Equity multiple
- 2.06×
- Total profit
- $31,474
- Equity at exit
- $9,165
Cash invested: $29,680 (down + closing). Projections, not guarantees.
Landlord ↔ Tenant lean methodology
- Overall (STATE)
- 62 Landlord-Friendly
- State Michigan
- 62 Landlord-Friendly · EVEN
- County
- — inherits STATE
- City
- — inherits STATE
ZIP-level market 48076
- Rents YoY
- 4.8%
- Active inventory
- 96
- Price-to-rent
- 5.5×
Monthly cashflow live
- Estimated rent
- $1,601 high interval (Pro) →
- Mortgage (P&I)
- −$556
- Tax est. 1.5%
- −$132 /mo · $1,590/yr
- Insurance
- −$44
- HOA
- −$315
- Vacancy / Maint / Mgmt
- −$336
- Net cashflow
- $217
Break-even live
Sensitivity live
| Price | -10% $291 | -5% $254 | +0% $217 | +5% $181 | +10% $144 |
|---|---|---|---|---|---|
| Rent | -10% $91 | -5% $154 | +0% $217 | +5% $281 | +10% $344 |
| Rate | -1.0pp $271 | -0.5pp $244 | base $217 | +0.5pp $190 | +1.0pp $162 |
UW: 25.0% down · 7.5% · 30yr · 1.5% tax · 5.0% vac · 8.0% maint · 8.0% mgmt
Financing live
Cash to close
- Down payment
- $26,500
- Closing costs
- $3,180
- Reserves months
- —
- Total cash needed
- —
Loan-product check · same deal, 3 products live
Conventional
25% down · 7.5% · 30yr
- Down + closing
- —
- Monthly P&I
- —
- Monthly cashflow
- —
- DSCR
- —
- Eligible?
- —
Personal DTI + credit; lowest rate.
DSCR
20% down · 8.5% · 30yr
- Down + closing
- —
- Monthly P&I
- —
- Monthly cashflow
- —
- DSCR
- —
- Eligible?
- —
No personal income docs; deal must DSCR.
Hard money
10% down · 12.0% · 12mo
- Down + closing
- —
- Monthly P&I
- —
- Monthly cashflow
- —
- DSCR
- —
- Eligible?
- —
Short-term bridge; refi at stabilization.
Rent comps 23 comps
| Address | Beds | Baths | Sqft | Rent | $/sqft | DOM | Units | Dist |
|---|---|---|---|---|---|---|---|---|
| 30276 Southfield Rd Unit 215 Southfield, MI | 2.0 | 2.0 | 956 | $1,399 | $1.46 | 22d | 1 | 0.01mi |
| 30268 Southfield Rd #230 Southfield, MI | 2.0 | 2.0 | 956 | $1,450 | $1.52 | 46d | 1 | 0.05mi |
| 30300 Southfield Rd Southfield, MI | 1.0–3.0 | 1.0–2.5 | 1450 | $1,798 | $1.24 | 1d | 1 | 0.18mi |
| 18333 South Dr Southfield, MI | 1.0–2.0 | 1.0–2.0 | 1044 | $1,975 | $1.89 | 1d | 5 | 0.21mi |
| 18335 W 13 Mile Rd Southfield, MI | 1.0–2.0 | 1.0–2.0 | 925 | $1,864 | $2.02 | 1d | 8 | 0.32mi |
| 18248 W 12 Mile Rd Southfield, MI | 1.0–2.0 | 1.0–2.0 | 902 | $2,254 | $2.50 | 0d | 1 | 0.60mi |
| 29890 Everett St Southfield, MI | 3.0 | 1.5 | 1100 | $2,200 | $2.00 | 46d | 1 | 0.76mi |
| 3214 Greenfield Rd Royal Oak, MI | 1.0 | 1.0 | 800 | $1,025 | $1.28 | 26d | 1 | 0.97mi |
| 3210 Greenfield Rd Unit 3214-8 Royal Oak, MI | 1.0 | 1.0 | 800 | $1,025 | $1.28 | 26d | 1 | 0.98mi |
| 3210 Greenfield Rd Unit 3210-8 Royal Oak, MI | 1.0 | 1.0 | 800 | $1,025 | $1.28 | 20d | 1 | 0.98mi |
| 4314 Albert Ave Royal Oak, MI | 1.0 | 1.0 | 650 | $960 | $1.48 | 26d | 1 | 1.01mi |
| 3644 Greenfield Rd Unit 3664 Greenfield Berkley, MI | 2.0 | 1.5 | 950 | $1,700 | $1.79 | 20d | 1 | 1.09mi |
| 4312 13 Mile Rd Royal Oak, MI | 1.0 | 1.0 | 800 | $1,400 | $1.75 | 26d | 1 | 1.10mi |
| 4312-4316 13 Mile and 3415 Fairmont Royal Oak, MI | 1.0 | 1.0 | 525 | $1,100 | $2.10 | 7d | 2 | 1.10mi |
| 4302 W 13 Mile Rd Royal Oak, MI | 1.0 | 1.0 | 600 | $1,095 | $1.82 | 26d | 1 | 1.11mi |
| 4120 W 13 Mile Rd Royal Oak, MI | 1.0–2.0 | 1.0 | 775 | $1,300 | $1.68 | 1d | 4 | 1.18mi |
| 4030 W 13 Mile Rd Unit J2 Royal Oak, MI | 2.0 | 1.0 | 724 | $1,450 | $2.00 | 20d | 1 | 1.30mi |
| 4030 W 13 Mile Rd Unit J2 Royal Oak, MI | 2.0 | 1.0 | 724 | $1,600 | $2.21 | 26d | 1 | 1.30mi |
| 4030 W 13 Mile Rd Unit J2 Royal Oak, MI | 2.0 | 1.0 | 724 | $1,450 | $2.00 | 22d | 1 | 1.30mi |
| 4000 W 13 Mile Rd Royal Oak, MI | 2.0 | 1.0 | 780 | $1,444 | $1.85 | 4d | 3 | 1.34mi |
| 28124 Brentwood St Southfield, MI | 3.0 | 1.0 | 1056 | $1,800 | $1.70 | 26d | 1 | 1.38mi |
| 1948 Henrietta St Birmingham, MI | 3.0 | 1.0 | 1057 | $2,500 | $2.37 | 26d | 1 | 1.42mi |
| 3936 Royal Ave Berkley, MI | 3.0 | 2.0 | 900 | $2,000 | $2.22 | 46d | 1 | 1.43mi |
HOA detail condo
- Monthly dues
- $315 · $3,780/yr
- Assessments
- None detected in remarks — confirm with the listing agent.
Listing history 39 events
-
2026-06-21days on market $105,999 Active 9 DOM
-
2026-06-18days on market $105,999 Active 6 DOM
-
2026-06-17days on market $105,999 Active 5 DOM
-
2026-06-16days on market $105,999 Active 4 DOM
-
2026-06-15days on market $105,999 Active 3 DOM
-
2026-06-13pricedays on market $105,999 Active 1 DOM
-
2026-06-01days on market $110,000 Active 136 DOM
-
2026-05-31days on market $110,000 Active 135 DOM
-
2026-04-21price $110,000 1346-char remark
-
2026-04-21price $110,000 1352-char remark
-
2026-03-26price $115,000 1346-char remark
-
2026-03-25price $115,000 1352-char remark
-
2026-03-04price $120,000 1346-char remark
-
2026-03-04price $120,000 1352-char remark
-
2026-01-17$125,000 Active 1346-char remark
-
2026-01-17$125,000 Active 1352-char remark
-
2026-01-15historical $125,000 1346-char remark
-
2025-11-06historical
-
2025-11-06historical
-
2025-08-29status Active
-
2025-08-29status Active
-
2025-07-06status Pending
-
2025-07-06status Pending
-
2025-03-04status Active
-
2025-03-04status Active
-
2025-03-03historical
-
2025-03-03historical
-
2025-03-02$129,000 Active
-
2025-03-02$129,000 Active
-
2010-03-07soldstatus $15,800
-
2009-12-29$19,900
-
2006-10-18historical
-
2006-08-27$88,000
-
2006-08-04historical
-
2006-05-04$95,000
-
2006-05-04historical
-
2006-02-28$98,000
-
2000-09-01soldstatus $84,900
-
2000-08-10$83,900
ⓘ Source: listings_history table (triggers on properties + properties_extension) + one-shot
backfill from property_details.listing_events for pre-trigger history.
Climate risk First Street
- Flood 1/10 Low FEMA zone X (unshaded) · 0% chance over 30 yrs
- Wildfire 1/10 Low
- Heat 3/10 Moderate 7 d/yr ≥97°F today · 15 d/yr by 30 yrs out
- Wind 2/10 Low
- Air quality 4/10 Moderate 3 unhealthy d/yr today · 6 by 30 yrs out
Nearby sold comps map
Loading sold comps map…
Walkable amenities ~0.75 mi
Loading nearby amenities…
Taxation est. · year 1
- Rental income
- $19,212
- − Mortgage interest
- −$5,938
- − Property taxes
- −$1,590
- − Insurance
- −$530
- − Repairs & maintenance
- −$1,537
- − Management
- −$1,537
- − HOA
- −$3,780
- − Depreciation
- −$3,084
- Taxable income
- $1,217
- Est. tax owed @ 24.0%
- −$292
- After-tax cash flow
- $2,315/yr
For passive investors: Depreciation is non-cash, so a rental often shows a tax loss while cash-flowing — sheltering income. Rental losses are passive: they offset passive income freely, and up to $25,000/yr can offset ordinary (W-2) income if you actively participate and your MAGI is under $100k (phasing out to $0 by $150k); unused losses carry forward. On sale, claimed depreciation is recaptured at up to 25%, and gains may owe capital-gains tax (a 1031 exchange can defer both). Figures are a year-1 estimate at your 24.0% rate — not tax advice; consult a CPA.
Schools (NCES district)
- District
- Southfield Public School District
- NCES district ID
- 2632310
- Math proficiency
- 17% ▼ -3.00%
- Reading proficiency
- 37% ▲ 1.00%
- Median HH income
- $51,400
- Composite
- 23.77/100
- National rank
- #7814
- State rank
- #392 of 540 in MI
Livability — Southfield
- Score
- 72/100
- State rank
- #248
- US rank
- #6175
Category grades
Schools grade is shown separately in the Schools card above.
Census & demographics
- Census place
- Southfield, MI
- County
- Oakland County · 1,009,092 people
- City population
- 54,914
- Metro
- Detroit-Warren-Dearborn, MI
- Population (ZIP)
- 25,405
- Household income
- $90,058
- Rent vs Own
- Severe rent burden
- 607.0
Population outlook (Oakland County) Hauer SSP2
- Today (2025)
- 1,335,747 people
- By 2030
- 1,375,100 · +2.9%
- By 2040
- 1,435,385 · +7.5%
- By 2050
- 1,469,250 · +10.0%
- By 2075
- 1,531,946 · +14.7%
- By 2100
- 1,450,485 · +8.6%
Race, ethnicity, and origin ACS 2023
- Neighborhood character
- Diverse neighborhood (Simpson 0.57)
- Race & ethnicity
- Black 57% White 32% Two or more races 7% Hispanic / Latino 3% Asian 2%
- Common ancestry
- Romanian 3% Slovak 1% Scotch-Irish 1%
- Foreign-born
- 8% · Canada, Vietnam
- Languages at home
- 90% English-only · Spanish 3% Arabic 2% Russian/Polish/Slavic 1%
Political lean MEDSL · Oakland
- 2024 margin
- D (+10.6) · D 54.4% · R 43.8% · Other 1.9%
- 2008→2024 swing
- -3.9pp toward R · 2008: 14.5pp · 2024: 10.6pp
- All cycles
- 2024: D+10.6 2020: D+14.1 2016: D+8.1 2012: D+8.1 2008: D+14.5
Not yet ingested
- Civics
- —
Market trends
- HPI YoY
- ▼ -192.13%
- Current HPI
- 229.2304
- Rent YoY
- ▲ 4.84%
- Metro
- Detroit-Warren-Dearborn, MI
- State GDP YoY
- ▲ 1.37%
- F500 in state
- 28
Industry mix (Fortune 500 HQ in MI)
| Industry | F500 HQs | Revenue |
|---|---|---|
| Automotive Parts | 3 | $48B |
|
||
| Automotive | 2 | $372B |
|
||
| Chemicals | 1 | $45B |
|
||
| Automotive Retail | 1 | $29B |
|
||
| Healthcare / Medical Devices | 1 | $23B |
|
||
| Automotive Technology | 1 | $20B |
|
||
Price history
+26.3% since first listed35 events — show timeline
- 2026-06-12 Listed $105,999 MiRealSource-MiMLS
- 2026-06-09 Coming Soon $105,999 MiRealSource-MiMLS
- 2026-06-01 Listing Removed — MiRealSource-MiMLS
- 2026-06-01 Listing Removed — REALCOMP
- 2026-04-21 Price Changed $110,000 MiRealSource-MiMLS
- 2026-04-21 Price Changed $110,000 REALCOMP
- 2026-03-26 Price Changed $115,000 MiRealSource-MiMLS
- 2026-03-25 Price Changed $115,000 REALCOMP
- 2026-03-04 Price Changed $120,000 MiRealSource-MiMLS
- 2026-03-04 Price Changed $120,000 REALCOMP
- 2026-01-17 Listed $125,000 MiRealSource-MiMLS
- 2026-01-17 Listed $125,000 REALCOMP
- 2026-01-15 Coming Soon — MiRealSource-MiMLS
- 2025-11-06 Listing Removed — REALCOMP
- 2025-11-06 Listing Removed — MiRealSource-MiMLS
- 2025-08-29 Relisted — MiRealSource-MiMLS
- 2025-08-29 Relisted — REALCOMP
- 2025-07-06 Pending — MiRealSource-MiMLS
- 2025-07-06 Pending — REALCOMP
- 2025-03-04 Relisted — MiRealSource-MiMLS
- 2025-03-04 Relisted — REALCOMP
- 2025-03-03 Listing Removed — MiRealSource-MiMLS
- 2025-03-03 Listing Removed — REALCOMP
- 2025-03-02 Listed $129,000 REALCOMP
- 2025-03-02 Listed $129,000 MiRealSource-MiMLS
- 2010-03-07 Sold (MLS) $15,800 REALCOMP
- 2009-12-29 Listed $19,900 REALCOMP
- 2006-10-18 Listing Removed — REALCOMP
- 2006-08-27 Listed $88,000 REALCOMP
- 2006-08-04 Listing Removed — REALCOMP
- 2006-05-04 Listing Removed — REALCOMP
- 2006-05-04 Listed $95,000 REALCOMP
- 2006-02-28 Listed $98,000 REALCOMP
- 2000-09-01 Sold (MLS) $84,900 REALCOMP
- 2000-08-10 Listed $83,900 REALCOMP
Cash-flow waterfall
monthlySold comps — $/sqft
last 12 mo · ≤1 miLoading sold comps…