 Multi-family
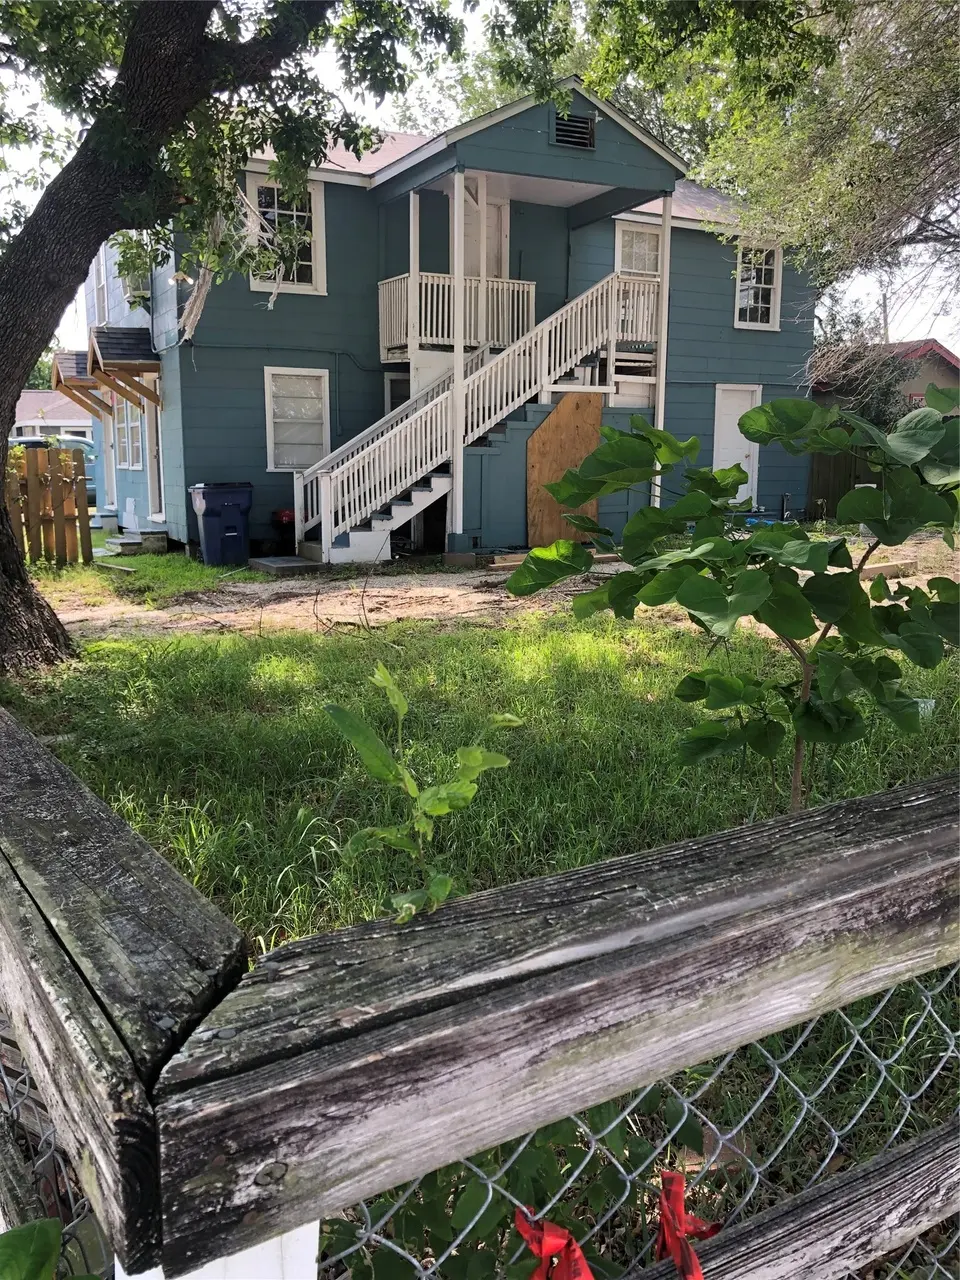
827 1st Ave N · Texas City, TX
Flood risk 9/10 · Severe
- FEMA flood zone
- X
- Chance of flooding over 30 yrs
- 0.99%
- Est. flood insurance / yr
- $507 – $1,088
Fire risk 3/10 · Minor
- Est. fire insurance / yr
- $1,222 – $2,270
Heat risk 10/10 · Severe
- Hot days now (above 108°F)
- 7 days/yr
- Hot days in 30 yrs
- 28 days/yr
Wind risk 10/10 · Severe
- Chance of severe wind over 30 yrs
- 99.0%
Air-quality risk 2/10 · Minimal
- Unhealthy air days now
- 2 days/yr
- Unhealthy air days in 30 yrs
- 2 days/yr
Risk factors via First Street. Map © Google.
Why this score? — see what drove the B+ grade
The composite is a weighted blend of 9 inputs, each scored 0–100. Each bar is that input's sub-score; the figure is the points it added to the 100-point composite (weight × sub-score).
- Cash flow +30.0/30.0
- ARV discount +15.0/15.0
- DSCR +10.0/10.0
- 1% rule +9.5/10.0
- Rent growth +3.7/5.0
- Livability +3.1/5.0
- Condition / age +2.5/5.0
- Schools +2.4/10.0
- Appreciation +0.0/10.0
$162,000
🖨 Deal sheet 📄 Offer letter ✓ Due diligence
Multi-family units
County records classify this as Multi-Family (2-4 Unit). Listing-text estimate: 1 unit. estimate disagrees with records
Listing remarks
This property offers a unique opportunity for buyers and investors seeking flexibility and potential. Conveniently located with access to major roadways, shopping, and surrounding amenities, the property provides a strong foundation for a variety of uses. The seller is open to negotiating repairs, allowing buyers to customize improvements to their needs. The property may also be suitable for buyers considering a 1031 exchange. text me Whether you are looking to invest, occupy, or add value over time, this property presents multiple possibilities in a growing area.
Key facts
- 5,500 sq ft lot
- Built 1950
- Listed 47 days
Property features AI
Finance
- Other: Seller disclosure available; Total building area approximately 2,634
Exterior
- Parking: Golf cart garage; Workshop in garage
- Home design: Residential income property; Faces north; Built in 1950; Private entrance
- Construction: Composition roof; Construction materials: Unknown
- Exterior features: Corner lot; Subdivision location
Interior
- Kitchen: Refrigerator included
- Bedrooms: Two units have 3 beds (one unit); One unit has 2 beds
- Flooring: Laminate; Plank; Vinyl
- Bathrooms: 2 full bathrooms (total)
- Heating & cooling: Window unit heating; Window unit cooling
- Interior features: Ceiling fan(s); Private entrance
- Laundry & utility: Washer hookup; Dryer hookup
Neighborhood map
What this means for you Summary
Snapshot
- This is a 5-bed/3.0-bath multifamily listed at $162k.
Deal economics
- At list price, monthly cash flow is $610 ($7k/yr) — positive.
- The deal already cash-flows at list — no discount required.
- Meets the 1% rule at list price ($2k rent vs $162k).
- Recommended offer: $157k (3.0% below list) — sets the bar for market timing.
- Cap rate 11.3% vs local median 4.3% in Texas City — top-decile yield for the area; either an underpriced asset or a hidden risk that comps aren't pricing in. Stress-test before assuming the spread holds.
Location & tenants
- Location reads 62/100 on livability (#907 in TX) — a middle-class / working-renter tenant base. Strengths: cost of living A+, housing A+; Watch: crime D+, amenities F, commute F.
- Texas City ISD (suburban): math 28% / reading 29% proficiency, ranked #655 of 826 in TX (top 79%) — low school quality limits family demand, transient renter base, plan for 1-2y turnover; 66% free/reduced lunch — lower-income household profile, screen leases tightly.
- Zoned schools: Blocker Middle (math 33% / reading 36%, grade F, #858 of 1,662 statewide, top 54%, 865 students, 80% FRL); Texas City H S (math 32% / reading 36%, grade F, #1,002 of 1,632 statewide, top 62%, 1,718 students, 72% FRL).
- Market conditions: Rents rising fast (+4.9%/yr); 292 active listings in the ZIP; 1 comparable units currently listed for rent nearby; 3,258 units permitted in Galveston County in 2024 (0 in 5+ unit buildings).
- This rent runs 43% of the median local income ($66k/yr) — at the standard rent-burdened threshold; future hikes will face affordability resistance.
Forward outlook
- Local home prices are declining (-3.0%/yr); year-one equity from $1k of loan paydown is wiped out by about $5k of value loss. Plan a longer hold.
- Galveston County population projected at +43% by 2050 — long-run rental-demand tailwind backs the buy-and-hold thesis.
- At projected returns (-3.0% appreciation + 4.9% rent growth), your $45k cash investment doubles in ~7 years — after that, you're playing with house money.
Negotiation context
- It's been on market 47 days — a 3% lower offer ($157k) is reasonable based on typical stale-listing flexibility.
- 5 sale attempts since 6y ago with the ask held roughly flat each time — persistent listings suggest the price (not the market) is what's stuck; bring a comps-based counter.
Risks & watch-outs
- Watch-outs: flood insurance adds $66/mo; built in 1950 — expect roof / HVAC / electrical / plumbing capex.
- Climate carrying-cost: severe flood risk; severe wind risk, 99% chance of damaging wind over 30y; extreme-heat days projected 7→28/yr by 2055 (HVAC capex compounding) — expect insurance premiums to compound above CPI over the hold.
Questions for the listing agent
- It's been on market 47 days. Have you received any prior offers? Is the seller open to a 3% concession, seller financing, or rate buy-down credit?
- Built in 1950 — when were the roof, HVAC, electrical panel, plumbing, and water heater last replaced?
- What's the actual annual flood-insurance premium (NFIP or private), and is the property in a SFHA with mandatory coverage?
- Is there a deadline driving the sale (1031 exchange, divorce, estate, relocation)? That informs how much negotiation room exists.
- Schools are F-rated, which usually means shorter tenancies and higher turnover. Who's the typical renter profile here, and what's been the actual vacancy rate?
- Crime grade is D in this area — have there been break-ins, vandalism, or insurance claims at this property in the last 3 years? What carrier currently insures it and at what premium?
- What's the average days-on-market for RENTAL listings here right now (not sales)? A rising rental-DOM trend means longer vacancies and softer asking-rent achievability than the comps imply.
- What's the recent tenant-quality profile in this submarket — average credit score on applications, eviction rate, late-payment / NSF rate, and stable-employment percentage? A property-management company in the area should have these aggregated.
- How much new apartment / multifamily construction is in the pipeline within 1–3 miles? Heavy new supply (>2% of stock underway) typically softens rents 12–24 months out; light construction supports rent growth.
Investment metrics
- 1% rule
- 1.45% ✓
- Cap rate
- 11.30%
- Cash-on-cash
- 17.90%
- DSCR
- 1.80
- GRM
- 5.8
CMA / ARV
- ARV (median comp)
- $197,731
- List price
- $162,000
- Delta
- -18.07%
- Verdict
- UNDERPRICED
- Comps
- 9 within 1.0 mi
Projected returns pro-forma
-3.0% appreciation · 4.91% rent growth · sell at horizon
- IRR
- 9.5%
- Equity multiple
- 1.38×
- Total profit
- $17,300
- Equity at exit
- $24,155
- IRR
- 20.3%
- Equity multiple
- 2.88×
- Total profit
- $85,118
- Equity at exit
- $14,007
Cash invested: $45,360 (down + closing). Projections, not guarantees.
Landlord ↔ Tenant lean methodology
- Overall (STATE)
- 87 Strongly Landlord-Friendly
- State Texas
- 87 Strongly Landlord-Friendly · R+5
- County
- — inherits STATE
- City
- — inherits STATE
ZIP-level market 77590
- Home prices YoY
- -19.3%
- Rents YoY
- 4.9%
- Active inventory
- 292
- Price-to-rent
- 11.5×
Monthly cashflow live
- Estimated rent
- $2,343 high interval (Pro) →
- Mortgage (P&I)
- −$850
- Tax from tax record
- −$257 /mo · $3,089/yr
- Insurance
- −$68
- Flood insurance flood zone
- −$66 /mo · $798/yr
- HOA
- −$0
- Vacancy / Maint / Mgmt
- −$492
- Net cashflow
- $610
Break-even live
2-unit breakdown (identical units grouped — click to expand)
| Units | Beds | Baths | Est. rent |
|---|---|---|---|
| 2× units | 2 | 1 | $2,342 |
| #1 | 2 | 1 | $1,171 |
| #2 | 2 | 1 | $1,171 |
| Total (2 units) | $2,343 | ||
UW: 25.0% down · 7.5% · 30yr · 1.5% tax · 5.0% vac · 8.0% maint · 8.0% mgmt
Financing live
Cash to close
- Down payment
- $40,500
- Closing costs
- $4,860
- Reserves months
- —
- Total cash needed
- —
Loan-product check · same deal, 3 products live
Conventional
25% down · 7.5% · 30yr
- Down + closing
- —
- Monthly P&I
- —
- Monthly cashflow
- —
- DSCR
- —
- Eligible?
- —
Personal DTI + credit; lowest rate.
DSCR
20% down · 8.5% · 30yr
- Down + closing
- —
- Monthly P&I
- —
- Monthly cashflow
- —
- DSCR
- —
- Eligible?
- —
No personal income docs; deal must DSCR.
Hard money
10% down · 12.0% · 12mo
- Down + closing
- —
- Monthly P&I
- —
- Monthly cashflow
- —
- DSCR
- —
- Eligible?
- —
Short-term bridge; refi at stabilization.
Rent comps 1 comps
| Address | Beds | Baths | Sqft | Rent | $/sqft | DOM | Units | Dist |
|---|---|---|---|---|---|---|---|---|
| 1137 1st Ave N Texas City, TX | 5.0 | 2.0 | 1786 | $1,775 | $0.99 | 24d | 1 | 0.27mi |
Listing history 27 events
-
2026-06-18days on market $162,000 Active 47 DOM
-
2026-06-17days on market $162,000 Active 46 DOM
-
2026-06-16days on market $162,000 Active 45 DOM
-
2026-06-15days on market $162,000 Active 44 DOM
-
2026-06-13days on market $162,000 Active 42 DOM
-
2026-06-09days on market $162,000 Active 38 DOM
-
2026-06-08days on market $162,000 Active 37 DOM
-
2026-06-07days on market $162,000 Active 36 DOM
-
2026-06-04days on market $162,000 Active 33 DOM
-
2026-06-03days on market $162,000 Active 32 DOM
-
2026-06-02days on market $162,000 Active 31 DOM
-
2026-06-01days on market $162,000 Active 30 DOM
-
2026-05-31days on market $162,000 Active 29 DOM
-
2026-05-02$162,000 Active 577-char remark
-
2025-04-01historical
-
2024-11-23$185,000 Active
-
2024-05-31historical
-
2024-03-20price $205,000
-
2024-03-06status Active
-
2024-03-04status Option Pending
-
2024-02-08price $210,000
-
2023-10-20price $212,500
-
2023-09-28$215,000 Active
-
2020-11-30soldstatus
-
2020-08-18historical
-
2020-07-31$150,000 Active
-
2006-03-17soldstatus
ⓘ Source: listings_history table (triggers on properties + properties_extension) + one-shot
backfill from property_details.listing_events for pre-trigger history.
Tax reassessment forecast TX · Resets to sale price
- Current annual tax
- $3,089 · $257/mo
- Projected year-2 tax
- $3,089 · $257/mo
- Expected delta
- $0/yr ($0/mo · -0.0%)
ⓘ Screening estimate from a state-policy table — verify with the county assessor before closing.
Climate risk First Street
- Flood 9/10 Extreme FEMA zone X · 99% chance over 30 yrs
- Wildfire 3/10 Moderate
- Heat 10/10 Extreme 7 d/yr ≥108°F today · 28 d/yr by 30 yrs out
- Wind 10/10 Extreme 99% chance of damaging wind over 30 yrs
- Air quality 2/10 Low 2 unhealthy d/yr today · 2 by 30 yrs out
Nearby sold comps map
Loading sold comps map…
Walkable amenities ~0.75 mi
Loading nearby amenities…
Taxation est. · year 1
- Rental income
- $28,116
- − Mortgage interest
- −$9,075
- − Property taxes
- −$3,089
- − Insurance
- −$1,607
- − Repairs & maintenance
- −$2,249
- − Management
- −$2,249
- − Depreciation
- −$4,713
- Taxable income
- $5,133
- Est. tax owed @ 24.0%
- −$1,232
- After-tax cash flow
- $6,088/yr
For passive investors: Depreciation is non-cash, so a rental often shows a tax loss while cash-flowing — sheltering income. Rental losses are passive: they offset passive income freely, and up to $25,000/yr can offset ordinary (W-2) income if you actively participate and your MAGI is under $100k (phasing out to $0 by $150k); unused losses carry forward. On sale, claimed depreciation is recaptured at up to 25%, and gains may owe capital-gains tax (a 1031 exchange can defer both). Figures are a year-1 estimate at your 24.0% rate — not tax advice; consult a CPA.
Schools (NCES district)
- District
- Texas City ISD
- NCES district ID
- 4842510
- Math proficiency
- 28% ▼ -10.00%
- Reading proficiency
- 29% ▼ -4.00%
- Median HH income
- $44,875
- Composite
- 24.47/100
- National rank
- #7664
- State rank
- #655 of 826 in TX
Livability — Texas City
- Score
- 62/100
- State rank
- #907
- US rank
- #16268
Category grades
Schools grade is shown separately in the Schools card above.
Census & demographics
- Census place
- Texas City, TX
- County
- Galveston County · 357,330 people
- City population
- 49,936
- Metro
- Houston-The Woodlands-Sugar Land, TX
- Population (ZIP)
- 31,642
- Household income
- $65,801
- Rent vs Own
- Severe rent burden
- 1821.0
Population outlook (Galveston County) Hauer SSP2
- Today (2025)
- 390,640 people
- By 2030
- 425,226 · +8.9%
- By 2040
- 493,765 · +26.4%
- By 2050
- 559,698 · +43.3%
- By 2075
- 719,260 · +84.1%
- By 2100
- 819,628 · +109.8%
Race, ethnicity, and origin ACS 2023
- Neighborhood character
- Diverse neighborhood (Simpson 0.66)
- Race & ethnicity
- White 41% Hispanic / Latino 38% Two or more races 20% Black 17% Asian 2%
- Hispanic origin (detail)
- Mexican 33% Puerto Rican 1%
- Common ancestry
- Lithuanian 2% Slovak 1% Italian 1%
- Foreign-born
- 9% · Canada, Vietnam
- Languages at home
- 72% English-only · Spanish 26% Other Indo-European 1%
Political lean MEDSL · Galveston
- 2024 margin
- Strong R (+27.4) · D 35.7% · R 63.1% · Other 1.2%
- 2008→2024 swing
- -7.9pp toward R · 2008: -19.5pp · 2024: -27.4pp
- All cycles
- 2024: R+27.4 2020: R+22.6 2016: R+22.6 2012: R+26.9 2008: R+19.5
Not yet ingested
- Civics
- —
Market trends
- HPI YoY
- ▼ -58.35%
- Current HPI
- 244.5809
- Rent YoY
- ▲ 4.91%
- Metro
- Houston-The Woodlands-Sugar Land, TX
- State GDP YoY
- ▲ 3.95%
- F500 in state
- 110
Industry mix (Fortune 500 HQ in TX)
| Industry | F500 HQs | Revenue |
|---|---|---|
| Energy | 16 | $1,198B |
|
||
| Technology | 5 | $198B |
|
||
| Engineering / Construction | 4 | $72B |
|
||
| Energy Services | 3 | $60B |
|
||
| Utilities | 3 | $41B |
|
||
| Healthcare | 2 | $330B |
|
||
Price history
+8.0% since first listed14 events — show timeline
- 2026-05-02 Listed $162,000 HARMLS
- 2025-04-01 Listing Removed — HARMLS
- 2024-11-23 Listed $185,000 HARMLS
- 2024-05-31 Listing Removed — HARMLS
- 2024-03-20 Price Changed $205,000 HARMLS
- 2024-03-06 Relisted — HARMLS
- 2024-03-04 Pending — HARMLS
- 2024-02-08 Price Changed $210,000 HARMLS
- 2023-10-20 Price Changed $212,500 HARMLS
- 2023-09-28 Listed $215,000 HARMLS
- 2020-11-30 Sold (Public Records) — Public Records
- 2020-08-18 Listing Removed — HARMLS
- 2020-07-31 Listed $150,000 HARMLS
- 2006-03-17 Sold (Public Records) — Public Records
Property tax history
+12.9%/yrLatest (2025): $3,089 · +21.8% YoY. Source: county tax records.
Cash-flow waterfall
monthlySold comps — $/sqft
last 12 mo · ≤1 miLoading sold comps…