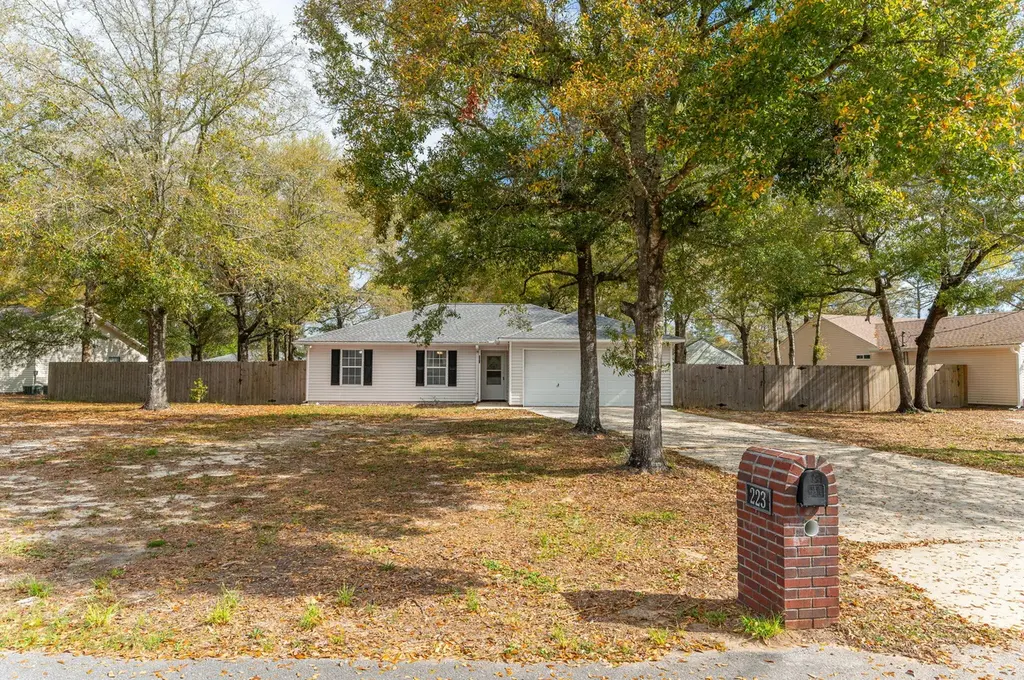
223 Runnymeade Dr · Crestview, FL
Flood risk 1/10 · Minimal
- FEMA flood zone
- X (unshaded)
- Chance of flooding over 30 yrs
- 0.0%
- Est. flood insurance / yr
- $507 – $1,088
Fire risk 4/10 · Minor
- Est. fire insurance / yr
- $947 – $1,759
Heat risk 9/10 · Severe
- Hot days now (above 107°F)
- 7 days/yr
- Hot days in 30 yrs
- 21 days/yr
Wind risk 9/10 · Severe
- Chance of severe wind over 30 yrs
- 99.0%
Air-quality risk 2/10 · Minimal
- Unhealthy air days now
- 1 days/yr
- Unhealthy air days in 30 yrs
- 1 days/yr
Risk factors via First Street. Map © Google.
Why this score? — see what drove the D- grade
The composite is a weighted blend of 9 inputs, each scored 0–100. Each bar is that input's sub-score; the figure is the points it added to the 100-point composite (weight × sub-score).
- Cash flow +11.7/30.0
- ARV discount +7.3/15.0
- Schools +5.2/10.0
- Livability +3.8/5.0
- DSCR +3.5/10.0
- Rent growth +2.5/5.0
- Condition / age +2.5/5.0
- 1% rule +2.2/10.0
- Appreciation +0.0/10.0
$244,900
🖨 Deal sheet (PDF) 📄 Offer letter ✓ Due diligence
Listing remarks MLS
Well-maintained and affordable home located on a spacious . 32-acre lot in a convenient Crestview location near shopping, dining, healthcare, and military bases. This home features a bright living room with cathedral ceilings and a corner fireplace, plus brand new carpet throughout. The primary bedroom offers a coffered ceiling and walk-in closet, and the kitchen includes ample cabinetry and new flooring with all major appliances, including washer and dryer. Major updates include roof (2020), HVAC (2024), and water heater (2025). Enjoy a large, privacy-fenced backyard with plenty of space to relax or entertain
Key facts
- Crestview location
- Ample cabinetry
- New flooring
Tags
Neighborhood map
What this means for you Summary
Snapshot
- This is a 3-bed/2.0-bath single-family listed at $245k.
Deal economics
- At list price, monthly cash flow is $-70 ($-844/yr) — negative.
- To cash-flow at today's rent, offer at most $232k (5.1% below list).
- To meet the 1% rule (rent ≥ 1% of price), the offer needs to be $177k (27.9% below list).
- Recommended offer: $177k (27.9% below list) — sets the bar for 1% rule.
- Cap rate 5.9% vs local median 4.4% in Crestview — top-decile yield for the area; either an underpriced asset or a hidden risk that comps aren't pricing in. Stress-test before assuming the spread holds.
Location & tenants
- Location reads 75/100 on livability (#252 in FL, #3,858 nationally) — a middle-class / working-renter tenant base. Strengths: cost of living A+, housing A+, health & safety A+; Watch: employment D, amenities F, commute F.
- Okaloosa (other): math 60% / reading 60% proficiency, ranked #12 of 73 in FL (top 16%) — acceptable for families but not a draw, mixed tenant base, ~2y average lease.
- Market conditions: Rents flat; 526 active listings in the ZIP; 40 comparable units currently listed for rent nearby; rentals at typical pace (median 23d on market — plan ~3-4 weeks tenant-placement turnaround); 48% of comp listings sitting > 30 days — soft ceiling on asking rent; 1,268 units permitted in Okaloosa County in 2024 (175 in 5+ unit buildings).
Forward outlook
- Local home prices are declining (-3.0%/yr); year-one equity from $2k of loan paydown is wiped out by about $7k of value loss. Plan a longer hold.
- Okaloosa County population projected at +37% by 2050 — long-run rental-demand tailwind backs the buy-and-hold thesis.
Negotiation context
- It's been on market 39 days — a 3% lower offer ($238k) is reasonable based on typical stale-listing flexibility.
- 6 sale attempts since 17y ago; this cycle's ask has dropped $15k (6%) from the opening price — seller is motivated, your offer sets the floor, not the list.
Risks & watch-outs
- Climate carrying-cost: severe wind risk, 99% chance of damaging wind over 30y; extreme-heat days projected 7→21/yr by 2055 (HVAC capex compounding) — expect insurance premiums to compound above CPI over the hold.
Questions for the listing agent
- What do current leases actually rent for vs. the listed asking? Can we see a recent rent roll and the last 12 months of T-12 income?
- It's been on market 39 days. Have you received any prior offers? Is the seller open to a 28% concession, seller financing, or rate buy-down credit?
- Is there a deadline driving the sale (1031 exchange, divorce, estate, relocation)? That informs how much negotiation room exists.
- Schools are B-rated — typically a magnet for longer-tenancy family renters. What's the average tenant stay here, and is there a school-zone premium baked into asking?
- The area grade is low — what's the realistic commute time and amenity access for the typical tenant pool here? Any planned neighborhood developments (good or bad) we should know about?
- What's the average days-on-market for RENTAL listings here right now (not sales)? A rising rental-DOM trend means longer vacancies and softer asking-rent achievability than the comps imply.
- What's the recent tenant-quality profile in this submarket — average credit score on applications, eviction rate, late-payment / NSF rate, and stable-employment percentage? A property-management company in the area should have these aggregated.
- How much new for-sale + rental construction is in the pipeline within 1–3 miles? Heavy new supply typically softens prices + rents 12–24 months out; constrained supply supports both.
Investment metrics
- 1% rule
- 0.72% ✗
- Cap rate
- 5.95%
- Cash-on-cash
- -1.23%
- DSCR
- 0.95
- GRM
- 11.6
CMA / ARV
- ARV (median comp)
- $243,767
- List price
- $244,900
- Delta
- 0.46%
- Verdict
- FAIR
- Comps
- 20 within 1.0 mi
Show comp detail 12 sales within ~0.75 mi
| Address | Dist | Beds/Ba | Sqft | Sold | Price | $/sf | Match |
|---|---|---|---|---|---|---|---|
| 223 Runnymeade Dr | 0.00mi | 3/2.0 | 1,272 (0%) | 1mo | $240,000 | $189 | 100 |
| 585 Brock Ave | 0.60mi | 3/2.0 | 1,267 (-0%) | 2mo | $239,850 | $189 | 70 |
| 579 Brock Ave | 0.60mi | 3/2.0 | 1,267 (-0%) | 4mo | $244,800 | $193 | 68 |
| 583 Brock Ave | 0.60mi | 3/2.0 | 1,267 (-0%) | 4mo | $239,900 | $189 | 68 |
| 577 Brock Ave | 0.60mi | 3/2.0 | 1,267 (-0%) | 4mo | $244,800 | $193 | 68 |
| 860 S Rayburn St | 0.65mi | 3/2.0 | 1,267 (-0%) | 2mo | $244,900 | $193 | 67 |
| 858 Rayburn St | 0.65mi | 3/2.0 | 1,267 (-0%) | 3mo | $244,900 | $193 | 67 |
| 202 Ladue Ave | 0.67mi | 3/2.0 | 1,281 (+1%) | 5mo | $245,500 | $192 | 64 |
| 591 Brock Ave | 0.60mi | 3/2.0 | 1,187 (-7%) | 5mo | $199,999 | $168 | 57 |
| 593 Brock Ave | 0.60mi | 3/2.0 | 1,187 (-7%) | 5mo | $199,900 | $168 | 56 |
| 420 E Williams Ave | 0.49mi | 3/2.0 | 1,106 (-13%) | 4mo | $195,900 | $177 | 52 |
| 703 Brock Ave | 0.62mi | 3/1.0 | 1,121 (-12%) | 4mo | $145,000 | $129 | 44 |
Match score weights: distance 35% · size 25% · config 20% · recency 20%. Top-matched comps best support the ARV.
Projected returns pro-forma
-3.0% appreciation · 0.12% rent growth · sell at horizon
- IRR
- -21.2%
- Equity multiple
- 0.28×
- Total profit
- $-49,253
- Equity at exit
- $36,515
- IRR
- -21.9%
- Equity multiple
- 0.00×
- Total profit
- $-68,388
- Equity at exit
- $21,174
Cash invested: $68,572 (down + closing). Projections, not guarantees.
Landlord ↔ Tenant lean methodology
- Overall (STATE)
- 87 Strongly Landlord-Friendly
- State Florida
- 87 Strongly Landlord-Friendly · R+3
- County
- — inherits STATE
- City
- — inherits STATE
ZIP-level market 32539
- Home prices YoY
- -17.8%
- Rents YoY
- 0.1%
- Active inventory
- 526
- Price-to-rent
- 11.6×
Monthly cashflow live
- Estimated rent
- $1,766 high interval (Pro) →
- Mortgage (P&I)
- −$1,284
- Tax from tax record
- −$79 /mo · $951/yr
- Insurance
- −$102
- HOA
- −$0
- Vacancy / Maint / Mgmt
- −$371
- Net cashflow
- $-70
Break-even live
Sensitivity live
| Price | -10% $68 | -5% $-1 | +0% $-70 | +5% $-140 | +10% $-209 |
|---|---|---|---|---|---|
| Rent | -10% $-210 | -5% $-140 | +0% $-70 | +5% $-1 | +10% $69 |
| Rate | -1.0pp $53 | -0.5pp $-8 | base $-70 | +0.5pp $-134 | +1.0pp $-198 |
UW: 25.0% down · 7.5% · 30yr · 1.5% tax · 5.0% vac · 8.0% maint · 8.0% mgmt
Financing live
Cash to close
- Down payment
- $61,225
- Closing costs
- $7,347
- Reserves months
- —
- Total cash needed
- —
Loan-product check · same deal, 3 products live
Conventional
25% down · 7.5% · 30yr
- Down + closing
- —
- Monthly P&I
- —
- Monthly cashflow
- —
- DSCR
- —
- Eligible?
- —
Personal DTI + credit; lowest rate.
DSCR
20% down · 8.5% · 30yr
- Down + closing
- —
- Monthly P&I
- —
- Monthly cashflow
- —
- DSCR
- —
- Eligible?
- —
No personal income docs; deal must DSCR.
Hard money
10% down · 12.0% · 12mo
- Down + closing
- —
- Monthly P&I
- —
- Monthly cashflow
- —
- DSCR
- —
- Eligible?
- —
Short-term bridge; refi at stabilization.
Rent comps 40 comps
| Address | Beds | Baths | Sqft | Rent | $/sqft | DOM | Units | Dist |
|---|---|---|---|---|---|---|---|---|
| 475 Aplin Rd Crestview, FL | 1.0–2.0 | 1.0–2.0 | 764 | $999 | $1.31 | 46d | 5 | 0.21mi |
| 14 Flora Cv Crestview, FL | 3.0 | 2.0 | 1357 | $1,750 | $1.29 | 23d | 1 | 0.30mi |
| 301 E Redstone Ave Crestview, FL | 1.0–3.0 | 1.0–2.0 | 1100 | $2,202 | $2.00 | 15d | 20 | 0.31mi |
| 4 Holly Rd Crestview, FL | 3.0 | 2.0 | 1165 | $1,725 | $1.48 | 15d | 1 | 0.46mi |
| 4 Holly Rd Crestview, FL | 3.0 | 2.0 | 1165 | $1,725 | $1.48 | 23d | 1 | 0.46mi |
| 111 Steeplechase Dr Crestview, FL | 3.0 | 2.0 | 1637 | $1,795 | $1.10 | 46d | 1 | 0.53mi |
| 223 Johnson Ct #223 Crestview, FL | 3.0 | 2.5 | 1496 | $1,450 | $0.97 | 46d | 1 | 0.53mi |
| 408 Church St Crestview, FL | 2.0 | 2.0 | 1086 | $1,200 | $1.10 | 46d | 1 | 0.54mi |
| 124 Sandstone Trl Crestview, FL | 3.0 | 2.0 | 1748 | $1,900 | $1.09 | 15d | 1 | 0.55mi |
| 211 Johnson Ct Crestview, FL | 3.0 | 2.5 | 1534 | $1,450 | $0.95 | 23d | 1 | 0.56mi |
| 295 Limestone Cir Crestview, FL | 3.0 | 2.0 | 1107 | $1,625 | $1.47 | 46d | 1 | 0.58mi |
| 204 Johnson Ct Crestview, FL | 3.0 | 2.5 | 1496 | $1,450 | $0.97 | 46d | 1 | 0.59mi |
| 202 Johnson Ct Crestview, FL | 3.0 | 2.5 | 1496 | $1,450 | $0.97 | 46d | 1 | 0.59mi |
| 111 Swaying Pine Ct Crestview, FL | 3.0 | 2.5 | 1440 | $1,300 | $0.90 | 46d | 1 | 0.64mi |
| 143 Swaying Pine Ct Crestview, FL | 3.0 | 2.5 | 1440 | $1,450 | $1.01 | 23d | 1 | 0.69mi |
| 661 Brookmeade Dr Crestview, FL | 4.0 | 2.0 | 1637 | $2,200 | $1.34 | 15d | 1 | 0.69mi |
| 147 Swaying Pine Ct Crestview, FL | 3.0 | 2.5 | 1309 | $1,395 | $1.07 | 23d | 1 | 0.70mi |
| 343 Crooked Pine Trl Unit 1 Crestview, FL | 3.0 | 2.5 | 1415 | $1,350 | $0.95 | 15d | 1 | 0.71mi |
| 347 Crooked Pine Trl Crestview, FL | 3.0 | 2.5 | 1356 | $1,500 | $1.11 | 15d | 1 | 0.71mi |
| 163 Swaying Pine Ct Crestview, FL | 3.0 | 2.5 | 1356 | $1,300 | $0.96 | 46d | 1 | 0.72mi |
| 177 Iron Horse Dr E Crestview, FL | 3.0 | 2.5 | 1551 | $1,700 | $1.10 | 46d | 1 | 0.73mi |
| 365 Crooked Pine Trl Crestview, FL | 3.0 | 2.5 | 1356 | $1,350 | $1.00 | 15d | 1 | 0.75mi |
| 812 E Edney Ave Crestview, FL | 2.0 | 2.0 | 1024 | $1,400 | $1.37 | 23d | 1 | 0.79mi |
| 812 E Edney Ave Crestview, FL | 2.0 | 2.0 | 1024 | $1,400 | $1.37 | 46d | 1 | 0.79mi |
| 114 Blooming Cv Crestview, FL | 3.0 | 2.0 | 1712 | $2,095 | $1.22 | 23d | 1 | 0.83mi |
| 2500 E Redstone Ave Crestview, FL | 1.0–3.0 | 1.0–2.0 | 1428 | $1,952 | $1.37 | 15d | 6 | 0.87mi |
| 234 Swaying Pine Ct Crestview, FL | 3.0 | 2.5 | 1440 | $1,350 | $0.94 | 46d | 1 | 0.88mi |
| 107 Trenton Ave Crestview, FL | 4.0 | 3.0 | 1799 | $2,150 | $1.20 | 46d | 1 | 0.88mi |
| 240 Swaying Pine Ct Crestview, FL | 3.0 | 2.5 | 1356 | $1,400 | $1.03 | 46d | 1 | 0.89mi |
| 210 Lyla Ln Crestview, FL | 4.0 | 2.0 | 1815 | $2,295 | $1.26 | 46d | 1 | 0.89mi |
| 201 Lyla Ln Crestview, FL | 3.0 | 2.0 | 1727 | $2,095 | $1.21 | 15d | 1 | 0.91mi |
| 201 Lyla Ln Crestview, FL | 3.0 | 2.0 | 1727 | $1,999 | $1.16 | 23d | 1 | 0.91mi |
| 157 Blooming Cv Crestview, FL | 3.0 | 2.0 | 1727 | $1,995 | $1.16 | 46d | 1 | 0.95mi |
| 3016 Aplin Rd Crestview, FL | 3.0 | 2.0 | 1280 | $1,400 | $1.09 | 46d | 1 | 0.98mi |
| 648 Alysheba Dr Crestview, FL | 3.0 | 2.0 | 1341 | $1,800 | $1.34 | 23d | 1 | 0.98mi |
| 4821 Acorn Dr Crestview, FL | 3.0 | 2.0 | 1705 | $1,930 | $1.13 | 15d | 1 | 1.03mi |
| 4821 Acorn Dr Crestview, FL | 3.0 | 2.0 | 1705 | $1,930 | $1.13 | 23d | 1 | 1.03mi |
| 503 W Griffith Ave Crestview, FL | 3.0 | 1.0 | 962 | $1,395 | $1.45 | 46d | 1 | 1.09mi |
| 401 S Booker St Crestview, FL | 3.0 | 1.5 | 1040 | $1,225 | $1.18 | 46d | 1 | 1.10mi |
| 200 Mirage Ave Crestview, FL | 1.0–3.0 | 1.0–2.0 | 1100 | $1,904 | $1.73 | 15d | 34 | 1.27mi |
Listing history 18 events
-
2026-05-12status Pending 617-char remark
Show marketing remark (617 chars)
Well-maintained and affordable home located on a spacious . 32-acre lot in a convenient Crestview location near shopping, dining, healthcare, and military bases. This home features a bright living room with cathedral ceilings and a corner fireplace, plus brand new carpet throughout. The primary bedroom offers a coffered ceiling and walk-in closet, and the kitchen includes ample cabinetry and new flooring with all major appliances, including washer and dryer. Major updates include roof (2020), HVAC (2024), and water heater (2025). Enjoy a large, privacy-fenced backyard with plenty of space to relax or entertain
-
2026-05-01price $244,900 617-char remark
Show marketing remark (617 chars)
Well-maintained and affordable home located on a spacious . 32-acre lot in a convenient Crestview location near shopping, dining, healthcare, and military bases. This home features a bright living room with cathedral ceilings and a corner fireplace, plus brand new carpet throughout. The primary bedroom offers a coffered ceiling and walk-in closet, and the kitchen includes ample cabinetry and new flooring with all major appliances, including washer and dryer. Major updates include roof (2020), HVAC (2024), and water heater (2025). Enjoy a large, privacy-fenced backyard with plenty of space to relax or entertain
-
2026-04-20price $249,900 617-char remark
Show marketing remark (617 chars)
Well-maintained and affordable home located on a spacious . 32-acre lot in a convenient Crestview location near shopping, dining, healthcare, and military bases. This home features a bright living room with cathedral ceilings and a corner fireplace, plus brand new carpet throughout. The primary bedroom offers a coffered ceiling and walk-in closet, and the kitchen includes ample cabinetry and new flooring with all major appliances, including washer and dryer. Major updates include roof (2020), HVAC (2024), and water heater (2025). Enjoy a large, privacy-fenced backyard with plenty of space to relax or entertain
-
2026-04-03$259,900 Active 617-char remark
Show marketing remark (617 chars)
Well-maintained and affordable home located on a spacious . 32-acre lot in a convenient Crestview location near shopping, dining, healthcare, and military bases. This home features a bright living room with cathedral ceilings and a corner fireplace, plus brand new carpet throughout. The primary bedroom offers a coffered ceiling and walk-in closet, and the kitchen includes ample cabinetry and new flooring with all major appliances, including washer and dryer. Major updates include roof (2020), HVAC (2024), and water heater (2025). Enjoy a large, privacy-fenced backyard with plenty of space to relax or entertain
-
2026-03-26historical $1,650
-
2025-11-19price $1,650
-
2025-05-17price $1,750
-
2025-04-09$1,850
-
2025-03-20soldstatus $220,000
-
2025-02-28price $259,995
-
2025-01-16$269,995 Active
-
2010-03-02soldstatus $115,700
-
2010-02-26soldstatus $115,700
-
2010-02-26soldstatus $115,700
-
2010-01-15$115,700
-
2010-01-15$115,700
-
2009-10-19$125,000
-
1996-01-01soldstatus $8,000
ⓘ Source: listings_history table (triggers on properties + properties_extension) + one-shot
backfill from property_details.listing_events for pre-trigger history.
Tax reassessment forecast FL · Resets to sale price
- Current annual tax
- $951 · $79/mo
- Projected year-2 tax
- $2,033 · $169/mo
- Expected delta
- +$1,082/yr (+$90/mo · 113.8%)
ⓘ Screening estimate from a state-policy table — verify with the county assessor before closing.
Climate risk First Street
- Flood 1/10 Low FEMA zone X (unshaded) · 0% chance over 30 yrs
- Wildfire 4/10 Moderate
- Heat 9/10 Extreme 7 d/yr ≥107°F today · 21 d/yr by 30 yrs out
- Wind 9/10 Extreme 99% chance of damaging wind over 30 yrs
- Air quality 2/10 Low 1 unhealthy d/yr today · 1 by 30 yrs out
Nearby sold comps map
Loading sold comps map…
Walkable amenities ~0.75 mi
Loading nearby amenities…
Taxation est. · year 1
- Rental income
- $21,193
- − Mortgage interest
- −$13,718
- − Property taxes
- −$951
- − Insurance
- −$1,224
- − Repairs & maintenance
- −$1,695
- − Management
- −$1,695
- − Depreciation
- −$7,124
- Taxable loss
- −$5,216
- Est. tax savings @ 24.0%
- +$1,252
- After-tax cash flow
- $407/yr
For passive investors: Depreciation is non-cash, so a rental often shows a tax loss while cash-flowing — sheltering income. Rental losses are passive: they offset passive income freely, and up to $25,000/yr can offset ordinary (W-2) income if you actively participate and your MAGI is under $100k (phasing out to $0 by $150k); unused losses carry forward. On sale, claimed depreciation is recaptured at up to 25%, and gains may owe capital-gains tax (a 1031 exchange can defer both). Figures are a year-1 estimate at your 24.0% rate — not tax advice; consult a CPA.
Schools (NCES district)
- District
- Okaloosa
- NCES district ID
- 1201380
- Math proficiency
- 60% ▼ -12.00%
- Reading proficiency
- 60% ▼ -4.00%
- Median HH income
- $55,601
- Composite
- 51.62/100
- National rank
- #1705
- State rank
- #12 of 73 in FL
Livability — Crestview
- Score
- 75/100
- State rank
- #252
- US rank
- #3858
Category grades
Schools grade is shown separately in the Schools card above.
Census & demographics
- Census place
- Crestview, FL
- County
- Okaloosa County · 194,352 people
- City population
- 58,889
- Metro
- Crestview-Fort Walton Beach-Destin, FL
- Population (ZIP)
- 33,290
- Household income
- $74,369
- Rent vs Own
- Severe rent burden
- 371.0
Population outlook (Okaloosa County) Hauer SSP2
- Today (2025)
- 235,133 people
- By 2030
- 253,483 · +7.8%
- By 2040
- 289,537 · +23.1%
- By 2050
- 322,954 · +37.3%
- By 2075
- 399,624 · +70.0%
- By 2100
- 425,311 · +80.9%
Race, ethnicity, and origin ACS 2023
- Neighborhood character
- Predominantly White (73%)
- Race & ethnicity
- White 73% Black 12% Two or more races 8% Hispanic / Latino 7% Asian 1%
- Hispanic origin (detail)
- Mexican 3% Puerto Rican 2%
- Common ancestry
- Lithuanian 4% Iranian 2% Romanian 2%
- Foreign-born
- 3% · Canada
- Languages at home
- 94% English-only · Spanish 3% Russian/Polish/Slavic 1% Other Asian/Pacific 1%
Political lean MEDSL · Okaloosa
- 2024 margin
- Solid R (+42.4) · D 28.2% · R 70.7% · Other 1.1%
- 2008→2024 swing
- +2.5pp toward D · 2008: -44.9pp · 2024: -42.4pp
- All cycles
- 2024: R+42.4 2020: R+39.1 2016: R+47.8 2012: R+49.4 2008: R+44.9
Not yet ingested
- Civics
- —
Market trends
- HPI YoY
- ▼ -56.52%
- Current HPI
- 261.1557
- Rent YoY
- ▲ 0.12%
- Metro
- Crestview-Fort Walton Beach-Destin, FL
- State GDP YoY
- ▲ 3.28%
- F500 in state
- 36
Industry mix (Fortune 500 HQ in FL)
| Industry | F500 HQs | Revenue |
|---|---|---|
| Industrial Technology | 2 | $29B |
|
||
| Insurance | 2 | $17B |
|
||
| Retail | 1 | $60B |
|
||
| Technology Distribution | 1 | $58B |
|
||
| Homebuilding | 1 | $35B |
|
||
| Technology Manufacturing | 1 | $35B |
|
||
Price history
+2961.2% since first listed18 events — show timeline
- 2026-05-12 Pending — ECAR
- 2026-05-01 Price Changed $244,900 ECAR
- 2026-04-20 Price Changed $249,900 ECAR
- 2026-04-03 Listed $259,900 ECAR
- 2026-03-26 Rental Removed $1,650 APPFOLIO
- 2025-11-19 Price Changed $1,650 APPFOLIO
- 2025-05-17 Price Changed $1,750 APPFOLIO
- 2025-04-09 Listed for Rent $1,850 APPFOLIO
- 2025-03-20 Sold (Public Records) $220,000 Public Records
- 2025-02-28 Price Changed $259,995 ECAR
- 2025-01-16 Listed $269,995 ECAR
- 2010-03-02 Sold (Public Records) $115,700 Public Records
- 2010-02-26 Sold (MLS) $115,700 ECAR
- 2010-02-26 Sold (MLS) $115,700 NAMLS
- 2010-01-15 Listed $115,700 ECAR
- 2010-01-15 Listed $115,700 NAMLS
- 2009-10-19 Listed $125,000 ECAR
- 1996-01-01 Sold (Public Records) $8,000 Public Records
Property tax history
+2.4%/yrLatest (2025): $951 · +3.6% YoY. Source: county tax records.
Cash-flow waterfall
monthlySold comps — $/sqft
last 12 mo · ≤1 miLoading sold comps…