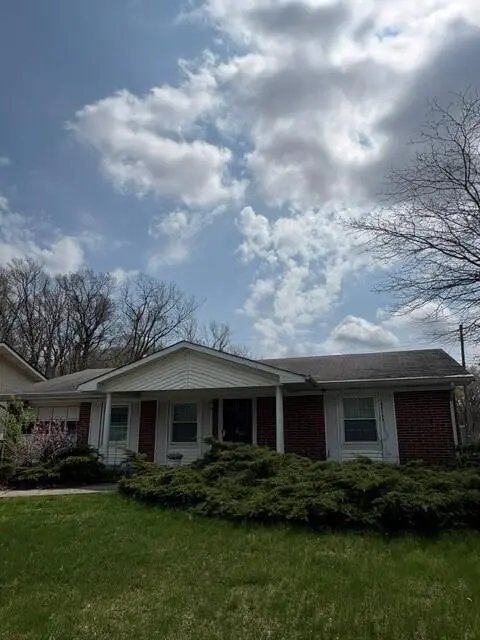
8201 Hickory Ave · Gary, IN
Flood risk 1/10 · Minimal
- FEMA flood zone
- X (unshaded)
- Chance of flooding over 30 yrs
- 0.0%
- Est. flood insurance / yr
- $507 – $1,088
Fire risk 8/10 · Major
- Est. fire insurance / yr
- $717 – $1,331
Heat risk 3/10 · Minor
- Hot days now (above 101°F)
- 7 days/yr
- Hot days in 30 yrs
- 15 days/yr
Wind risk 2/10 · Minimal
- Chance of severe wind over 30 yrs
- 1.0%
Air-quality risk 4/10 · Minor
- Unhealthy air days now
- 5 days/yr
- Unhealthy air days in 30 yrs
- 6 days/yr
Risk factors via First Street. Map © Google.
Why this score? — see what drove the D grade
The composite is a weighted blend of 9 inputs, each scored 0–100. Each bar is that input's sub-score; the figure is the points it added to the 100-point composite (weight × sub-score).
- ARV discount +14.6/15.0
- Cash flow +11.9/30.0
- Livability +3.7/5.0
- DSCR +3.5/10.0
- 1% rule +2.7/10.0
- Rent growth +2.5/5.0
- Condition / age +2.5/5.0
- Schools +0.5/10.0
- Appreciation +0.0/10.0
$239,900
🖨 Deal sheet (PDF) 📄 Offer letter ✓ Due diligence
Listing remarks
Terrific Investment Opportunity, or Update and make this Affordable Home your Own. This 3 Bedroom, 1,600' Sq. ft. Open Concept Brick Home with a Newer 2.5 Car Garage is Located in the Well-Kept Lakewood Hills Neighborhood of Miller. Amenities Include: Formal Living and Dining Rooms, Den, Parquet Flooring, and a Fenced Yard. Updates Include: Windows and Architectural Roof. The Interior is in need of Minor Cosmetic Updates. With its Close Proximity to Lake Michigan Beaches, Marquette Park, South Shore Train Station, Major Highways, Restaurants, Shopping, Entertainment, this Home is a Truly MUST-SEE!
Key facts
- Newer garage
- Fenced yard
- 7,187 sq ft lot
Tags
Property features AI
Exterior
- Parking: Garage with approximately 2.5 vehicle spaces
- Utilities: Public water; Public sewer
- Home design: Single-story home; Built in 1963
- Construction: Brick construction
- Exterior features: Neighborhood view; Fenced yard; Brick exterior
Interior
- Kitchen: Range; Refrigerator
- Bedrooms: Primary bedroom; Bedroom 2; Bedroom 3
- Bathrooms: 1 full bathroom
- Heating & cooling: Forced air heating (natural gas); Central air conditioning
- Interior features: Open floorplan; 8 total rooms
- Laundry & utility: Washer; Dryer; Laundry room
Neighborhood map
What this means for you Summary
Snapshot
- This is a 3-bed/1.0-bath single-family listed at $240k.
Deal economics
- At list price, monthly cash flow is $-62 ($-745/yr) — negative.
- To cash-flow at today's rent, offer at most $229k (4.6% below list).
- To meet the 1% rule (rent ≥ 1% of price), the offer needs to be $185k (22.9% below list).
- Recommended offer: $185k (22.9% below list) — sets the bar for 1% rule.
- Cap rate 6.0% vs local median 9.1% in Gary — below-typical yield; the buyer is paying a premium for something (appreciation thesis, condition, location) that the cap rate doesn't capture.
Location & tenants
- Location reads 73/100 on livability (#105 in IN) — a middle-class / working-renter tenant base. Strengths: commute A+, cost of living A+, housing A+; Watch: schools F, crime F, employment F.
- Gary Community School Corporation (urban): math 3% / reading 11% proficiency, ranked #299 of 301 in IN (top 99%) — low school quality limits family demand, transient renter base, plan for 1-2y turnover; 80% free/reduced lunch — lower-income household profile, screen leases tightly.
- Market conditions: 88 active listings in the ZIP; 2 comparable units currently listed for rent nearby; 1,642 units permitted in Lake County in 2024 (14 in 5+ unit buildings).
- At $1,850/mo this rent would consume 48% of the median local household income ($46k/yr) (locally 656% of renters already pay >50% of income on rent) — very limited rent-growth headroom before tenants either downsize or default.
Forward outlook
- Local home prices are declining (-3.0%/yr); year-one equity from $2k of loan paydown is wiped out by about $7k of value loss. Plan a longer hold.
- Lake County population projected to shrink 7% by 2050 — rents likely to lag national; underwrite the cash flow, not the appreciation.
Negotiation context
- It's been on market 52 days — a 3% lower offer ($233k) is reasonable based on typical stale-listing flexibility.
Risks & watch-outs
- Climate carrying-cost: severe wildfire risk — expect insurance premiums to compound above CPI over the hold.
Questions for the listing agent
- What do current leases actually rent for vs. the listed asking? Can we see a recent rent roll and the last 12 months of T-12 income?
- It's been on market 52 days. Have you received any prior offers? Is the seller open to a 23% concession, seller financing, or rate buy-down credit?
- Built in 1963 — when were the roof, HVAC, electrical panel, plumbing, and water heater last replaced?
- Is there a deadline driving the sale (1031 exchange, divorce, estate, relocation)? That informs how much negotiation room exists.
- Schools are F-rated, which usually means shorter tenancies and higher turnover. Who's the typical renter profile here, and what's been the actual vacancy rate?
- Crime grade is F in this area — have there been break-ins, vandalism, or insurance claims at this property in the last 3 years? What carrier currently insures it and at what premium?
- The area grade is low — what's the realistic commute time and amenity access for the typical tenant pool here? Any planned neighborhood developments (good or bad) we should know about?
- What's the average days-on-market for RENTAL listings here right now (not sales)? A rising rental-DOM trend means longer vacancies and softer asking-rent achievability than the comps imply.
- What's the recent tenant-quality profile in this submarket — average credit score on applications, eviction rate, late-payment / NSF rate, and stable-employment percentage? A property-management company in the area should have these aggregated.
- How much new for-sale + rental construction is in the pipeline within 1–3 miles? Heavy new supply typically softens prices + rents 12–24 months out; constrained supply supports both.
Investment metrics
- 1% rule
- 0.77% ✗
- Cap rate
- 5.98%
- Cash-on-cash
- -1.11%
- DSCR
- 0.95
- GRM
- 10.8
CMA / ARV
- ARV (median comp)
- $284,538
- List price
- $239,900
- Delta
- -15.69%
- Verdict
- UNDERPRICED
- Comps
- 20 within 1.0 mi
Show comp detail 9 sales within ~0.75 mi
| Address | Dist | Beds/Ba | Sqft | Sold | Price | $/sf | Match |
|---|---|---|---|---|---|---|---|
| 910 N Vanderburg St | 0.55mi | 2/1.0 (-1) | 1,336 (0%) | 5mo | $249,900 | $187 | 65 |
| 7704 Maple Ave | 0.56mi | 3/1.5 | 1,344 (+1%) | 11mo | $205,000 | $153 | 62 |
| 8000 Maple Ave | 0.47mi | 2/2.0 (-1) | 1,226 (-8%) | 2mo | $275,000 | $224 | 54 |
| 665 Morgan St | 0.59mi | 3/2.0 | 1,344 (+1%) | 22mo | $295,000 | $219 | 50 |
| 1045 N Shelby St | 0.51mi | 2/2.5 (-1) | 1,250 (-6%) | 7mo | $291,000 | $233 | 49 |
| 8632 Oak Ave | 0.62mi | 2/2.0 (-1) | 1,440 (+8%) | 2mo | $387,500 | $269 | 48 |
| 7155 Hemlock Ave | 0.72mi | 3/1.0 | 1,155 (-14%) | 0mo | $150,000 | $130 | 44 |
| 820 N Vanderburg St | 0.52mi | 2/2.0 (-1) | 1,440 (+8%) | 19mo | $209,900 | $146 | 38 |
| 8713 Pine Ave | 0.66mi | 2/2.0 (-1) | 1,268 (-5%) | 24mo | $410,000 | $323 | 32 |
Match score weights: distance 35% · size 25% · config 20% · recency 20%. Top-matched comps best support the ARV.
Projected returns pro-forma
-3.0% appreciation · 3.0% rent growth · sell at horizon
- IRR
- -18.2%
- Equity multiple
- 0.36×
- Total profit
- $-42,884
- Equity at exit
- $35,770
- IRR
- -10.5%
- Equity multiple
- 0.36×
- Total profit
- $-42,658
- Equity at exit
- $20,742
Cash invested: $67,172 (down + closing). Projections, not guarantees.
Landlord ↔ Tenant lean methodology
- Overall (STATE)
- 90 Strongly Landlord-Friendly
- State Indiana
- 90 Strongly Landlord-Friendly · R+11
- County
- — inherits STATE
- City
- — inherits STATE
ZIP-level market 46403
- Home prices YoY
- -27.3%
- Active inventory
- 88
- Price-to-rent
- 10.8×
Monthly cashflow live
- Estimated rent
- $1,850 medium interval (Pro) →
- Mortgage (P&I)
- −$1,258
- Tax from tax record
- −$166 /mo · $1,986/yr
- Insurance
- −$100
- HOA
- −$0
- Vacancy / Maint / Mgmt
- −$388
- Net cashflow
- $-62
Break-even live
Sensitivity live
| Price | -10% $74 | -5% $6 | +0% $-62 | +5% $-130 | +10% $-198 |
|---|---|---|---|---|---|
| Rent | -10% $-208 | -5% $-135 | +0% $-62 | +5% $11 | +10% $84 |
| Rate | -1.0pp $59 | -0.5pp $-1 | base $-62 | +0.5pp $-124 | +1.0pp $-188 |
UW: 25.0% down · 7.5% · 30yr · 1.5% tax · 5.0% vac · 8.0% maint · 8.0% mgmt
Financing live
Cash to close
- Down payment
- $59,975
- Closing costs
- $7,197
- Reserves months
- —
- Total cash needed
- —
Loan-product check · same deal, 3 products live
Conventional
25% down · 7.5% · 30yr
- Down + closing
- —
- Monthly P&I
- —
- Monthly cashflow
- —
- DSCR
- —
- Eligible?
- —
Personal DTI + credit; lowest rate.
DSCR
20% down · 8.5% · 30yr
- Down + closing
- —
- Monthly P&I
- —
- Monthly cashflow
- —
- DSCR
- —
- Eligible?
- —
No personal income docs; deal must DSCR.
Hard money
10% down · 12.0% · 12mo
- Down + closing
- —
- Monthly P&I
- —
- Monthly cashflow
- —
- DSCR
- —
- Eligible?
- —
Short-term bridge; refi at stabilization.
Rent comps 2 comps
| Address | Beds | Baths | Sqft | Rent | $/sqft | DOM | Units | Dist |
|---|---|---|---|---|---|---|---|---|
| 1070 N Warren St Gary, IN | 2.0 | 1.0 | 1200 | $1,800 | $1.50 | 0d | 1 | 0.78mi |
| 7009 E 1st Ave Gary, IN | 3.0 | 1.5 | 1680 | $2,575 | $1.53 | 19d | 1 | 0.85mi |
Listing history 16 events
-
2026-06-21days on market $239,900 Active 52 DOM
-
2026-06-18days on market $239,900 Active 49 DOM
-
2026-06-17days on market $239,900 Active 48 DOM
-
2026-06-16days on market $239,900 Active 47 DOM
-
2026-06-15days on market $239,900 Active 46 DOM
-
2026-06-13days on market $239,900 Active 44 DOM
-
2026-06-13days on market $239,900 Active 43 DOM
-
2026-06-09days on market $239,900 Active 40 DOM
-
2026-06-08days on market $239,900 Active 39 DOM
-
2026-06-07days on market $239,900 Active 38 DOM
-
2026-06-04days on market $239,900 Active 35 DOM
-
2026-06-03days on market $239,900 Active 34 DOM
-
2026-06-02days on market $239,900 Active 33 DOM
-
2026-06-01days on market $239,900 Active 32 DOM
-
2026-05-31days on market $239,900 Active 31 DOM
-
2026-04-30$239,900 Active 604-char remark
ⓘ Source: listings_history table (triggers on properties + properties_extension) + one-shot
backfill from property_details.listing_events for pre-trigger history.
Tax reassessment forecast IN · Partial reset (capped growth)
- Current annual tax
- $1,986 · $166/mo
- Projected year-2 tax
- $2,013 · $168/mo
- Expected delta
- +$27/yr (+$2/mo · 1.3%)
ⓘ Screening estimate from a state-policy table — verify with the county assessor before closing.
Climate risk First Street
- Flood 1/10 Low FEMA zone X (unshaded) · 0% chance over 30 yrs
- Wildfire 8/10 Severe
- Heat 3/10 Moderate 7 d/yr ≥101°F today · 15 d/yr by 30 yrs out
- Wind 2/10 Low 100% chance of damaging wind over 30 yrs
- Air quality 4/10 Moderate 5 unhealthy d/yr today · 6 by 30 yrs out
Nearby sold comps map
Loading sold comps map…
Walkable amenities ~0.75 mi
Loading nearby amenities…
Taxation est. · year 1
- Rental income
- $22,199
- − Mortgage interest
- −$13,438
- − Property taxes
- −$1,986
- − Insurance
- −$1,200
- − Repairs & maintenance
- −$1,776
- − Management
- −$1,776
- − Depreciation
- −$6,979
- Taxable loss
- −$4,956
- Est. tax savings @ 24.0%
- +$1,189
- After-tax cash flow
- $444/yr
For passive investors: Depreciation is non-cash, so a rental often shows a tax loss while cash-flowing — sheltering income. Rental losses are passive: they offset passive income freely, and up to $25,000/yr can offset ordinary (W-2) income if you actively participate and your MAGI is under $100k (phasing out to $0 by $150k); unused losses carry forward. On sale, claimed depreciation is recaptured at up to 25%, and gains may owe capital-gains tax (a 1031 exchange can defer both). Figures are a year-1 estimate at your 24.0% rate — not tax advice; consult a CPA.
Schools (NCES district)
- District
- Gary Community School Corporation
- NCES district ID
- 1803870
- Math proficiency
- 3% ▼ -10.00%
- Reading proficiency
- 11% ▼ -6.00%
- Median HH income
- $27,739
- Composite
- 4.98/100
- National rank
- #10039
- State rank
- #299 of 301 in IN
Livability — Gary
- Score
- 73/100
- State rank
- #105
- US rank
- #5592
Category grades
Schools grade is shown separately in the Schools card above.
Census & demographics
- Census place
- Gary, IN
- County
- Lake County · 422,878 people
- City population
- 63,701
- Metro
- Chicago-Naperville-Elgin, IL-IN-WI
- Population (ZIP)
- 10,929
- Household income
- $45,991
- Rent vs Own
- Severe rent burden
- 656.0
Population outlook (Lake County) Hauer SSP2
- Today (2025)
- 484,026 people
- By 2030
- 478,091 · -1.2%
- By 2040
- 462,974 · -4.3%
- By 2050
- 449,894 · -7.1%
- By 2075
- 436,169 · -9.9%
- By 2100
- 426,607 · -11.9%
Race, ethnicity, and origin ACS 2023
- Neighborhood character
- Predominantly Black (71%)
- Race & ethnicity
- Black 71% White 18% Hispanic / Latino 9% Two or more races 4%
- Hispanic origin (detail)
- Mexican 5% Puerto Rican 4%
- Common ancestry
- Romanian 2% Hispanic 1% Iranian 1%
- Foreign-born
- 3% · Canada
- Languages at home
- 96% English-only · Spanish 2%
Political lean MEDSL · Lake
- 2024 margin
- Lean D (+5.6) · D 52.1% · R 46.5% · Other 1.5%
- 2008→2024 swing
- -28.6pp toward R · 2008: 34.3pp · 2024: 5.6pp
- All cycles
- 2024: D+5.6 2020: D+15.1 2016: D+20.6 2012: D+31.0 2008: D+34.3
Not yet ingested
- Civics
- —
Market trends
- HPI YoY
- ▼ -110.41%
- Current HPI
- 294.0935
- Rent YoY
- —
- Metro
- Chicago-Naperville-Elgin, IL-IN-WI
- State GDP YoY
- ▲ 2.90%
- F500 in state
- 18
Industry mix (Fortune 500 HQ in IN)
| Industry | F500 HQs | Revenue |
|---|---|---|
| Industrial Machinery | 2 | $37B |
|
||
| Healthcare | 1 | $177B |
|
||
| Pharmaceuticals | 1 | $45B |
|
||
| Metals / Steel | 1 | $18B |
|
||
| Agriculture | 1 | $17B |
|
||
| Packaging | 1 | $12B |
|
||
Price history
1 event — show timeline
- 2026-04-30 Listed $239,900 NIRA MLS as Distributed by MLS Grid
Property tax history
-3.1%/yrLatest (2024): $1,986 · +6.3% YoY. Source: county tax records.
Cash-flow waterfall
monthlySold comps — $/sqft
last 12 mo · ≤1 miLoading sold comps…