1611 E Villa Rita Dr #113 · Phoenix, AZ
Flood risk 1/10 · Minimal
- FEMA flood zone
- X (shaded)
- Chance of flooding over 30 yrs
- 0.0%
- Est. flood insurance / yr
- $507 – $1,088
Fire risk 4/10 · Minor
- Est. fire insurance / yr
- $610 – $1,132
Heat risk 8/10 · Major
- Hot days now (above 110°F)
- 7 days/yr
- Hot days in 30 yrs
- 17 days/yr
Wind risk 1/10 · Minimal
- Chance of severe wind over 30 yrs
- —
Air-quality risk 3/10 · Minor
- Unhealthy air days now
- 2 days/yr
- Unhealthy air days in 30 yrs
- 3 days/yr
Risk factors via First Street. Map © Google.
Why this score? — see what drove the B- grade
The composite is a weighted blend of 9 inputs, each scored 0–100. Each bar is that input's sub-score; the figure is the points it added to the 100-point composite (weight × sub-score).
- Cash flow +30.0/30.0
- 1% rule +10.0/10.0
- DSCR +10.0/10.0
- ARV discount +6.4/15.0
- Schools +3.8/10.0
- Livability +3.8/5.0
- Condition / age +3.8/5.0
- Rent growth +2.2/5.0
- Appreciation +0.0/10.0
$120,000
🖨 Deal sheet 📄 Offer letter ✓ Due diligence
Listing remarks MLS
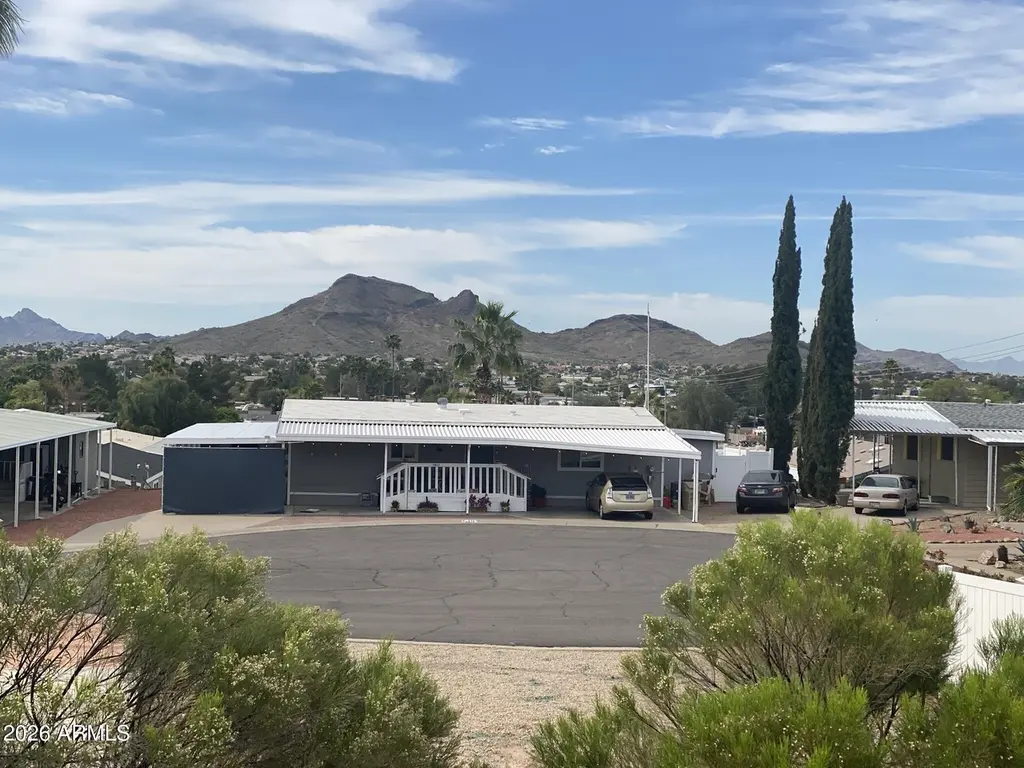
This home is ready for a make over. 2 Bed/1.75 Bath, 1152 approx. sq ft. of home. Front pouch faces south and has a amazing view of the valley below. Present owner has never lived in home. Home is being offered ''AS IS''. 55+ community.
Key facts
- Two resurfaced decks
- Quiet cul-de-sac
- Numerous upgrades
Tags
Property features AI
Finance
- Other: No association fees; No visible truck/trailer/RV/boat allowed (association rule)
- Financial info: Land lease payment $1,177 per month
- HOA & community: Pool in community; Land lease with monthly fee
Exterior
- Parking: 1 open parking space; 6 covered parking spaces; 6 carport spaces
- Utilities: City water; Public sewer; 220V in kitchen
- Home design: Manufactured/Mobile home; Leasehold ownership
- Construction: Wood frame construction
- Exterior features: Painted exterior; Partial fencing; Other fence type; Gravel/stone front yard; Gravel/stone backyard; Other roof
Interior
- Kitchen: 220V outlet in kitchen
- Bedrooms: 2 bedrooms (possible)
- Bathrooms: 2 full bathrooms
- Heating & cooling: Electric heating; Ceiling heating; Ceiling fans; Programmable thermostat; Other cooling
- Interior features: Full bathroom in primary bedroom; Recessed lighting
- Laundry & utility: Indoor laundry
Neighborhood map
What this means for you Summary
Snapshot
- This is a 2-bed/2.0-bath manufactured listed at $120k. Condition is rated good.
Deal economics
- At list price, monthly cash flow is $597 ($7k/yr) — positive.
- The deal already cash-flows at list — no discount required.
- Meets the 1% rule at list price ($2k rent vs $120k).
- Recommended offer: $116k (3.0% below list) — sets the bar for market timing.
- Cap rate 12.3% vs local median 3.3% in Phoenix — top-decile yield for the area; either an underpriced asset or a hidden risk that comps aren't pricing in. Stress-test before assuming the spread holds.
Location & tenants
- Location reads 75/100 on livability (#16 in AZ, #3,924 nationally) — a middle-class / working-renter tenant base. Strengths: amenities A+, commute A+, housing A+; Watch: health & safety C-, crime F.
- Paradise Valley Unified District (4241) (urban): math 39% / reading 46% proficiency, ranked #56 of 249 in AZ (top 22%) — families likely to look elsewhere, expect single-tenant / working-renter base with shorter leases.
- Zoned schools: Echo Mountain Primary School (math 22% / reading 22%, grade F, #687 of 1,109 statewide, top 65%, 530 students, 74% FRL); Greenway Middle School (math 6% / reading 18%, grade F, #178 of 218 statewide, top 82%, 419 students, 74% FRL); North Canyon High School (math 13% / reading 23%, grade F, #242 of 381 statewide, top 64%, 1,842 students, 55% FRL) — zoned schools average 67% FRL vs 29% district-wide (38 pts higher); higher-poverty schools than district average — tighter screening recommended.
- Zoned-school proficiency averages 17% at this address vs 42% district-wide (-25 pts) — the specific schools serving this property underperform the Paradise Valley Unified District (4241) average; the district grade overstates school quality for this exact location.
- Market conditions: Rents soft (-1.2%/yr); 282 active listings in the ZIP; 40 comparable units currently listed for rent nearby; rentals leasing fast (median 8d on market — plan ~1-2 weeks tenant-placement turnaround); 36,011 units permitted in Maricopa County in 2024 (12,801 in 5+ unit buildings).
Forward outlook
- Local home prices are declining (-3.0%/yr); year-one equity from $830 of loan paydown is wiped out by about $4k of value loss. Plan a longer hold.
- Maricopa County population projected at +38% by 2050 — long-run rental-demand tailwind backs the buy-and-hold thesis.
- At projected returns (-3.0% appreciation + 0.0% rent growth), your $34k cash investment doubles in ~8 years — after that, you're playing with house money.
Negotiation context
- It's been on market 55 days — a 3% lower offer ($116k) is reasonable based on typical stale-listing flexibility.
- 4 sale attempts since 5y ago with the ask held roughly flat each time — persistent listings suggest the price (not the market) is what's stuck; bring a comps-based counter.
- Current owner paid $55k; list at $120k implies a 118% gain — meaningful room to come down on a strong offer.
Risks & watch-outs
- Climate carrying-cost: extreme-heat days projected 7→17/yr by 2055 (HVAC capex compounding) — expect insurance premiums to compound above CPI over the hold.
Questions for the listing agent
- It's been on market 55 days. Have you received any prior offers? Is the seller open to a 3% concession, seller financing, or rate buy-down credit?
- Is there a deadline driving the sale (1031 exchange, divorce, estate, relocation)? That informs how much negotiation room exists.
- Crime grade is F in this area — have there been break-ins, vandalism, or insurance claims at this property in the last 3 years? What carrier currently insures it and at what premium?
- What's the average days-on-market for RENTAL listings here right now (not sales)? A rising rental-DOM trend means longer vacancies and softer asking-rent achievability than the comps imply.
- What's the recent tenant-quality profile in this submarket — average credit score on applications, eviction rate, late-payment / NSF rate, and stable-employment percentage? A property-management company in the area should have these aggregated.
- How much new for-sale + rental construction is in the pipeline within 1–3 miles? Heavy new supply typically softens prices + rents 12–24 months out; constrained supply supports both.
Investment metrics
- 1% rule
- 1.50% ✓
- Cap rate
- 12.27%
- Cash-on-cash
- 21.33%
- DSCR
- 1.95
- GRM
- 5.5
CMA / ARV
- ARV (median comp)
- $117,207
- List price
- $120,000
- Delta
- 2.38%
- Verdict
- FAIR
- Comps
- 20 within 1.0 mi
Show comp detail 12 sales within ~0.75 mi
| Address | Dist | Beds/Ba | Sqft | Sold | Price | $/sf | Match |
|---|---|---|---|---|---|---|---|
| 1701 E Villa Rita Dr | 0.07mi | 2/2.0 | 1,056 (-8%) | 15mo | $132,000 | $125 | 71 |
| 18018 N 17th Way | 0.14mi | 3/2.0 (+1) | 1,300 (+13%) | 6mo | $114,000 | $88 | 62 |
| 17827 N 19th St | 0.36mi | 3/2.0 (+1) | 1,096 (-5%) | 12mo | $130,000 | $119 | 60 |
| 1802 E Campo Bello Dr #29 | 0.43mi | 3/2.0 (+1) | 1,232 (+7%) | 4mo | $80,000 | $65 | 60 |
| 2034 E Charleston Ave | 0.55mi | 3/2.0 (+1) | 1,156 (+0%) | 13mo | $276,000 | $239 | 58 |
| 17411 N 15th Pl | 0.45mi | 3/2.0 (+1) | 1,249 (+8%) | 3mo | $174,000 | $139 | 58 |
| 1955 E Grovers Ave #9 | 0.47mi | 2/2.0 | 1,248 (+8%) | 14mo | $79,000 | $63 | 52 |
| 1304 E Bell Rd #55 | 0.62mi | 3/2.0 (+1) | 1,120 (-3%) | 15mo | $90,000 | $80 | 49 |
| 1939 E Libby St | 0.42mi | 2/2.0 | 980 (-15%) | 13mo | $175,000 | $179 | 45 |
| 2131 E Union Hills Dr Unit M5 | 0.71mi | 3/2.0 (+1) | 1,200 (+4%) | 12mo | $72,000 | $60 | 45 |
| 18240 N 21st Dr #86 | 0.54mi | 2/2.0 | 1,024 (-11%) | 14mo | $75,000 | $73 | 44 |
| 2140 E Michigan Ave #35 | 0.66mi | 3/2.0 (+1) | 990 (-14%) | 1mo | $98,000 | $99 | 40 |
Match score weights: distance 35% · size 25% · config 20% · recency 20%. Top-matched comps best support the ARV.
Projected returns pro-forma
-3.0% appreciation · 0.0% rent growth · sell at horizon
- IRR
- 10.4%
- Equity multiple
- 1.40×
- Total profit
- $13,331
- Equity at exit
- $17,892
- IRR
- 16.9%
- Equity multiple
- 2.20×
- Total profit
- $40,252
- Equity at exit
- $10,375
Cash invested: $33,600 (down + closing). Projections, not guarantees.
Landlord ↔ Tenant lean methodology
- Overall (STATE)
- 87 Strongly Landlord-Friendly
- State Arizona
- 87 Strongly Landlord-Friendly · R+3
- County
- — inherits STATE
- City
- — inherits STATE
ZIP-level market 85022
- Rents YoY
- -1.2%
- Active inventory
- 282
- Price-to-rent
- 5.5×
Monthly cashflow live
- Estimated rent
- $1,806 high interval (Pro) →
- Mortgage (P&I)
- −$629
- Tax est. 1.5%
- −$150 /mo · $1,800/yr
- Insurance
- −$50
- HOA
- −$0
- Vacancy / Maint / Mgmt
- −$379
- Net cashflow
- $597
Break-even live
UW: 25.0% down · 7.5% · 30yr · 1.5% tax · 5.0% vac · 8.0% maint · 8.0% mgmt
Financing live
Cash to close
- Down payment
- $30,000
- Closing costs
- $3,600
- Reserves months
- —
- Total cash needed
- —
Loan-product check · same deal, 3 products live
Conventional
25% down · 7.5% · 30yr
- Down + closing
- —
- Monthly P&I
- —
- Monthly cashflow
- —
- DSCR
- —
- Eligible?
- —
Personal DTI + credit; lowest rate.
DSCR
20% down · 8.5% · 30yr
- Down + closing
- —
- Monthly P&I
- —
- Monthly cashflow
- —
- DSCR
- —
- Eligible?
- —
No personal income docs; deal must DSCR.
Hard money
10% down · 12.0% · 12mo
- Down + closing
- —
- Monthly P&I
- —
- Monthly cashflow
- —
- DSCR
- —
- Eligible?
- —
Short-term bridge; refi at stabilization.
Rent comps 40 comps
| Address | Beds | Baths | Sqft | Rent | $/sqft | DOM | Units | Dist |
|---|---|---|---|---|---|---|---|---|
| 1702 E Michelle Dr Phoenix, AZ | 2.0 | 2.0 | 1300 | $2,200 | $1.69 | 5d | 1 | 0.06mi |
| 1717 E Union Hills Dr #1052 Phoenix, AZ | 2.0 | 2.0 | 1160 | $4,000 | $3.45 | 43d | 1 | 0.25mi |
| 1717 E Union Hills Dr Phoenix, AZ | 2.0–3.0 | 2.0 | 1169 | $1,675 | $1.43 | 3d | 3 | 0.31mi |
| 1717 E Union Hills Dr Phoenix, AZ | 2.0–3.0 | 2.0 | 1245 | $1,775 | $1.43 | 22d | 4 | 0.31mi |
| 17606 N 17th Pl Phoenix, AZ | 2.0–3.0 | 2.0–2.5 | 1463 | $1,999 | $1.37 | 2d | 3 | 0.38mi |
| 17606 N 17th Pl Phoenix, AZ | 2.0–3.0 | 2.5 | 1472 | $1,999 | $1.36 | 12d | 3 | 0.38mi |
| 18633 N 15th St Phoenix, AZ | 3.0 | 2.0 | 1240 | $2,249 | $1.81 | 7d | 1 | 0.40mi |
| 1814 E Bell Rd Phoenix, AZ | 1.0–2.0 | 1.0–2.0 | 1003 | $1,637 | $1.63 | 1d | 12 | 0.53mi |
| 1506 E Wescott Dr Phoenix, AZ | 3.0 | 2.0 | 1136 | $2,045 | $1.80 | 5d | 1 | 0.55mi |
| 1136 E Villa Rita Dr Phoenix, AZ | 2.0 | 2.0 | 1141 | $1,950 | $1.71 | 24d | 1 | 0.59mi |
| 1126 E Charleston Ave Phoenix, AZ | 3.0 | 2.0 | 1214 | $2,450 | $2.02 | 3d | 1 | 0.59mi |
| 1450 E Bell Rd Phoenix, AZ | 1.0–3.0 | 1.0–2.0 | 957 | $1,555 | $1.62 | 2d | 93 | 0.60mi |
| 1510 E Taro Ln Phoenix, AZ | 3.0 | 2.0 | 1136 | $2,149 | $1.89 | 24d | 1 | 0.61mi |
| 2067 E Charleston Ave Phoenix, AZ | 2.0 | 2.0 | 840 | $1,395 | $1.66 | 24d | 1 | 0.61mi |
| 2077 E Charleston Ave Phoenix, AZ | 2.0 | 1.0 | 720 | $1,295 | $1.80 | 24d | 1 | 0.64mi |
| 1130 E Grovers Ave Phoenix, AZ | 2.0 | 2.0 | 934 | $1,336 | $1.43 | 2d | 12 | 0.64mi |
| 1420 E Topeka Dr Phoenix, AZ | 3.0 | 2.5 | 1464 | $2,215 | $1.51 | 7d | 1 | 0.64mi |
| 1032 E Villa Maria Dr Phoenix, AZ | 2.0 | 2.0 | 1097 | $1,850 | $1.69 | 7d | 1 | 0.68mi |
| 1032 E Villa Maria Dr Phoenix, AZ | 2.0 | 2.0 | 1097 | $1,850 | $1.69 | 20d | 1 | 0.68mi |
| 1750 E Bell Rd Phoenix, AZ | 1.0–2.0 | 1.0 | 700 | $1,349 | $1.93 | 24d | 1 | 0.68mi |
| 1702 E Bell Rd #180 Phoenix, AZ | 3.0 | 2.5 | 1358 | $2,000 | $1.47 | 24d | 1 | 0.70mi |
| 2221 E Union Hills Dr #158 Phoenix, AZ | 3.0 | 2.0 | 1332 | $2,100 | $1.58 | 18d | 1 | 0.73mi |
| 17617 N 9th St Phoenix, AZ | 1.0–3.0 | 1.0–2.0 | 956 | $1,513 | $1.58 | 2d | 35 | 0.76mi |
| 1920 E Bell Rd Phoenix, AZ | 2.0–3.0 | 2.0–2.5 | 1391 | $1,795 | $1.29 | 2d | 3 | 0.78mi |
| 1920 E Bell Rd Phoenix, AZ | 2.0–3.0 | 2.0–2.5 | 1391 | $1,800 | $1.29 | 7d | 4 | 0.78mi |
| 1920 E Bell Rd Phoenix, AZ | 2.0–3.0 | 2.0–2.5 | 1391 | $1,695 | $1.22 | 14d | 5 | 0.78mi |
| 18437 N 8th Pl Phoenix, AZ | 3.0 | 2.0 | 1355 | $1,980 | $1.46 | 5d | 1 | 0.87mi |
| 18416 N Cave Creek Rd Unit 6 Phoenix, AZ | 1.0 | 1.0 | 748 | $1,250 | $1.67 | 7d | 1 | 0.87mi |
| 1100 E Bell Rd Phoenix, AZ | 1.0–3.0 | 1.0–2.0 | 987 | $1,822 | $1.85 | 1d | 26 | 0.87mi |
| 18202 N Cave Creek Rd Phoenix, AZ | 1.0–3.0 | 1.0–2.0 | 722 | $1,148 | $1.59 | 4d | 7 | 0.89mi |
| 815 E Grovers Ave Phoenix, AZ | 1.0–2.0 | 1.0–2.5 | 1469 | $2,800 | $1.91 | 5d | 2 | 0.89mi |
| 17602 N Cave Creek Rd Phoenix, AZ | 2.0 | 1.0–2.0 | 650 | $1,625 | $2.50 | 2d | 13 | 0.90mi |
| 17017 N 12th St Phoenix, AZ | 1.0–2.0 | 1.0 | 910 | $2,500 | $2.75 | 24d | 2 | 0.90mi |
| 2150 E Bell Rd #1102 Phoenix, AZ | 3.0 | 2.5 | 1462 | $1,945 | $1.33 | 15d | 1 | 0.91mi |
| 18416 N Cave Creek Rd Phoenix, AZ | 2.0 | 1.0–2.0 | 786 | $3,000 | $3.81 | 4d | 9 | 0.91mi |
| 16825 N 14th St Phoenix, AZ | 2.0–4.0 | 2.5–3.0 | 1465 | $1,675 | $1.14 | 24d | 2 | 0.92mi |
| 16825 N 14th St Phoenix, AZ | 2.0–4.0 | 2.5–3.0 | 1465 | $1,675 | $1.14 | 3d | 2 | 0.92mi |
| 16875 N 12th St Unit 17 Phoenix, AZ | 3.0 | 2.5 | 1323 | $2,200 | $1.66 | 24d | 1 | 0.93mi |
| 18660 N Cave Creek Rd Phoenix, AZ | 1.0–3.0 | 1.0–2.0 | 961 | $1,622 | $1.69 | 2d | 11 | 0.95mi |
| 17150 N 23rd St #135 Phoenix, AZ | 2.0 | 2.5 | 1186 | $1,900 | $1.60 | 14d | 1 | 0.96mi |
Listing history 29 events
-
2026-06-18days on market $120,000 Active 55 DOM
-
2026-06-17days on market $120,000 Active 54 DOM
-
2026-06-16days on market $120,000 Active 53 DOM
-
2026-06-15days on market $120,000 Active 52 DOM
-
2026-06-13days on market $120,000 Active 50 DOM
-
2026-06-13days on market $120,000 Active 49 DOM
-
2026-06-09days on market $120,000 Active 46 DOM
-
2026-06-08days on market $120,000 Active 45 DOM
-
2026-06-07days on market $120,000 Active 44 DOM
-
2026-06-04days on market $120,000 Active 41 DOM
-
2026-06-03days on market $120,000 Active 40 DOM
-
2026-06-02days on market $120,000 Active 39 DOM
-
2026-06-01days on market $120,000 Active 38 DOM
-
2026-05-31days on market $120,000 Active 37 DOM
-
2026-04-24$120,000 Active 810-char remark
-
2026-01-26historical
-
2025-12-29price $114,900
-
2025-12-08price $124,900
-
2025-11-05price $134,900
-
2025-07-30price $144,900
-
2025-04-08price $149,900
-
2025-03-22status Active
-
2025-03-18historical Under Contract Accepting Backups
-
2025-02-12price $155,000
-
2025-01-16price $165,000
-
2024-12-03$167,500 Active
-
2021-06-17soldstatus $55,000 Closed
Show marketing remark (239 chars)
This home is ready for a make over. 2 Bed/1.75 Bath, 1152 approx. sq ft. of home. Front pouch faces south and has a amazing view of the valley below. Present owner has never lived in home. Home is being offered ''AS IS''. 55+ community.
-
2021-06-04historical Under Contract Accepting Backups
Show marketing remark (239 chars)
This home is ready for a make over. 2 Bed/1.75 Bath, 1152 approx. sq ft. of home. Front pouch faces south and has a amazing view of the valley below. Present owner has never lived in home. Home is being offered ''AS IS''. 55+ community.
-
2021-05-22$65,500 Active
Show marketing remark (239 chars)
This home is ready for a make over. 2 Bed/1.75 Bath, 1152 approx. sq ft. of home. Front pouch faces south and has a amazing view of the valley below. Present owner has never lived in home. Home is being offered ''AS IS''. 55+ community.
ⓘ Source: listings_history table (triggers on properties + properties_extension) + one-shot
backfill from property_details.listing_events for pre-trigger history.
Climate risk First Street
- Flood 1/10 Low FEMA zone X (shaded) · 0% chance over 30 yrs
- Wildfire 4/10 Moderate
- Heat 8/10 Severe 7 d/yr ≥110°F today · 17 d/yr by 30 yrs out
- Wind 1/10 Low
- Air quality 3/10 Moderate 2 unhealthy d/yr today · 3 by 30 yrs out
Nearby sold comps map
Loading sold comps map…
Walkable amenities ~0.75 mi
Loading nearby amenities…
Taxation est. · year 1
- Rental income
- $21,669
- − Mortgage interest
- −$6,722
- − Property taxes
- −$1,800
- − Insurance
- −$600
- − Repairs & maintenance
- −$1,734
- − Management
- −$1,734
- − Depreciation
- −$3,491
- Taxable income
- $5,590
- Est. tax owed @ 24.0%
- −$1,342
- After-tax cash flow
- $5,826/yr
For passive investors: Depreciation is non-cash, so a rental often shows a tax loss while cash-flowing — sheltering income. Rental losses are passive: they offset passive income freely, and up to $25,000/yr can offset ordinary (W-2) income if you actively participate and your MAGI is under $100k (phasing out to $0 by $150k); unused losses carry forward. On sale, claimed depreciation is recaptured at up to 25%, and gains may owe capital-gains tax (a 1031 exchange can defer both). Figures are a year-1 estimate at your 24.0% rate — not tax advice; consult a CPA.
Condition & rehab AI · 12 photos
This beautifully updated 2-bedroom, 2-bath manufactured home is in good condition with numerous upgrades, including a modern color palette, updated cabinetry, and spacious walk-in showers. The home is move-in ready with minor maintenance items to address, such as painting the exterior and cleaning gutters.
Value-add opportunities
- Both Paint exterior — Enhances curb appeal and value.
- Both Clean gutters — Improves drainage and property value.
- Both Replace carpet — Fresh carpet can improve both resale and rental value.
- Both Update lighting fixtures — Modern lighting can enhance the home's appeal and value.
- Both Install smart home devices — Smart home devices can increase both resale and rental value by making the home more energy-efficient and convenient for potential buyers/tenants.
Renovation cost estimate screening
Value-add ROI direction
- Both Paint exterior — Enhances curb appeal and value. ↑
- Both Clean gutters — Improves drainage and property value. ↑
- Both Replace carpet — Fresh carpet can improve both resale and rental value. ↑
- Both Update lighting fixtures — Modern lighting can enhance the home's appeal and value. ↑
- Both Install smart home devices — Smart home devices can increase both resale and rental value by making the home more energy-efficient and convenient for potential buyers/tenants. ↑
ⓘ Cost ranges are severity-bucket heuristics (US national rule-of-thumb). Get contractor quotes + a written scope before underwriting a rehab budget.
Schools (NCES district)
- District
- Paradise Valley Unified District (4241)
- NCES district ID
- 0405930
- Math proficiency
- 39% ▼ -11.00%
- Reading proficiency
- 46% ▼ -7.00%
- Median HH income
- $64,106
- Composite
- 37.89/100
- National rank
- #4316
- State rank
- #56 of 249 in AZ
Livability — Phoenix
- Score
- 75/100
- State rank
- #16
- US rank
- #3924
Category grades
Schools grade is shown separately in the Schools card above.
Census & demographics
- Census place
- Phoenix, AZ
- County
- Maricopa County · 4,537,380 people
- City population
- 1,500,198
- Metro
- Phoenix-Mesa-Chandler, AZ
- Population (ZIP)
- 53,811
- Household income
- $69,927
- Rent vs Own
- Severe rent burden
- 2976.0
Population outlook (Maricopa County) Hauer SSP2
- Today (2025)
- 4,979,203 people
- By 2030
- 5,378,229 · +8.0%
- By 2040
- 6,156,598 · +23.6%
- By 2050
- 6,872,376 · +38.0%
- By 2075
- 8,401,270 · +68.7%
- By 2100
- 9,247,439 · +85.7%
Race, ethnicity, and origin ACS 2023
- Neighborhood character
- Diverse neighborhood (Simpson 0.59)
- Race & ethnicity
- White 59% Hispanic / Latino 22% Two or more races 11% Black 10% Asian 3% Native American 3%
- Hispanic origin (detail)
- Mexican 18%
- Common ancestry
- Romanian 3% Lithuanian 2% Italian 1%
- Foreign-born
- 14% · Canada, China, Vietnam
- Languages at home
- 79% English-only · Spanish 13% Other Indo-European 2% Russian/Polish/Slavic 1%
Political lean MEDSL · Maricopa
- 2024 margin
- Toss-up / Even · D 47.7% · R 51.2% · Other 1.1%
- 2008→2024 swing
- +7.1pp toward D · 2008: -10.6pp · 2024: -3.5pp
- All cycles
- 2024: R+3.5 2020: D+2.2 2016: R+3.5 2012: R+12.0 2008: R+10.6
Not yet ingested
- Civics
- —
Market trends
- HPI YoY
- ▼ -329.75%
- Current HPI
- 313.5085
- Rent YoY
- ▼ -1.21%
- Metro
- Phoenix-Mesa-Chandler, AZ
- State GDP YoY
- ▲ 4.54%
- F500 in state
- 20
Industry mix (Fortune 500 HQ in AZ)
| Industry | F500 HQs | Revenue |
|---|---|---|
| Technology | 2 | $13B |
|
||
| Mining / Metals | 1 | $23B |
|
||
| Environmental Services | 1 | $16B |
|
||
| Metals / Steel | 1 | $14B |
|
||
| Technology Distribution | 1 | $9B |
|
||
| Homebuilding | 1 | $8B |
|
||
Price history
+83.2% since first listed15 events — show timeline
- 2026-04-24 Listed $120,000 ARMLS
- 2026-01-26 Listing Removed — ARMLS
- 2025-12-29 Price Changed $114,900 ARMLS
- 2025-12-08 Price Changed $124,900 ARMLS
- 2025-11-05 Price Changed $134,900 ARMLS
- 2025-07-30 Price Changed $144,900 ARMLS
- 2025-04-08 Price Changed $149,900 ARMLS
- 2025-03-22 Relisted — ARMLS
- 2025-03-18 Contingent — ARMLS
- 2025-02-12 Price Changed $155,000 ARMLS
- 2025-01-16 Price Changed $165,000 ARMLS
- 2024-12-03 Listed $167,500 ARMLS
- 2021-06-17 Sold (MLS) $55,000 ARMLS
- 2021-06-04 Contingent — ARMLS
- 2021-05-22 Listed $65,500 ARMLS
Cash-flow waterfall
monthlySold comps — $/sqft
last 12 mo · ≤1 miLoading sold comps…