5719 W Stockholm Ln · Citrus Springs, FL
Flood risk 1/10 · Minimal
- FEMA flood zone
- X (unshaded)
- Chance of flooding over 30 yrs
- 0.0%
- Est. flood insurance / yr
- $507 – $1,088
Fire risk 4/10 · Minor
- Est. fire insurance / yr
- $947 – $1,759
Heat risk 9/10 · Severe
- Hot days now (above 108°F)
- 6 days/yr
- Hot days in 30 yrs
- 19 days/yr
Wind risk 9/10 · Severe
- Chance of severe wind over 30 yrs
- 99.0%
Air-quality risk 2/10 · Minimal
- Unhealthy air days now
- 0 days/yr
- Unhealthy air days in 30 yrs
- 1 days/yr
Risk factors via First Street. Map © Google.
Why this score? — see what drove the C+ grade
The composite is a weighted blend of 9 inputs, each scored 0–100. Each bar is that input's sub-score; the figure is the points it added to the 100-point composite (weight × sub-score).
- Cash flow +20.2/30.0
- ARV discount +14.8/15.0
- DSCR +6.4/10.0
- 1% rule +5.1/10.0
- Schools +4.1/10.0
- Livability +3.4/5.0
- Rent growth +2.5/5.0
- Condition / age +2.5/5.0
- Appreciation +1.8/10.0
$199,000
🖨 Deal sheet 📄 Offer letter ✓ Due diligence
Listing remarks MLS
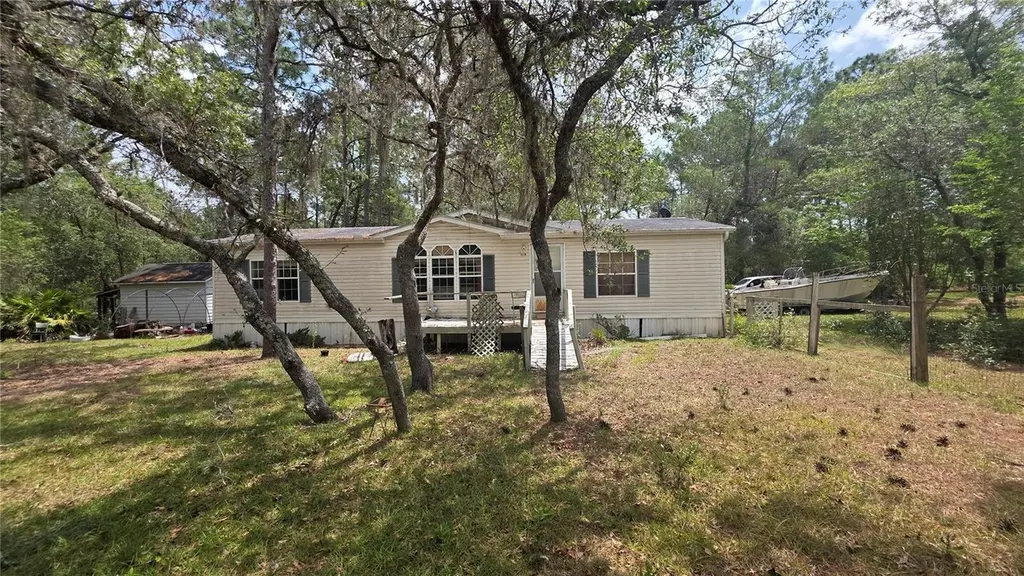
Great 2.5 acre lot with the pave road access, in the Mini Farms. Nicely Treed
Key facts
- 2.65 acre lot
- Built 2004
- Listed 50 days
Property features AI
Finance
- Other: No CDD; Unfurnished; No lease restrictions
Exterior
- Utilities: Public water; Public utilities; Sewer: Other
- Home design: Residential manufactured double wide; Single-story; Faces west; Entry level: One
- Construction: Vinyl siding; Shingle roof; Crawlspace foundation; Built on a 2.65-acre lot
- Exterior features: Other exterior features; Asphalt road access
Interior
- Kitchen: Appliances: Other
- Bedrooms: 3 bedrooms
- Flooring: Carpet; Tile
- Bathrooms: 2 full bathrooms
- Heating & cooling: Central heating; Central air conditioning
- Interior features: Open floorplan
- Laundry & utility: Laundry features: Other
Neighborhood map
What this means for you Summary
Snapshot
- This is a 3-bed/2.0-bath manufactured listed at $199k.
Deal economics
- At list price, monthly cash flow is $251 ($3k/yr) — positive.
- The deal already cash-flows at list — no discount required.
- Meets the 1% rule at list price ($2k rent vs $199k).
- Recommended offer: $193k (3.0% below list) — sets the bar for market timing.
- Cap rate 7.8% vs local median 5.1% in Citrus Springs — top-decile yield for the area; either an underpriced asset or a hidden risk that comps aren't pricing in. Stress-test before assuming the spread holds.
Location & tenants
- Location reads 68/100 on livability (#521 in FL) — a middle-class / working-renter tenant base. Strengths: cost of living A+, housing A+; Watch: schools C-, health & safety C-, employment D+.
- Citrus (rural): math 49% / reading 50% proficiency, ranked #44 of 73 in FL (top 60%) — families likely to look elsewhere, expect single-tenant / working-renter base with shorter leases.
- Market conditions: 642 active listings in the ZIP; 2,443 units permitted in Citrus County in 2024 (0 in 5+ unit buildings).
Forward outlook
- Local home prices are declining (-3.0%/yr); year-one equity from $1k of loan paydown is wiped out by about $6k of value loss. Plan a longer hold.
- Citrus County population projected to shrink 10% by 2050 — rents likely to lag national; underwrite the cash flow, not the appreciation.
Negotiation context
- It's been on market 50 days — a 3% lower offer ($193k) is reasonable based on typical stale-listing flexibility.
- 2 sale attempts since 23y ago; this cycle's ask has dropped $41k (17%) from the opening price — seller is motivated, your offer sets the floor, not the list.
- Current owner paid $13k; list at $199k implies a 1431% gain — meaningful room to come down on a strong offer.
Risks & watch-outs
- Climate carrying-cost: severe wind risk, 99% chance of damaging wind over 30y; extreme-heat days projected 6→19/yr by 2055 (HVAC capex compounding) — expect insurance premiums to compound above CPI over the hold.
Questions for the listing agent
- It's been on market 50 days. Have you received any prior offers? Is the seller open to a 3% concession, seller financing, or rate buy-down credit?
- Is there a deadline driving the sale (1031 exchange, divorce, estate, relocation)? That informs how much negotiation room exists.
- What's the average days-on-market for RENTAL listings here right now (not sales)? A rising rental-DOM trend means longer vacancies and softer asking-rent achievability than the comps imply.
- What's the recent tenant-quality profile in this submarket — average credit score on applications, eviction rate, late-payment / NSF rate, and stable-employment percentage? A property-management company in the area should have these aggregated.
- How much new for-sale + rental construction is in the pipeline within 1–3 miles? Heavy new supply typically softens prices + rents 12–24 months out; constrained supply supports both.
Investment metrics
- 1% rule
- 1.01% ✓
- Cap rate
- 7.81%
- Cash-on-cash
- 5.41%
- DSCR
- 1.24
- GRM
- 8.3
CMA / ARV
- ARV (on-the-fly)
- $237,276
- Comps found
- 9
Show comp detail 9 sales within ~0.75 mi
| Address | Dist | Beds/Ba | Sqft | Sold | Price | $/sf | Match |
|---|---|---|---|---|---|---|---|
| 5728 W Dunklin St #21 | 0.28mi | 3/2.0 | 1,404 (0%) | 7mo | $295,000 | $210 | 81 |
| 5728 W Dunklin St | 0.27mi | 3/2.0 | 1,404 (0%) | 7mo | $295,000 | $210 | 81 |
| 8159 N Dacca Ter | 0.55mi | 3/2.0 | 1,475 (+5%) | 8mo | $245,900 | $167 | 59 |
| 8733 N Windbreak Ter | 0.49mi | 3/2.0 | 1,475 (+5%) | 16mo | $249,999 | $169 | 56 |
| 5285 W Joliet Ln | 0.60mi | 3/2.0 | 1,475 (+5%) | 13mo | $254,999 | $173 | 53 |
| 5284 W Opaline St | 0.62mi | 3/2.0 | 1,475 (+5%) | 12mo | $254,999 | $173 | 52 |
| 5221 W Joliet Ln | 0.64mi | 3/2.0 | 1,475 (+5%) | 12mo | $249,999 | $169 | 52 |
| 5228 W Opaline Ln | 0.67mi | 3/2.0 | 1,475 (+5%) | 12mo | $250,000 | $169 | 50 |
| 8531 N Calcutta Ave | 0.72mi | 3/2.0 | 1,475 (+5%) | 20mo | $249,999 | $169 | 41 |
Match score weights: distance 35% · size 25% · config 20% · recency 20%. Top-matched comps best support the ARV.
Projected returns pro-forma
-3.0% appreciation · 3.0% rent growth · sell at horizon
- IRR
- -7.9%
- Equity multiple
- 0.71×
- Total profit
- $-16,244
- Equity at exit
- $29,672
- IRR
- 1.6%
- Equity multiple
- 1.12×
- Total profit
- $6,476
- Equity at exit
- $17,206
Cash invested: $55,720 (down + closing). Projections, not guarantees.
Landlord ↔ Tenant lean methodology
- Overall (STATE)
- 87 Strongly Landlord-Friendly
- State Florida
- 87 Strongly Landlord-Friendly · R+3
- County
- — inherits STATE
- City
- — inherits STATE
ZIP-level market 34433
- Home prices YoY
- -1.8%
- Active inventory
- 642
- Price-to-rent
- 8.3×
Monthly cashflow live
- Estimated rent
- $2,007 medium interval (Pro) →
- Mortgage (P&I)
- −$1,044
- Tax from tax record
- −$208 /mo · $2,498/yr
- Insurance
- −$83
- HOA
- −$0
- Vacancy / Maint / Mgmt
- −$422
- Net cashflow
- $251
Break-even live
UW: 25.0% down · 7.5% · 30yr · 1.5% tax · 5.0% vac · 8.0% maint · 8.0% mgmt
Financing live
Cash to close
- Down payment
- $49,750
- Closing costs
- $5,970
- Reserves months
- —
- Total cash needed
- —
Loan-product check · same deal, 3 products live
Conventional
25% down · 7.5% · 30yr
- Down + closing
- —
- Monthly P&I
- —
- Monthly cashflow
- —
- DSCR
- —
- Eligible?
- —
Personal DTI + credit; lowest rate.
DSCR
20% down · 8.5% · 30yr
- Down + closing
- —
- Monthly P&I
- —
- Monthly cashflow
- —
- DSCR
- —
- Eligible?
- —
No personal income docs; deal must DSCR.
Hard money
10% down · 12.0% · 12mo
- Down + closing
- —
- Monthly P&I
- —
- Monthly cashflow
- —
- DSCR
- —
- Eligible?
- —
Short-term bridge; refi at stabilization.
Listing history 20 events
-
2026-06-19days on market $199,000 Active 50 DOM
-
2026-06-18days on market $199,000 Active 49 DOM
-
2026-06-17days on market $199,000 Active 48 DOM
-
2026-06-16days on market $199,000 Active 47 DOM
-
2026-06-15days on market $199,000 Active 46 DOM
-
2026-06-14days on market $199,000 Active 44 DOM
-
2026-06-13pricedays on market $199,000 Active 43 DOM
-
2026-06-09days on market $209,000 Active 40 DOM
-
2026-06-08days on market $209,000 Active 39 DOM
-
2026-06-07days on market $209,000 Active 38 DOM
-
2026-06-03pricedays on market $209,000 Active 34 DOM
-
2026-06-02days on market $219,000 Active 33 DOM
-
2026-06-01days on market $219,000 Active 32 DOM
-
2026-05-31days on market $219,000 Active 31 DOM
-
2026-05-30days on market $219,000 Active 30 DOM
-
2026-05-21price $229,000
-
2026-05-20price $239,000
-
2026-04-30$240,000 Active
-
2003-12-22soldstatus $13,000 77-char remark
Show marketing remark (77 chars)
Great 2.5 acre lot with the pave road access, in the Mini Farms. Nicely Treed
-
2003-06-27$13,000 77-char remark
Show marketing remark (77 chars)
Great 2.5 acre lot with the pave road access, in the Mini Farms. Nicely Treed
ⓘ Source: listings_history table (triggers on properties + properties_extension) + one-shot
backfill from property_details.listing_events for pre-trigger history.
Tax reassessment forecast FL · Resets to sale price
- Current annual tax
- $2,498 · $208/mo
- Projected year-2 tax
- $2,498 · $208/mo
- Expected delta
- $0/yr ($0/mo · 0.0%)
ⓘ Screening estimate from a state-policy table — verify with the county assessor before closing.
Climate risk First Street
- Flood 1/10 Low FEMA zone X (unshaded) · 0% chance over 30 yrs
- Wildfire 4/10 Moderate
- Heat 9/10 Extreme 6 d/yr ≥108°F today · 19 d/yr by 30 yrs out
- Wind 9/10 Extreme 99% chance of damaging wind over 30 yrs
- Air quality 2/10 Low 0 unhealthy d/yr today · 1 by 30 yrs out
Nearby sold comps map
Loading sold comps map…
Walkable amenities ~0.75 mi
Loading nearby amenities…
Taxation est. · year 1
- Rental income
- $24,089
- − Mortgage interest
- −$11,147
- − Property taxes
- −$2,498
- − Insurance
- −$995
- − Repairs & maintenance
- −$1,927
- − Management
- −$1,927
- − Depreciation
- −$5,789
- Taxable loss
- −$195
- Est. tax savings @ 24.0%
- +$47
- After-tax cash flow
- $3,061/yr
For passive investors: Depreciation is non-cash, so a rental often shows a tax loss while cash-flowing — sheltering income. Rental losses are passive: they offset passive income freely, and up to $25,000/yr can offset ordinary (W-2) income if you actively participate and your MAGI is under $100k (phasing out to $0 by $150k); unused losses carry forward. On sale, claimed depreciation is recaptured at up to 25%, and gains may owe capital-gains tax (a 1031 exchange can defer both). Figures are a year-1 estimate at your 24.0% rate — not tax advice; consult a CPA.
Schools (NCES district)
- District
- Citrus
- NCES district ID
- 1200270
- Math proficiency
- 49% ▼ -10.00%
- Reading proficiency
- 50% ▼ -6.00%
- Median HH income
- $38,618
- Composite
- 41.28/100
- National rank
- #3519
- State rank
- #44 of 73 in FL
Livability — Citrus Springs
- Score
- 68/100
- State rank
- #521
- US rank
- #9598
Category grades
Schools grade is shown separately in the Schools card above.
Census & demographics
- City population
- 10,730
- Population (ZIP)
- 8,218
Population outlook (Citrus County) Hauer SSP2
- Today (2025)
- 138,622 people
- By 2030
- 136,886 · -1.3%
- By 2040
- 132,009 · -4.8%
- By 2050
- 125,196 · -9.7%
- By 2075
- 108,570 · -21.7%
- By 2100
- 84,454 · -39.1%
Race, ethnicity, and origin ACS 2023
- Neighborhood character
- Predominantly White (76%)
- Race & ethnicity
- White 76% Hispanic / Latino 13% Two or more races 13%
- Hispanic origin (detail)
- Puerto Rican 6% Cuban 1%
- Common ancestry
- Italian 2% Romanian 2% Lithuanian 1%
- Foreign-born
- 9% · Canada
- Languages at home
- 90% English-only · Spanish 9% Other Indo-European 1%
Political lean MEDSL · Citrus
- 2024 margin
- Solid R (+45.9) · D 26.8% · R 72.6%
- 2008→2024 swing
- -29.8pp toward R · 2008: -16.1pp · 2024: -45.9pp
- All cycles
- 2024: R+45.9 2020: R+41.0 2016: R+39.7 2012: R+21.9 2008: R+16.1
Not yet ingested
- Civics
- —
Market trends
- HPI YoY
- ▼ -6.35%
- Current HPI
- 340.9844
- Rent YoY
- —
- Metro
- —
- State GDP YoY
- ▲ 3.28%
- F500 in state
- 36
Industry mix (Fortune 500 HQ in FL)
| Industry | F500 HQs | Revenue |
|---|---|---|
| Industrial Technology | 2 | $29B |
|
||
| Insurance | 2 | $17B |
|
||
| Retail | 1 | $60B |
|
||
| Technology Distribution | 1 | $58B |
|
||
| Homebuilding | 1 | $35B |
|
||
| Technology Manufacturing | 1 | $35B |
|
||
Price history
+1661.5% since first listed5 events — show timeline
- 2026-05-21 Price Changed $229,000 Stellar MLS as Distributed by MLS Grid
- 2026-05-20 Price Changed $239,000 Stellar MLS as Distributed by MLS Grid
- 2026-04-30 Listed $240,000 Stellar MLS as Distributed by MLS Grid
- 2003-12-22 Sold (MLS) $13,000 RACC
- 2003-06-27 Listed $13,000 RACC
Property tax history
+16.2%/yrLatest (2025): $2,498 · +6.4% YoY. Source: county tax records.
Cash-flow waterfall
monthlySold comps — $/sqft
last 12 mo · ≤1 miLoading sold comps…