 🏗️ New Construction
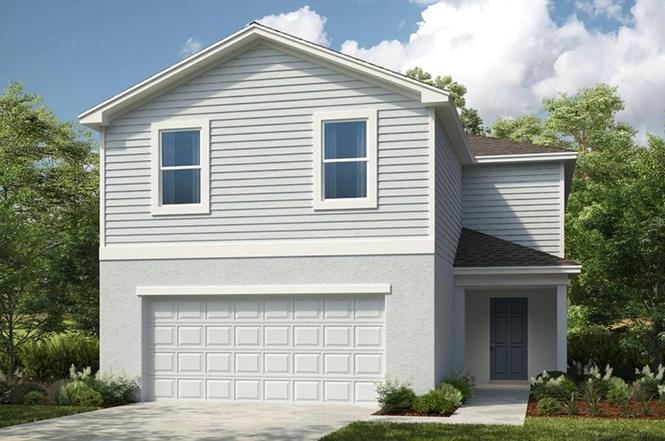
9320 Chiswell Trl · Ruskin, FL
Flood risk No data
- FEMA flood zone
- —
- Chance of flooding over 30 yrs
- —
- Est. flood insurance / yr
- —
Fire risk No data
- Est. fire insurance / yr
- —
Heat risk No data
- Hot days now (above threshold)
- —
- Hot days in 30 yrs
- —
Wind risk No data
- Chance of severe wind over 30 yrs
- —
Air-quality risk No data
- Unhealthy air days now
- —
- Unhealthy air days in 30 yrs
- —
Risk factors via First Street. Map © Google.
Why this score? — see what drove the F grade
The composite is a weighted blend of 9 inputs, each scored 0–100. Each bar is that input's sub-score; the figure is the points it added to the 100-point composite (weight × sub-score).
- Cash flow +8.8/30.0
- ARV discount +7.5/15.0
- Schools +4.4/10.0
- Livability +3.6/5.0
- 1% rule +2.9/10.0
- Condition / age +2.5/5.0
- DSCR +2.4/10.0
- Rent growth +1.8/5.0
- Appreciation +0.0/10.0
$369,499
🖨 Deal sheet (PDF) 📄 Offer letter ✓ Due diligence
Listing remarks
Under Construction. What's Special: Oversized Closet in Primary | Low HOA Dues | Loft | Close to Trails. New Construction - May Completion! Built by Taylor Morrison, America's Most Trusted Home Builder. Welcome to the Sherwood at 9320 Chiswell Trail in Cove at Coasterra. This thoughtfully designed new home offers an open-concept layout that makes everyday living easy and enjoyable. Step inside and you’ll find the dining area flowing into the great room and open kitchen, creating a bright and inviting space for gathering. The kitchen features a center island and a walk-in pantry for plenty of storage. Just off the main living area, a secondary bedroom suite with a private bath provides
Key facts
- Oversized closet
- Loft
- Close to trails
Tags
Neighborhood map
What this means for you Summary
Snapshot
- This is a 5-bed/3.5-bath single-family listed at $369k.
Deal economics
- At list price, monthly cash flow is $-342 ($-4k/yr) — negative.
- To cash-flow at today's rent, offer at most $368k (0.4% below list).
- To meet the 1% rule (rent ≥ 1% of price), the offer needs to be $329k (10.9% below list).
- Recommended offer: $329k (10.9% below list) — sets the bar for 1% rule.
Location & tenants
- Location reads 71/100 on livability (#392 in FL) — a middle-class / working-renter tenant base. Strengths: cost of living A+, housing A+, commute B+; Watch: amenities F, health & safety F.
- Manatee (suburban): math 54% / reading 50% proficiency, ranked #26 of 73 in FL (top 36%) — acceptable for families but not a draw, mixed tenant base, ~2y average lease.
- Zoned schools: James Tillman Elementary Magnet School (math 65% / reading 34%, grade D, #1,088 of 2,144 statewide, top 53%, 520 students, 74% FRL); Palmetto High School (math 22% / reading 36%, grade F, #456 of 667 statewide, top 68%, 2,100 students, 61% FRL) — zoned schools average 68% FRL vs 51% district-wide (17 pts higher); higher-poverty schools than district average — tighter screening recommended.
- Zoned-school proficiency averages 39% at this address vs 52% district-wide (-13 pts) — the specific schools serving this property underperform the Manatee average; the district grade overstates school quality for this exact location.
- Market conditions: Rents soft (-3.0%/yr); 1170 active listings in the ZIP; 4 comparable units currently listed for rent nearby; rentals at typical pace (median 26d on market — plan ~3-4 weeks tenant-placement turnaround); solid renter incomes; 7,472 units permitted in Manatee County in 2024 (1,782 in 5+ unit buildings).
- At $3,294/mo this rent would consume 51% of the median local household income ($78k/yr) (locally 1193% of renters already pay >50% of income on rent) — very limited rent-growth headroom before tenants either downsize or default.
Forward outlook
- Local home prices are declining (-3.0%/yr); year-one equity from $3k of loan paydown is wiped out by about $13k of value loss. Plan a longer hold.
- Manatee County population projected at +43% by 2050 — long-run rental-demand tailwind backs the buy-and-hold thesis.
Negotiation context
- It's been on market 48 days — a 3% lower offer ($358k) is reasonable based on typical stale-listing flexibility.
Questions for the listing agent
- What do current leases actually rent for vs. the listed asking? Can we see a recent rent roll and the last 12 months of T-12 income?
- It's been on market 48 days. Have you received any prior offers? Is the seller open to a 11% concession, seller financing, or rate buy-down credit?
- What does the HOA fee cover, when was the last increase, and are there any pending special assessments or reserve-fund shortfalls?
- Is there a deadline driving the sale (1031 exchange, divorce, estate, relocation)? That informs how much negotiation room exists.
- Schools are F-rated, which usually means shorter tenancies and higher turnover. Who's the typical renter profile here, and what's been the actual vacancy rate?
- The area grade is low — what's the realistic commute time and amenity access for the typical tenant pool here? Any planned neighborhood developments (good or bad) we should know about?
- What's the average days-on-market for RENTAL listings here right now (not sales)? A rising rental-DOM trend means longer vacancies and softer asking-rent achievability than the comps imply.
- What's the recent tenant-quality profile in this submarket — average credit score on applications, eviction rate, late-payment / NSF rate, and stable-employment percentage? A property-management company in the area should have these aggregated.
- How much new for-sale + rental construction is in the pipeline within 1–3 miles? Heavy new supply typically softens prices + rents 12–24 months out; constrained supply supports both.
Investment metrics
- 1% rule
- 0.79% ✗
- Cap rate
- 5.31%
- Cash-on-cash
- -3.51%
- DSCR
- 0.84
- GRM
- 10.6
CMA / ARV
- ARV (on-the-fly)
- $417,656
- Comps found
- 12
Show comp detail 12 sales within ~0.75 mi
| Address | Dist | Beds/Ba | Sqft | Sold | Price | $/sf | Match |
|---|---|---|---|---|---|---|---|
| 9320 Chiswell Trl | 0.00mi | 5/3.5 | 2,516 (0%) | 0mo | $365,900 | $145 | 100 |
| 13828 Shellmore Ave | 0.11mi | 5/3.5 | 2,504 (-0%) | 0mo | $385,000 | $154 | 94 |
| 13721 Shellmore Ave | 0.11mi | 4/2.5 (-1) | 2,271 (-10%) | 1mo | $364,999 | $161 | 69 |
| 13811 Shellmore Ave | 0.11mi | 4/2.5 (-1) | 2,271 (-10%) | 3mo | $365,000 | $161 | 67 |
| 9142 Dalera Cv | 0.08mi | 4/2.5 (-1) | 2,168 (-14%) | 3mo | $378,000 | $174 | 62 |
| 13212 Shellmore Ave | 0.30mi | 4/2.0 (-1) | 2,723 (+8%) | 1mo | $451,180 | $166 | 61 |
| 13509 Shellmore Ave | 0.15mi | 4/2.5 (-1) | 2,168 (-14%) | 0mo | $365,000 | $168 | 60 |
| 13221 Shellmore Ave | 0.28mi | 4/2.0 (-1) | 2,723 (+8%) | 2mo | $465,000 | $171 | 60 |
| 13431 Shellmore Ave | 0.17mi | 4/2.5 (-1) | 2,168 (-14%) | 2mo | $380,000 | $175 | 59 |
| 13407 Shellmore Ave | 0.19mi | 4/2.5 (-1) | 2,168 (-14%) | 2mo | $340,000 | $157 | 57 |
| 10476 Curving Creek Loop | 0.69mi | 4/3.0 (-1) | 2,260 (-10%) | 1mo | $356,990 | $158 | 42 |
| 10465 Curving Creek Loop | 0.72mi | 4/3.0 (-1) | 2,260 (-10%) | 2mo | $379,990 | $168 | 41 |
Match score weights: distance 35% · size 25% · config 20% · recency 20%. Top-matched comps best support the ARV.
Projected returns pro-forma
-3.0% appreciation · 0.0% rent growth · sell at horizon
- IRR
- -25.6%
- Equity multiple
- 0.15×
- Total profit
- $-99,043
- Equity at exit
- $62,274
- IRR
- -35.9%
- Equity multiple
- -0.29×
- Total profit
- $-151,269
- Equity at exit
- $36,111
Cash invested: $116,944 (down + closing). Projections, not guarantees.
Landlord ↔ Tenant lean methodology
- Overall (STATE)
- 87 Strongly Landlord-Friendly
- State Florida
- 87 Strongly Landlord-Friendly · R+3
- County
- — inherits STATE
- City
- — inherits STATE
ZIP-level market 34221
- Rents YoY
- -3.0%
- Active inventory
- 1170
- Price-to-rent
- 9.3×
Monthly cashflow live
- Estimated rent
- $3,294 medium interval (Pro) →
- Mortgage (P&I)
- −$2,190
- Tax est. 1.5%
- −$522 /mo · $6,265/yr
- Insurance
- −$174
- HOA
- −$58
- Vacancy / Maint / Mgmt
- −$692
- Net cashflow
- $-342
Break-even live
Sensitivity live
| Price | -10% $-54 | -5% $-198 | +0% $-342 | +5% $-487 | +10% $-631 |
|---|---|---|---|---|---|
| Rent | -10% $-602 | -5% $-472 | +0% $-342 | +5% $-212 | +10% $-82 |
| Rate | -1.0pp $-132 | -0.5pp $-236 | base $-342 | +0.5pp $-450 | +1.0pp $-561 |
UW: 25.0% down · 7.5% · 30yr · 1.5% tax · 5.0% vac · 8.0% maint · 8.0% mgmt
Financing live
Cash to close
- Down payment
- $104,414
- Closing costs
- $12,530
- Reserves months
- —
- Total cash needed
- —
Loan-product check · same deal, 3 products live
Conventional
25% down · 7.5% · 30yr
- Down + closing
- —
- Monthly P&I
- —
- Monthly cashflow
- —
- DSCR
- —
- Eligible?
- —
Personal DTI + credit; lowest rate.
DSCR
20% down · 8.5% · 30yr
- Down + closing
- —
- Monthly P&I
- —
- Monthly cashflow
- —
- DSCR
- —
- Eligible?
- —
No personal income docs; deal must DSCR.
Hard money
10% down · 12.0% · 12mo
- Down + closing
- —
- Monthly P&I
- —
- Monthly cashflow
- —
- DSCR
- —
- Eligible?
- —
Short-term bridge; refi at stabilization.
Rent comps 4 comps
| Address | Beds | Baths | Sqft | Rent | $/sqft | DOM | Units | Dist |
|---|---|---|---|---|---|---|---|---|
| 10826 Sapphire Breeze Cv Palmetto, FL | 4.0 | 2.0 | 1850 | $2,500 | $1.35 | 5d | 1 | 1.15mi |
| 10749 Hidden Banks Gln Parrish, FL | 5.0 | 3.0 | 2447 | $2,549 | $1.04 | 25d | 1 | 1.18mi |
| 10935 Gentle Current Way Parrish, FL | 5.0 | 3.0 | 2605 | $3,900 | $1.50 | 25d | 1 | 1.30mi |
| 11612 Armada Way Parrish, FL | 4.0 | 2.0 | 2112 | $3,400 | $1.61 | 21d | 1 | 1.34mi |
HOA detail
- Monthly dues
- $58 · $696/yr
Listing history 4 events
-
2026-03-03status Pending
-
2026-02-18price $369,499
-
2026-01-23price $368,999
-
2026-01-14$367,999 Active
ⓘ Source: listings_history table (triggers on properties + properties_extension) + one-shot
backfill from property_details.listing_events for pre-trigger history.
Nearby sold comps map
Loading sold comps map…
Walkable amenities ~0.75 mi
Loading nearby amenities…
Taxation est. · year 1
- Rental income
- $39,525
- − Mortgage interest
- −$23,395
- − Property taxes
- −$6,265
- − Insurance
- −$2,088
- − Repairs & maintenance
- −$3,162
- − Management
- −$3,162
- − HOA
- −$696
- − Depreciation
- −$12,150
- Taxable loss
- −$11,393
- Est. tax savings @ 24.0%
- +$2,734
- After-tax cash flow
- $-1,372/yr
For passive investors: Depreciation is non-cash, so a rental often shows a tax loss while cash-flowing — sheltering income. Rental losses are passive: they offset passive income freely, and up to $25,000/yr can offset ordinary (W-2) income if you actively participate and your MAGI is under $100k (phasing out to $0 by $150k); unused losses carry forward. On sale, claimed depreciation is recaptured at up to 25%, and gains may owe capital-gains tax (a 1031 exchange can defer both). Figures are a year-1 estimate at your 24.0% rate — not tax advice; consult a CPA.
Schools (NCES district)
- District
- Manatee
- NCES district ID
- 1201230
- Math proficiency
- 54% ▼ -6.00%
- Reading proficiency
- 50% ▼ -2.00%
- Median HH income
- $49,607
- Composite
- 44.43/100
- National rank
- #2806
- State rank
- #26 of 73 in FL
Livability — Ruskin
- Score
- 71/100
- State rank
- #392
- US rank
- #6879
Category grades
Schools grade is shown separately in the Schools card above.
Census & demographics
- County
- Manatee County · 416,364 people
- City population
- 33,319
- Metro
- North Port-Sarasota-Bradenton, FL
- Population (ZIP)
- 56,208
- Household income
- $77,712
- Rent vs Own
- Severe rent burden
- 1193.0
Population outlook (Manatee County) Hauer SSP2
- Today (2025)
- 447,342 people
- By 2030
- 488,911 · +9.3%
- By 2040
- 567,934 · +27.0%
- By 2050
- 637,995 · +42.6%
- By 2075
- 781,970 · +74.8%
- By 2100
- 848,272 · +89.6%
Race, ethnicity, and origin ACS 2023
- Neighborhood character
- Diverse neighborhood (Simpson 0.58)
- Race & ethnicity
- White 59% Hispanic / Latino 22% Black 14% Two or more races 11%
- Hispanic origin (detail)
- Mexican 14% Puerto Rican 3%
- Common ancestry
- Romanian 2% Lithuanian 2% Italian 2%
- Foreign-born
- 10% · Canada, Dominican Republic, Jamaica
- Languages at home
- 81% English-only · Spanish 16% Other Indo-European 1%
Political lean MEDSL · Manatee
- 2024 margin
- Strong R (+23.5) · D 37.9% · R 61.4%
- 2008→2024 swing
- -16.5pp toward R · 2008: -7.0pp · 2024: -23.5pp
- All cycles
- 2024: R+23.5 2020: R+16.1 2016: R+17.1 2012: R+12.5 2008: R+7.0
Not yet ingested
- Civics
- —
Market trends
- HPI YoY
- ▼ -383.53%
- Current HPI
- 302.1458
- Rent YoY
- ▼ -2.98%
- Metro
- North Port-Sarasota-Bradenton, FL
- State GDP YoY
- ▲ 3.28%
- F500 in state
- 36
Industry mix (Fortune 500 HQ in FL)
| Industry | F500 HQs | Revenue |
|---|---|---|
| Industrial Technology | 2 | $29B |
|
||
| Insurance | 2 | $17B |
|
||
| Retail | 1 | $60B |
|
||
| Technology Distribution | 1 | $58B |
|
||
| Homebuilding | 1 | $35B |
|
||
| Technology Manufacturing | 1 | $35B |
|
||
Price history
+0.4% since first listed4 events — show timeline
- 2026-03-03 Pending — Stellar MLS as Distributed by MLS Grid
- 2026-02-18 Price Changed $369,499 Stellar MLS as Distributed by MLS Grid
- 2026-01-23 Price Changed $368,999 Stellar MLS as Distributed by MLS Grid
- 2026-01-14 Listed $367,999 Stellar MLS as Distributed by MLS Grid
Cash-flow waterfall
monthlySold comps — $/sqft
last 12 mo · ≤1 miLoading sold comps…