 🏢 Co-op
1311 Delaware Ave SW · Washington, DC
Flood risk 6/10 · Moderate
- FEMA flood zone
- X (shaded)
- Chance of flooding over 30 yrs
- 0.27%
- Est. flood insurance / yr
- $473 – $860
Fire risk 1/10 · Minimal
- Est. fire insurance / yr
- $631 – $1,173
Heat risk 7/10 · Major
- Hot days now (above 104°F)
- 7 days/yr
- Hot days in 30 yrs
- 15 days/yr
Wind risk 4/10 · Minor
- Chance of severe wind over 30 yrs
- 20.0%
Air-quality risk 4/10 · Minor
- Unhealthy air days now
- 4 days/yr
- Unhealthy air days in 30 yrs
- 5 days/yr
Risk factors via First Street. Map © Google.
Why this score? — see what drove the D+ grade
The composite is a weighted blend of 9 inputs, each scored 0–100. Each bar is that input's sub-score; the figure is the points it added to the 100-point composite (weight × sub-score).
- Cash flow +15.0/30.0
- ARV discount +7.5/15.0
- 1% rule +5.0/10.0
- DSCR +5.0/10.0
- Livability +3.7/5.0
- Schools +3.6/10.0
- Appreciation +3.3/10.0
- Condition / age +2.5/5.0
- Rent growth +2.0/5.0
$75,000
🖨 Deal sheet (PDF) 📄 Offer letter ✓ Due diligence
Multi-family units
County records classify this as Multi-Family (5+ Unit). Listing-text estimate: 1 unit. estimate disagrees with records
5+ unit building — per-unit beds/baths from public records are typically unavailable; the breakdown below (if shown) is an estimate from the listing text.
Listing remarks
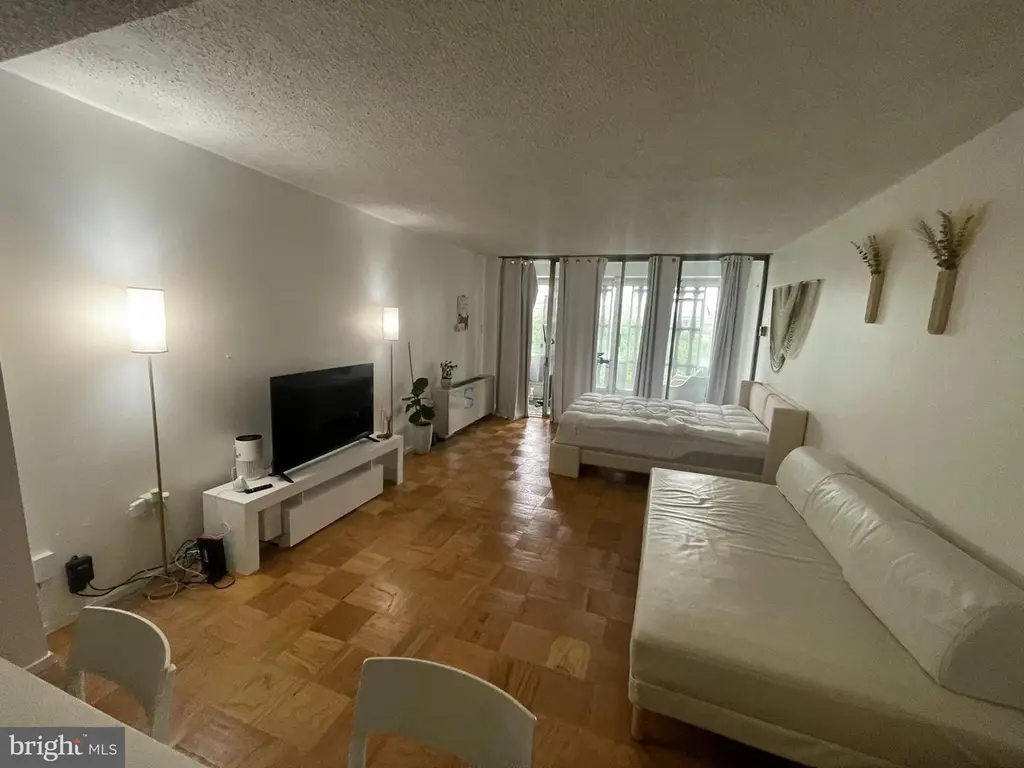
Located in the desirable South building, this spacious, sun-drenched studio boasts walls of windows, ample space to stretch out, and classic hardwood floors. Right off the living area is the covered porch- a perfect work from home space, as well as a place to enjoy your morning coffee or unwind after a long day with sunset views! The updated kitchen is outfitted with ample countertops and cabinet storage. Live in the heart of the SW Waterfront and have it all in the amenity-rich River Park Community! Co-op fees include gas, water, trash, sewer, electric, 24/7 concierge, fitness center, pool, security, party room, library, and more! Parking is available for rent inside the gated community. T
Key facts
- Covered porch
- Fitness center
- Updated kitchen
Tags
Property features AI
Finance
- Other: Community pool (in-ground)
- HOA & community: Monthly condo fee; Condo fee covers underlying mortgage, taxes, water, sewer, management, electricity, air conditioning, heat, and other items; Community amenities include common grounds, concierge, elevator, exercise/fitness room, extra storage, laundry facilities, picnic area, outdoor pool, and playground/tot lots
Exterior
- Parking: On-site rented parking in a parking lot
- Security: Concierge; Gated community
- Utilities: Public water; Public sewer
- Home design: Condominium unit; Mid-rise building (5–8 floors); Unit/flat; Entry on 2nd floor; Urban location; Property manager on-site; Pets allowed (cats and dogs allowed; restrictions and limits apply)
- Construction: Year built: estimated; Roof: Unknown
- Exterior features: Balcony; Above-grade outdoor structures
Interior
- Kitchen: Built-in microwave; Dishwasher; Garbage disposal; Electric oven/range; Refrigerator
- Flooring: Wood flooring
- Bathrooms: One full bathroom
- Heating & cooling: Heating: Other; Cooling: Other; Hot water: Other
- Interior features: Open floor plan; Combination kitchen and dining area; Upgraded countertops; Wood floors; Sliding glass door
- Laundry & utility: Shared/common laundry in basement; No in-unit washer/dryer hookups
Neighborhood map
What this means for you Summary
Snapshot
- This is a ?-bed/1.0-bath multifamily listed at $75k.
Deal economics
- At list price, monthly cash flow is $3k ($38k/yr) — positive.
- The deal already cash-flows at list — no discount required.
- Meets the 1% rule at list price ($5k rent vs $75k).
- Cap rate 57.2% vs local median 2.5% in Washington — top-decile yield for the area; either an underpriced asset or a hidden risk that comps aren't pricing in. Stress-test before assuming the spread holds.
Location & tenants
- Location reads 73/100 on livability (#1 in DC) — a middle-class / working-renter tenant base. Strengths: amenities A+, commute A+, employment A+; Watch: crime F, cost of living F.
- District Of Columbia Public Schools (urban): math 33% / reading 40% proficiency, ranked #8 of 32 in DC (top 25%) — families likely to look elsewhere, expect single-tenant / working-renter base with shorter leases; 65% free/reduced lunch — lower-income household profile, screen leases tightly.
- Market conditions: Rents soft (-1.9%/yr); 156 active listings in the ZIP; 40 comparable units currently listed for rent nearby; rentals leasing fast (median 8d on market — plan ~1-2 weeks tenant-placement turnaround); solid renter incomes; 1,737 units permitted in District of Columbia in 2024 (1,506 in 5+ unit buildings).
- At $4,686/mo this rent would consume 52% of the median local household income ($107k/yr) (locally 1549% of renters already pay >50% of income on rent) — very limited rent-growth headroom before tenants either downsize or default.
Forward outlook
- Local home prices are declining (-3.0%/yr); year-one equity from $519 of loan paydown is wiped out by about $2k of value loss. Plan a longer hold.
- District of Columbia County population projected at +50% by 2050 — long-run rental-demand tailwind backs the buy-and-hold thesis.
- At projected returns (-3.0% appreciation + 0.0% rent growth), your $21k cash investment doubles in ~1 year — after that, you're playing with house money.
Negotiation context
- Only 1 days on market — expect competitive offers; lowballing is unlikely to land.
- 12 sale attempts since 2y ago with the ask held roughly flat each time — persistent listings suggest the price (not the market) is what's stuck; bring a comps-based counter.
Risks & watch-outs
- Climate carrying-cost: major flood risk; extreme-heat days projected 7→15/yr by 2055 (HVAC capex compounding) — expect insurance premiums to compound above CPI over the hold.
Questions for the listing agent
- Built in 1962 — when were the roof, HVAC, electrical panel, plumbing, and water heater last replaced?
- Is there a deadline driving the sale (1031 exchange, divorce, estate, relocation)? That informs how much negotiation room exists.
- Crime grade is F in this area — have there been break-ins, vandalism, or insurance claims at this property in the last 3 years? What carrier currently insures it and at what premium?
- The area grade is low — what's the realistic commute time and amenity access for the typical tenant pool here? Any planned neighborhood developments (good or bad) we should know about?
- What's the average days-on-market for RENTAL listings here right now (not sales)? A rising rental-DOM trend means longer vacancies and softer asking-rent achievability than the comps imply.
- What's the recent tenant-quality profile in this submarket — average credit score on applications, eviction rate, late-payment / NSF rate, and stable-employment percentage? A property-management company in the area should have these aggregated.
- How much new apartment / multifamily construction is in the pipeline within 1–3 miles? Heavy new supply (>2% of stock underway) typically softens rents 12–24 months out; light construction supports rent growth.
Investment metrics
- 1% rule
- 6.25% ✓
- Cap rate
- 57.23%
- Cash-on-cash
- 181.92%
- DSCR
- 9.09
- GRM
- 1.3
CMA / ARV
No comps found within radius.
Projected returns pro-forma
-3.0% appreciation · 0.0% rent growth · sell at horizon
- IRR
- —
- Equity multiple
- 9.43×
- Total profit
- $176,952
- Equity at exit
- $11,183
- IRR
- —
- Equity multiple
- 18.26×
- Total profit
- $362,397
- Equity at exit
- $6,485
Cash invested: $21,000 (down + closing). Projections, not guarantees.
Landlord ↔ Tenant lean methodology
- Overall (CITY)
- 0 Strongly Tenant-Friendly
- State District of Columbia
- 12 Strongly Tenant-Friendly · D+43
- County
- — inherits STATE
- City Washington
- 0 Strongly Tenant-Friendly · D+43
ZIP-level market 20024
- Home prices YoY
- -1.0%
- Rents YoY
- -1.9%
- Active inventory
- 156
- Price-to-rent
- 2.7×
Monthly cashflow live
- Estimated rent
- $4,686 high interval (Pro) →
- Mortgage (P&I)
- −$393
- Tax est. 1.5%
- −$94 /mo · $1,125/yr
- Insurance
- −$31
- HOA
- −$0
- Vacancy / Maint / Mgmt
- −$984
- Net cashflow
- $3,184
Break-even live
Sensitivity live
| Price | -10% $3,235 | -5% $3,210 | +0% $3,184 | +5% $3,158 | +10% $3,132 |
|---|---|---|---|---|---|
| Rent | -10% $2,813 | -5% $2,999 | +0% $3,184 | +5% $3,369 | +10% $3,554 |
| Rate | -1.0pp $3,221 | -0.5pp $3,203 | base $3,184 | +0.5pp $3,164 | +1.0pp $3,144 |
2-unit breakdown (identical units grouped — click to expand)
| Units | Beds | Baths | Est. rent |
|---|---|---|---|
| 2× units | 1 | 1 | $4,686 |
| #1 | 1 | 1 | $2,343 |
| #2 | 1 | 1 | $2,343 |
| Total (2 units) | $4,686 | ||
UW: 25.0% down · 7.5% · 30yr · 1.5% tax · 5.0% vac · 8.0% maint · 8.0% mgmt
Financing live
Cash to close
- Down payment
- $18,750
- Closing costs
- $2,250
- Reserves months
- —
- Total cash needed
- —
Loan-product check · same deal, 3 products live
Conventional
25% down · 7.5% · 30yr
- Down + closing
- —
- Monthly P&I
- —
- Monthly cashflow
- —
- DSCR
- —
- Eligible?
- —
Personal DTI + credit; lowest rate.
DSCR
20% down · 8.5% · 30yr
- Down + closing
- —
- Monthly P&I
- —
- Monthly cashflow
- —
- DSCR
- —
- Eligible?
- —
No personal income docs; deal must DSCR.
Hard money
10% down · 12.0% · 12mo
- Down + closing
- —
- Monthly P&I
- —
- Monthly cashflow
- —
- DSCR
- —
- Eligible?
- —
Short-term bridge; refi at stabilization.
Rent comps 40 comps
| Address | Beds | Baths | Sqft | Rent | $/sqft | DOM | Units | Dist |
|---|---|---|---|---|---|---|---|---|
| 1311 Delaware Ave SW Washington, DC | 2.0 | 1.0 | 782 | $2,625 | $3.35 | 8d | 2 | 0.03mi |
| 1301 Delaware Ave SW Washington, DC | 2.0 | 1.0 | 637 | $3,000 | $4.71 | 2d | 2 | 0.03mi |
| 240 M St SW Unit E709 Washington, DC | 1.0 | 1.0 | 690 | $2,250 | $3.26 | 19d | 1 | 0.10mi |
| 240 M St SW Unit E605 Washington, DC | 1.0 | 1.0 | 585 | $1,895 | $3.24 | 5d | 1 | 0.10mi |
| 1250 4th St SW Unit 312 Washington, DC | 1.0 | 1.5 | 748 | $1,995 | $2.67 | 11d | 1 | 0.11mi |
| 1425 4th St SW Unit M1 Washington, DC | 1.0 | 1.0 | 581 | $2,400 | $4.13 | 19d | 1 | 0.14mi |
| 1425 4th St SW Unit A609 Washington, DC | 1.0 | 1.0 | 735 | $2,250 | $3.06 | 22d | 1 | 0.14mi |
| 222 M St SW Washington, DC | 2.0 | 1.0–2.0 | 775 | $3,568 | $4.60 | 2d | 19 | 0.15mi |
| 1435 4th St SW Unit B306 Washington, DC | 1.0 | 1.0 | 976 | $2,400 | $2.46 | 25d | 1 | 0.17mi |
| 429 N St SW Washington, DC | 1.0 | 1.0 | 537 | $2,350 | $4.37 | 13d | 2 | 0.18mi |
| 118 O St SW Washington, DC | 3.0 | 2.0 | 1120 | $3,600 | $3.21 | 25d | 1 | 0.19mi |
| 301 M St SW Washington, DC | 2.0 | 1.0–2.0 | 698 | $3,256 | $4.66 | 2d | 22 | 0.19mi |
| 1101 3rd St SW Washington, DC | 1.0 | 1.0 | 701 | $2,225 | $3.17 | 4d | 1 | 0.21mi |
| 1101 3rd St SW Washington, DC | 1.0 | 1.0 | 497 | $2,200 | $4.42 | 25d | 2 | 0.21mi |
| 490 M St SW Washington, DC | 1.0 | 1.0 | 600 | $2,385 | $3.98 | 19d | 2 | 0.21mi |
| 1150 4th St SW Washington, DC | 2.0 | 1.0–2.0 | 698 | $3,110 | $4.45 | 2d | 41 | 0.22mi |
| 1001 3rd St SW Washington, DC | 1.0 | 1.0 | 556 | $2,374 | $4.27 | 2d | 104 | 0.26mi |
| 465 M St SW Washington, DC | 2.0 | 1.0–2.0 | 843 | $3,800 | $4.51 | 2d | 45 | 0.27mi |
| 525 Water St SW #411 Washington, DC | 1.0 | 1.0 | 580 | $2,500 | $4.31 | 25d | 1 | 0.28mi |
| 525 Water St SW #430 Washington, DC | 1.0 | 1.0 | 540 | $2,250 | $4.17 | 8d | 1 | 0.28mi |
| 350 Maple Dr SW Washington, DC | 2.0 | 1.0–2.0 | 845 | $5,323 | $6.30 | 2d | 30 | 0.31mi |
| 1220 Half St SW Unit B Washington, DC | 2.0 | 1.0 | 800 | $2,200 | $2.75 | 19d | 1 | 0.32mi |
| 1001 4th St SW Washington, DC | 1.0–2.0 | 1.0–2.5 | 1008 | $4,388 | $4.35 | 2d | 25 | 0.33mi |
| 82 Q St SW Unit 1 Washington, DC | 1.0 | 1.0 | 540 | $1,895 | $3.51 | 19d | 1 | 0.33mi |
| 113 Potomac Ave SW Washington, DC | 3.0 | 1.0–2.0 | 1008 | $7,634 | $7.57 | 2d | 139 | 0.35mi |
| 1345 S Capitol St SW Washington, DC | 2.0 | 1.0–2.0 | 936 | $3,379 | $3.61 | 2d | 21 | 0.35mi |
| 35 Parker Row SW Washington, DC | 2.0 | 1.0–2.0 | 770 | $6,000 | $7.79 | 2d | 12 | 0.38mi |
| 355 I St SW Unit S319 Washington, DC | 1.0 | 1.0 | 750 | $2,400 | $3.20 | 8d | 1 | 0.40mi |
| 770 Maine Ave SW Washington, DC | 2.0 | 1.0–2.0 | 735 | $3,815 | $5.19 | 2d | 9 | 0.40mi |
| 1221 Van St SE Washington, DC | 2.0 | 1.0–2.0 | 783 | $4,122 | $5.26 | 2d | 25 | 0.40mi |
| 355 I St SW Washington, DC | 2.0 | 1.0 | 722 | $2,495 | $3.45 | 16d | 3 | 0.40mi |
| 355 I St SW Washington, DC | 2.0 | 1.0 | 722 | $2,495 | $3.45 | 17d | 4 | 0.40mi |
| 201 I St SW Washington, DC | 2.0 | 1.0–2.5 | 972 | $3,551 | $3.65 | 4d | 1 | 0.41mi |
| 907 6th St SW Washington, DC | 2.0 | 1.0–2.0 | 925 | $3,975 | $4.30 | 2d | 23 | 0.42mi |
| 1211 Van St SE Unit 501a Washington, DC | 2.0 | 1.0 | 884 | $2,700 | $3.05 | 25d | 1 | 0.43mi |
| 1211 Van St SE Washington, DC | 1.0–3.0 | 1.0–2.5 | 1087 | $5,022 | $4.62 | 12d | 5 | 0.43mi |
| 60 I St SW Washington, DC | 2.0 | 1.0–2.0 | 702 | $3,609 | $5.14 | 3d | 21 | 0.43mi |
| 800 4th St SW Washington, DC | 1.0 | 1.0 | 549 | $2,100 | $3.83 | 2d | 7 | 0.44mi |
| 800 4th St SW Washington, DC | 1.0 | 1.0 | 582 | $2,350 | $4.04 | 19d | 7 | 0.44mi |
| 800 4th St SW Washington, DC | 1.0 | 1.0 | 582 | $2,350 | $4.04 | 18d | 6 | 0.44mi |
Listing history 2 events
-
2026-06-02remarks 699-char remark
-
2026-06-02$75,000 Active 1 DOM
ⓘ Source: listings_history table (triggers on properties + properties_extension) + one-shot
backfill from property_details.listing_events for pre-trigger history.
Climate risk First Street
- Flood 6/10 Major FEMA zone X (shaded) · 27% chance over 30 yrs
- Wildfire 1/10 Low
- Heat 7/10 Severe 7 d/yr ≥104°F today · 15 d/yr by 30 yrs out
- Wind 4/10 Moderate 20% chance of damaging wind over 30 yrs
- Air quality 4/10 Moderate 4 unhealthy d/yr today · 5 by 30 yrs out
Nearby sold comps map
Loading sold comps map…
Walkable amenities ~0.75 mi
Loading nearby amenities…
Taxation est. · year 1
- Rental income
- $56,232
- − Mortgage interest
- −$4,201
- − Property taxes
- −$1,125
- − Insurance
- −$375
- − Repairs & maintenance
- −$4,499
- − Management
- −$4,499
- − Depreciation
- −$2,182
- Taxable income
- $39,352
- Est. tax owed @ 24.0%
- −$9,444
- After-tax cash flow
- $28,759/yr
For passive investors: Depreciation is non-cash, so a rental often shows a tax loss while cash-flowing — sheltering income. Rental losses are passive: they offset passive income freely, and up to $25,000/yr can offset ordinary (W-2) income if you actively participate and your MAGI is under $100k (phasing out to $0 by $150k); unused losses carry forward. On sale, claimed depreciation is recaptured at up to 25%, and gains may owe capital-gains tax (a 1031 exchange can defer both). Figures are a year-1 estimate at your 24.0% rate — not tax advice; consult a CPA.
Schools (NCES district)
- District
- District Of Columbia Public Schools
- NCES district ID
- 1100030
- Math proficiency
- 33% ▲ 3.00%
- Reading proficiency
- 40% ▲ 5.00%
- Median HH income
- $67,671
- Composite
- 35.84/100
- National rank
- #9606
- State rank
- #8 of 32 in DC
Livability — Washington
- Score
- 73/100
- State rank
- #1
- US rank
- #5327
Category grades
Schools grade is shown separately in the Schools card above.
Census & demographics
- Census place
- Washington, DC
- County
- District of Columbia · 671,873 people
- City population
- 671,873
- Metro
- Washington-Arlington-Alexandria, DC-VA-MD-WV
- Population (ZIP)
- 15,888
- Household income
- $107,411
- Rent vs Own
- Severe rent burden
- 1549.0
Population outlook (District of Columbia County) Hauer SSP2
- Today (2025)
- 821,926 people
- By 2030
- 899,517 · +9.4%
- By 2040
- 1,061,162 · +29.1%
- By 2050
- 1,231,493 · +49.8%
- By 2075
- 1,603,312 · +95.1%
- By 2100
- 1,847,141 · +124.7%
Race, ethnicity, and origin ACS 2023
- Neighborhood character
- Diverse neighborhood (Simpson 0.66)
- Race & ethnicity
- Black 41% White 41% Hispanic / Latino 9% Two or more races 8% Asian 3%
- Hispanic origin (detail)
- Mexican 2% Puerto Rican 1%
- Common ancestry
- Romanian 3% Iranian 2% Slovak 1%
- Foreign-born
- 10% · Canada, South Korea, China
- Languages at home
- 85% English-only · Spanish 7% Other Indo-European 2% German/W. Germanic 1%
Political lean MEDSL · District of Columbia
- 2024 margin
- Solid D (+86.1) · D 91.2% · R 5.1% · Other 3.8%
- 2008→2024 swing
- +0.1pp no change · 2008: 85.9pp · 2024: 86.1pp
- All cycles
- 2024: D+86.1 2020: D+86.8 2016: D+88.7 2012: D+84.2 2008: D+85.9
Not yet ingested
- Civics
- —
Market trends
- HPI YoY
- ▼ -3.47%
- Current HPI
- 358.3856
- Rent YoY
- ▼ -1.91%
- Metro
- Washington-Arlington-Alexandria, DC-VA-MD-WV
- State GDP YoY
- ▲ 1.33%
- F500 in state
- 6
Industry mix (Fortune 500 HQ in DC)
| Industry | F500 HQs | Revenue |
|---|---|---|
| Financial Services | 1 | $153B |
|
||
| Life Sciences / Industrials | 1 | $25B |
|
||
| Industrial Machinery | 1 | $8B |
|
||
Price history
+3471.4% since first listed24 events — show timeline
- 2026-06-01 Listed $75,000 BRIGHT MLS
- 2026-05-30 Listed for Rent $2,645 SHOWMOJO
- 2026-05-22 Rental Removed $2,150 BRIGHTMLS
- 2026-05-22 Listed for Rent $2,150 SHOWMOJO
- 2026-05-11 Listing Removed — BRIGHT MLS
- 2026-04-05 Rental Removed $1,650 APPFOLIO
- 2026-04-03 Listed for Rent $1,650 APPFOLIO
- 2026-03-25 Rental Removed $2,750 SHOWMOJO
- 2026-02-27 Rental Removed $2,750 APPFOLIO
- 2026-02-10 Listed for Rent $2,750 BRIGHTMLS
- 2026-02-10 Rental Removed $2,850 BRIGHTMLS
- 2026-01-22 Listed $148,000 BRIGHT MLS
- 2026-01-10 Listed for Rent $2,850 BRIGHTMLS
- 2026-01-02 Coming Soon — BRIGHT MLS
- 2025-12-16 Price Changed $1,800 APPFOLIO
- 2025-12-11 Listed for Rent $2,795 SHOWMOJO
- 2025-11-05 Listed for Rent $1,899 APPFOLIO
- 2025-02-23 Rental Removed $1,800 APPFOLIO
- 2025-02-08 Listed for Rent $1,800 APPFOLIO
- 2024-11-01 Rental Removed $2,100 RENTALBEAST
- 2024-10-22 Listed for Rent $2,100 RENTALBEAST
- 2024-10-17 Rental Removed $2,100 RENTALBEAST
- 2024-10-04 Listed for Rent $2,100 RENTALBEAST
- 2022-02-03 Price Changed $860 RENT.
Cash-flow waterfall
monthlySold comps — $/sqft
last 12 mo · ≤1 miLoading sold comps…