16 N Star Vale -- Unit 122a · Star Valley, AZ
Flood risk 6/10 · Moderate
- FEMA flood zone
- D
- Chance of flooding over 30 yrs
- 0.73%
- Est. flood insurance / yr
- $544 – $1,084
Fire risk 9/10 · Severe
- Est. fire insurance / yr
- $610 – $1,132
Heat risk 4/10 · Minor
- Hot days now (above 97°F)
- 7 days/yr
- Hot days in 30 yrs
- 18 days/yr
Wind risk 1/10 · Minimal
- Chance of severe wind over 30 yrs
- —
Air-quality risk 1/10 · Minimal
- Unhealthy air days now
- 0 days/yr
- Unhealthy air days in 30 yrs
- 0 days/yr
Risk factors via First Street. Map © Google.
Why this score? — see what drove the C+ grade
The composite is a weighted blend of 9 inputs, each scored 0–100. Each bar is that input's sub-score; the figure is the points it added to the 100-point composite (weight × sub-score).
- Cash flow +30.0/30.0
- DSCR +10.0/10.0
- 1% rule +9.7/10.0
- Condition / age +4.0/5.0
- Rent growth +2.5/5.0
- Schools +2.2/10.0
- Livability +2.2/5.0
- ARV discount +0.0/15.0
- Appreciation +0.0/10.0
$82,000
🖨 Deal sheet (PDF) 📄 Offer letter ✓ Due diligence
Listing remarks MLS
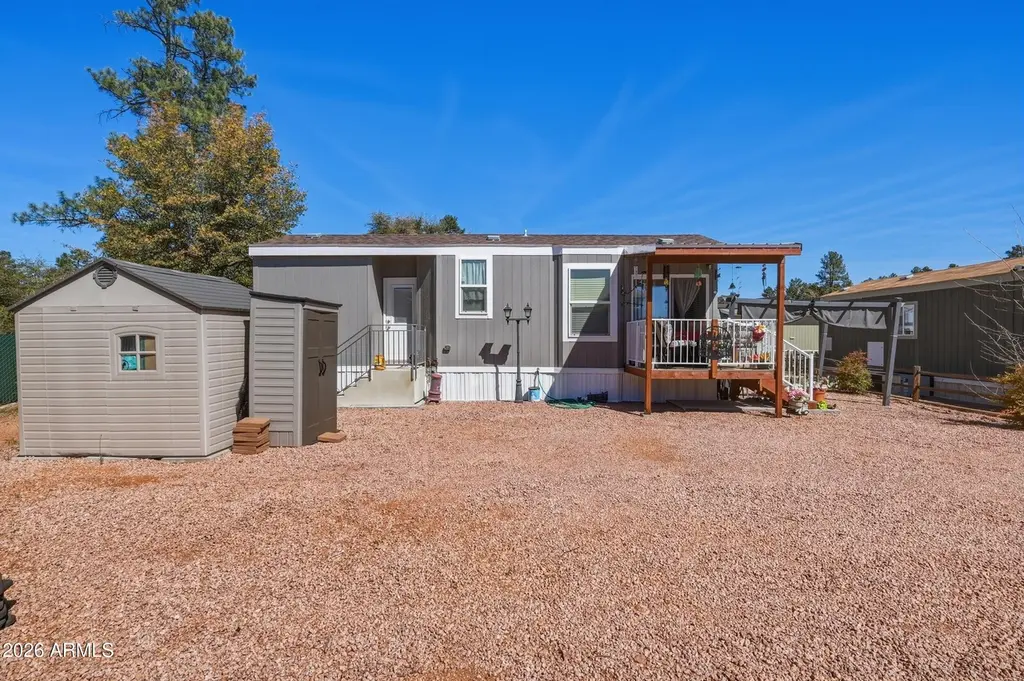
Super cute park model in the W Ranch Resort 55+ community on a quite cul-d-sac. Gorgeous mountain views from the covered dec. Large storage shed. Full size washer and dryer. All electric. One bedroom and one bathroom. Private back yard area. Pergola in front yard area. Lot rent of $650/mo includes water, sewer, trash. Access to the parks gym, pickle ball court, dog park, and club house.
Key facts
- Private back yard
- Pergola
- Covered dec
Tags
Neighborhood map
What this means for you Summary
Snapshot
- This is a 1-bed/1.0-bath single-family listed at $82k. Condition is rated good.
Deal economics
- At list price, monthly cash flow is $384 ($5k/yr) — positive.
- The deal already cash-flows at list — no discount required.
- Meets the 1% rule at list price ($1k rent vs $82k).
- Recommended offer: $77k (6.0% below list) — sets the bar for market timing.
- Cap rate 11.9% vs local median 3.8% in Star Valley — top-decile yield for the area; either an underpriced asset or a hidden risk that comps aren't pricing in. Stress-test before assuming the spread holds.
Location & tenants
- Location reads 44/100 on livability (#380 in AZ) — a working-class tenant base; expect higher turnover. Strengths: cost of living A+, crime A; Watch: amenities F, commute F, employment F.
- Payson Unified District (4209) (town): math 20% / reading 32% proficiency, ranked #138 of 249 in AZ (top 55%) — low school quality limits family demand, transient renter base, plan for 1-2y turnover.
- Zoned schools: Julia Randall Elementary School (math 20% / reading 36%, grade F, #586 of 1,109 statewide, top 53%, 576 students, 58% FRL); Rim Country Middle School (math 21% / reading 31%, grade F, #100 of 218 statewide, top 47%, 493 students, 53% FRL); Payson High School (math 22% / reading 32%, grade F, #141 of 381 statewide, top 38%, 790 students, 40% FRL) — zoned schools at 50% FRL track the district average.
- Market conditions: 708 active listings in the ZIP; 217 units permitted in Gila County in 2024 (0 in 5+ unit buildings).
Forward outlook
- Local home prices are declining (-3.0%/yr); year-one equity from $567 of loan paydown is wiped out by about $2k of value loss. Plan a longer hold.
- Gila County population projected at -18% by 2050 — secular population decline; favor cash flow + early exit over multi-decade hold.
- At projected returns (-3.0% appreciation + 3.0% rent growth), your $23k cash investment doubles in ~7 years — after that, you're playing with house money.
Negotiation context
- It's been on market 84 days — a 6% lower offer ($77k) is reasonable based on typical stale-listing flexibility.
- 2 sale attempts with the ask held roughly flat each time — persistent listings suggest the price (not the market) is what's stuck; bring a comps-based counter.
Risks & watch-outs
- Climate carrying-cost: major flood risk; severe wildfire risk — expect insurance premiums to compound above CPI over the hold.
Questions for the listing agent
- It's been on market 84 days. Have you received any prior offers? Is the seller open to a 6% concession, seller financing, or rate buy-down credit?
- Why hasn't it sold? Are there any deal-killer items the seller is aware of (foundation, flood, title, zoning, code violations)?
- Is there a deadline driving the sale (1031 exchange, divorce, estate, relocation)? That informs how much negotiation room exists.
- Schools are F-rated, which usually means shorter tenancies and higher turnover. Who's the typical renter profile here, and what's been the actual vacancy rate?
- What's the average days-on-market for RENTAL listings here right now (not sales)? A rising rental-DOM trend means longer vacancies and softer asking-rent achievability than the comps imply.
- What's the recent tenant-quality profile in this submarket — average credit score on applications, eviction rate, late-payment / NSF rate, and stable-employment percentage? A property-management company in the area should have these aggregated.
- How much new for-sale + rental construction is in the pipeline within 1–3 miles? Heavy new supply typically softens prices + rents 12–24 months out; constrained supply supports both.
Investment metrics
- 1% rule
- 1.47% ✓
- Cap rate
- 11.91%
- Cash-on-cash
- 20.05%
- DSCR
- 1.89
- GRM
- 5.7
CMA / ARV
- ARV (median comp)
- $64,304
- List price
- $82,000
- Delta
- 27.52%
- Verdict
- OVERPRICED
- Comps
- 15 within 1.0 mi
Show comp detail 12 sales within ~0.75 mi
| Address | Dist | Beds/Ba | Sqft | Sold | Price | $/sf | Match |
|---|---|---|---|---|---|---|---|
| 16 Star Vale Dr Unit 154A | 0.00mi | 1/1.0 | 396 (-3%) | 5mo | $95,000 | $240 | 91 |
| 16 N Star Vale Rd Unit 153B | 0.06mi | 1/1.0 | 399 (-2%) | 9mo | $93,000 | $233 | 86 |
| 16 N Star Vale Drive Dr Unit 131B | 0.08mi | 1/1.0 | 408 (0%) | 16mo | $68,000 | $167 | 83 |
| 16 N Star Vale Dr Spc 126A | 0.00mi | 1/1.0 | 396 (-3%) | 15mo | $78,000 | $197 | 82 |
| 16 N Star Vale Drive Dr Unit 101A | 0.08mi | 1/1.0 | 396 (-3%) | 15mo | $92,000 | $232 | 79 |
| 3696 Az-260 Unit A6 | 0.16mi | 1/1.0 | 385 (-6%) | 7mo | $80,000 | $208 | 77 |
| 16 N Star Vale Dr Unit 152B | 0.06mi | 2/1.0 (+1) | 398 (-2%) | 13mo | $95,000 | $239 | 77 |
| 3680 E Hwy 260 Unit B2 | 0.18mi | 1/1.0 | 396 (-3%) | 12mo | $69,000 | $174 | 77 |
| 16 N Star Vale Drive Dr Unit 123B | 0.08mi | 1/1.0 | 396 (-3%) | 23mo | $79,000 | $199 | 72 |
| 3933 E AZ Highway 260 #114 | 0.43mi | 1/1.0 | 398 (-2%) | 6mo | $50,000 | $126 | 70 |
| 16 N Star Vale Dr Unit 125B | 0.22mi | 1/1.0 | 399 (-2%) | 19mo | $85,000 | $213 | 70 |
| 3680 Az-260 Unit C24 | 0.18mi | 1/1.0 | 385 (-6%) | 18mo | $77,000 | $200 | 67 |
Match score weights: distance 35% · size 25% · config 20% · recency 20%. Top-matched comps best support the ARV.
Projected returns pro-forma
-3.0% appreciation · 3.0% rent growth · sell at horizon
- IRR
- 12.2%
- Equity multiple
- 1.49×
- Total profit
- $11,168
- Equity at exit
- $12,226
- IRR
- 21.2%
- Equity multiple
- 2.80×
- Total profit
- $41,266
- Equity at exit
- $7,090
Cash invested: $22,960 (down + closing). Projections, not guarantees.
Landlord ↔ Tenant lean methodology
- Overall (STATE)
- 87 Strongly Landlord-Friendly
- State Arizona
- 87 Strongly Landlord-Friendly · R+3
- County
- — inherits STATE
- City
- — inherits STATE
ZIP-level market 85541
- Home prices YoY
- -6.6%
- Active inventory
- 708
- Price-to-rent
- 5.7×
Monthly cashflow live
- Estimated rent
- $1,203 medium interval (Pro) →
- Mortgage (P&I)
- −$430
- Tax est. 1.5%
- −$102 /mo · $1,230/yr
- Insurance
- −$34
- HOA
- −$0
- Lot rent
- −$0
- Vacancy / Maint / Mgmt
- −$253
- Net cashflow
- $384
Break-even live
Sensitivity live
| Price | -10% $440 | -5% $412 | +0% $384 | +5% $355 | +10% $327 |
|---|---|---|---|---|---|
| Rent | -10% $289 | -5% $336 | +0% $384 | +5% $431 | +10% $479 |
| Rate | -1.0pp $425 | -0.5pp $405 | base $384 | +0.5pp $362 | +1.0pp $341 |
UW: 25.0% down · 7.5% · 30yr · 1.5% tax · 5.0% vac · 8.0% maint · 8.0% mgmt
Financing live
Cash to close
- Down payment
- $20,500
- Closing costs
- $2,460
- Reserves months
- —
- Total cash needed
- —
Loan-product check · same deal, 3 products live
Conventional
25% down · 7.5% · 30yr
- Down + closing
- —
- Monthly P&I
- —
- Monthly cashflow
- —
- DSCR
- —
- Eligible?
- —
Personal DTI + credit; lowest rate.
DSCR
20% down · 8.5% · 30yr
- Down + closing
- —
- Monthly P&I
- —
- Monthly cashflow
- —
- DSCR
- —
- Eligible?
- —
No personal income docs; deal must DSCR.
Hard money
10% down · 12.0% · 12mo
- Down + closing
- —
- Monthly P&I
- —
- Monthly cashflow
- —
- DSCR
- —
- Eligible?
- —
Short-term bridge; refi at stabilization.
Listing history 19 events
-
2026-06-22days on market $82,000 Active 84 DOM
-
2026-06-21days on market $82,000 Active 83 DOM
-
2026-06-19days on market $82,000 Active 81 DOM
-
2026-06-18days on market $82,000 Active 80 DOM
-
2026-06-17days on market $82,000 Active 79 DOM
-
2026-06-16days on market $82,000 Active 78 DOM
-
2026-06-15days on market $82,000 Active 77 DOM
-
2026-06-14days on market $82,000 Active 75 DOM
-
2026-06-12days on market $82,000 Active 74 DOM
-
2026-06-09days on market $82,000 Active 71 DOM
-
2026-06-08days on market $82,000 Active 70 DOM
-
2026-06-07days on market $82,000 Active 69 DOM
-
2026-06-03days on market $82,000 Active 65 DOM
-
2026-06-02days on market $82,000 Active 64 DOM
-
2026-06-01days on market $82,000 Active 63 DOM
-
2026-05-31days on market $82,000 Active 62 DOM
-
2026-05-31days on market $82,000 Active 61 DOM
-
2026-03-30$82,000 Active 389-char remark
Show marketing remark (389 chars)
Super cute park model in the W Ranch Resort 55+ community on a quite cul-d-sac. Gorgeous mountain views from the covered dec. Large storage shed. Full size washer and dryer. All electric. One bedroom and one bathroom. Private back yard area. Pergola in front yard area. Lot rent of $650/mo includes water, sewer, trash. Access to the parks gym, pickle ball court, dog park, and club house.
-
2026-03-27$82,000 Active 418-char remark
Show marketing remark (418 chars)
Super cute park model in the W Ranch Resort 55+ community on a quite cul-d-sac. Gorgeous mountain views from the covered dec. Large storage shed. Full size washer and dryer. All electric. One bedroom and one bathroom. Private back yard area. Pergola in front yard area. Lot rent of $650/mo includes water, sewer, trash. Access to the parks gym, pickle ball court, dog park, and club house. Schedule your showing today.
ⓘ Source: listings_history table (triggers on properties + properties_extension) + one-shot
backfill from property_details.listing_events for pre-trigger history.
Climate risk First Street
- Flood 6/10 Major FEMA zone D · 73% chance over 30 yrs
- Wildfire 9/10 Extreme
- Heat 4/10 Moderate 7 d/yr ≥97°F today · 18 d/yr by 30 yrs out
- Wind 1/10 Low
- Air quality 1/10 Low 0 unhealthy d/yr today · 0 by 30 yrs out
Nearby sold comps map
Loading sold comps map…
Walkable amenities ~0.75 mi
Loading nearby amenities…
Taxation est. · year 1
- Rental income
- $14,436
- − Mortgage interest
- −$4,593
- − Property taxes
- −$1,230
- − Insurance
- −$410
- − Repairs & maintenance
- −$1,155
- − Management
- −$1,155
- − Depreciation
- −$2,385
- Taxable income
- $3,508
- Est. tax owed @ 24.0%
- −$842
- After-tax cash flow
- $3,763/yr
For passive investors: Depreciation is non-cash, so a rental often shows a tax loss while cash-flowing — sheltering income. Rental losses are passive: they offset passive income freely, and up to $25,000/yr can offset ordinary (W-2) income if you actively participate and your MAGI is under $100k (phasing out to $0 by $150k); unused losses carry forward. On sale, claimed depreciation is recaptured at up to 25%, and gains may owe capital-gains tax (a 1031 exchange can defer both). Figures are a year-1 estimate at your 24.0% rate — not tax advice; consult a CPA.
Condition & rehab AI · 12 photos
This park model in a 55+ community is in good condition with a maintained exterior and interior. It offers a covered deck and pergola for outdoor living, and is located on a quiet cul-de-sac with mountain views.
Value-add opportunities
- Both Paint exterior siding — Fresh paint can enhance curb appeal and property value.
- Both Replace outdoor furniture — Fresh outdoor furniture can improve the appeal and functionality of the covered deck and pergola.
Renovation cost estimate screening
Value-add ROI direction
- Both Paint exterior siding — Fresh paint can enhance curb appeal and property value. ↑
- Both Replace outdoor furniture — Fresh outdoor furniture can improve the appeal and functionality of the covered deck and pergola. ↑
ⓘ Cost ranges are severity-bucket heuristics (US national rule-of-thumb). Get contractor quotes + a written scope before underwriting a rehab budget.
Schools (NCES district)
- District
- Payson Unified District (4209)
- NCES district ID
- 0406070
- Math proficiency
- 20% ▼ -21.00%
- Reading proficiency
- 32% ▼ -16.00%
- Median HH income
- $41,440
- Composite
- 22.03/100
- National rank
- #8200
- State rank
- #138 of 249 in AZ
Livability — Star Valley
- Score
- 44/100
- State rank
- #380
- US rank
- #26699
Category grades
Schools grade is shown separately in the Schools card above.
Census & demographics
- Census place
- Star Valley, AZ
- County
- Gila County · 23,382 people
- Metro
- Payson, AZ
- Population (ZIP)
- 23,382
- Household income
- $66,383
- Rent vs Own
- Severe rent burden
- 523.0
Population outlook (Gila County) Hauer SSP2
- Today (2025)
- 50,229 people
- By 2030
- 48,202 · -4.0%
- By 2040
- 44,101 · -12.2%
- By 2050
- 41,041 · -18.3%
- By 2075
- 37,536 · -25.3%
- By 2100
- 32,485 · -35.3%
Race, ethnicity, and origin ACS 2023
- Neighborhood character
- Predominantly White (84%)
- Race & ethnicity
- White 84% Hispanic / Latino 11% Two or more races 8% Native American 1%
- Hispanic origin (detail)
- Mexican 9%
- Common ancestry
- Portuguese 3% Lithuanian 2% Iranian 2%
- Foreign-born
- 3% · Canada
- Languages at home
- 93% English-only · Spanish 5% German/W. Germanic 1%
Political lean MEDSL · Gila
- 2024 margin
- Solid R (+37.6) · D 30.8% · R 68.4%
- 2008→2024 swing
- -9.8pp toward R · 2008: -27.8pp · 2024: -37.6pp
- All cycles
- 2024: R+37.6 2020: R+34.1 2016: R+32.4 2012: R+26.4 2008: R+27.8
Not yet ingested
- Civics
- —
Market trends
- HPI YoY
- ▼ -29.47%
- Current HPI
- 416.4005
- Rent YoY
- —
- Metro
- Payson, AZ
- State GDP YoY
- ▲ 4.54%
- F500 in state
- 20
Industry mix (Fortune 500 HQ in AZ)
| Industry | F500 HQs | Revenue |
|---|---|---|
| Technology | 2 | $13B |
|
||
| Mining / Metals | 1 | $23B |
|
||
| Environmental Services | 1 | $16B |
|
||
| Metals / Steel | 1 | $14B |
|
||
| Technology Distribution | 1 | $9B |
|
||
| Homebuilding | 1 | $8B |
|
||
Price history
+0.0% since first listed2 events — show timeline
- 2026-03-30 Listed $82,000 ARMLS
- 2026-03-27 Listed $82,000 CAAR
Cash-flow waterfall
monthlySold comps — $/sqft
last 12 mo · ≤1 miLoading sold comps…