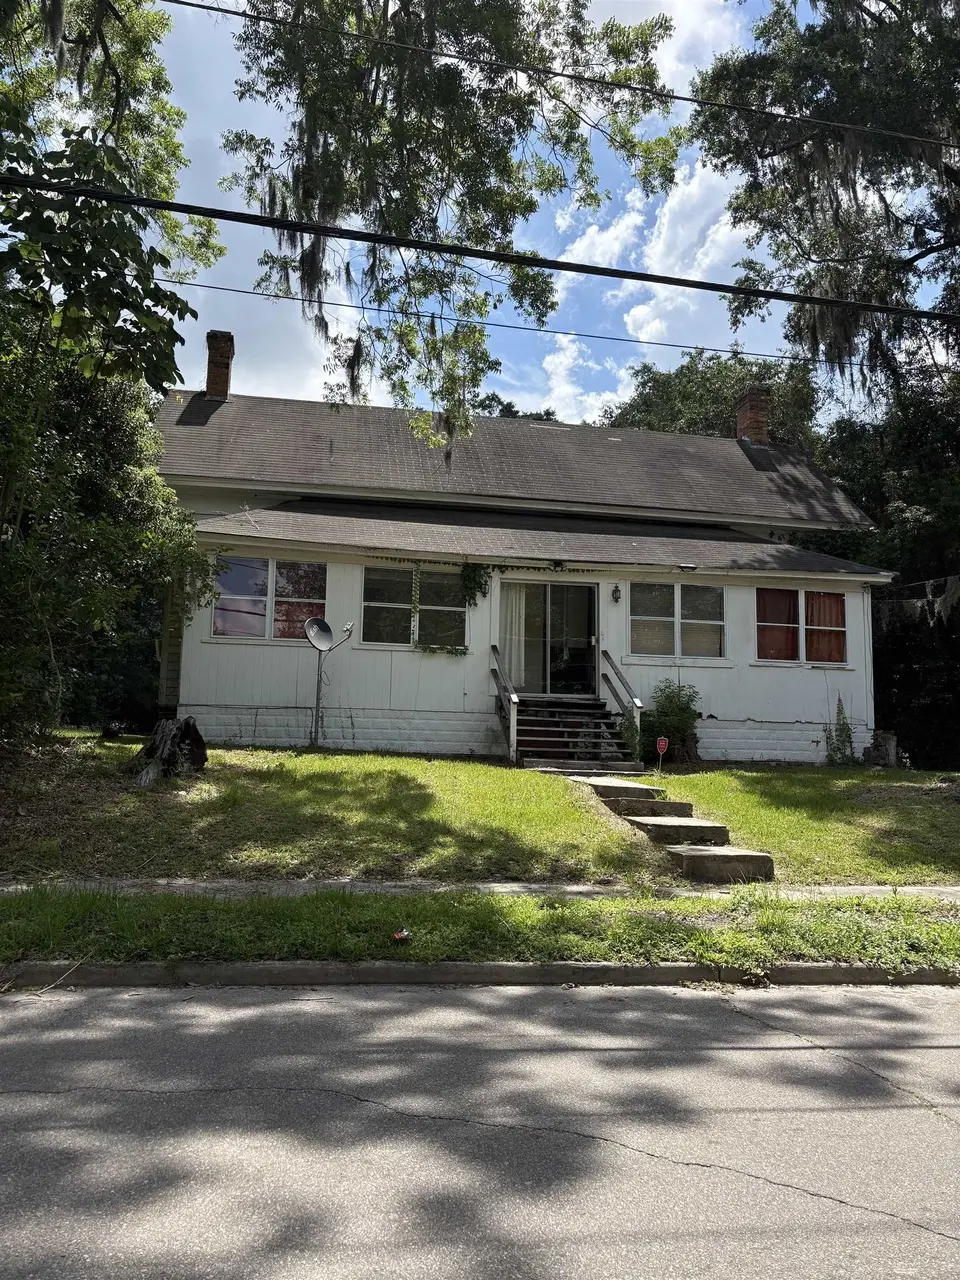
340 S Waukeenah St · Monticello, FL
Flood risk 1/10 · Minimal
- FEMA flood zone
- X (unshaded)
- Chance of flooding over 30 yrs
- 0.0%
- Est. flood insurance / yr
- $507 – $1,088
Fire risk 5/10 · Moderate
- Est. fire insurance / yr
- $947 – $1,759
Heat risk 8/10 · Major
- Hot days now (above 107°F)
- 7 days/yr
- Hot days in 30 yrs
- 19 days/yr
Wind risk 9/10 · Severe
- Chance of severe wind over 30 yrs
- 99.0%
Air-quality risk 4/10 · Minor
- Unhealthy air days now
- 7 days/yr
- Unhealthy air days in 30 yrs
- 7 days/yr
Risk factors via First Street. Map © Google.
Why this score? — see what drove the B- grade
The composite is a weighted blend of 9 inputs, each scored 0–100. Each bar is that input's sub-score; the figure is the points it added to the 100-point composite (weight × sub-score).
- Cash flow +30.0/30.0
- 1% rule +10.0/10.0
- DSCR +10.0/10.0
- ARV discount +7.5/15.0
- Livability +3.6/5.0
- Rent growth +2.5/5.0
- Schools +2.5/10.0
- Condition / age +2.5/5.0
- Appreciation +0.0/10.0
$100,000
🖨 Deal sheet (PDF) 📄 Offer letter ✓ Due diligence
Listing remarks
They don’t build them like they used to! This historic 1900 home located in downtown Monticello sits on nearly a half-acre lot and is full of timeless character waiting to be restored. Featuring original hardwood floors throughout most of the home, beadboard walls, 9+ foot ceilings, and original glass windows, this property offers the charm and craftsmanship so many buyers desire. Spacious 3-bedroom floor plan with an updated kitchen and bathroom already in place. While the home has solid bones and endless potential, it will require significant renovations including electrical updates, roof replacement, plumbing updates, and HVAC installation. A rare opportunity to bring new life to a
Key facts
- Beadboard walls
- Half-acre lot
- 9 foot ceilings
Tags
Property features AI
Finance
- Financial info: Offered for sale
Exterior
- Parking: Driveway; On-street parking
- Utilities: Public sewer
- Home design: Single-family property
- Exterior features: Patio; Paved road access
Interior
- Kitchen: Refrigerator; Stove; Microwave; Dishwasher
- Bedrooms: Bedroom 2 — 16 x 16; Bedroom 3 — 14 x 16
- Flooring: Hardwood
- Bathrooms: 1 full bathroom
- Heating & cooling: Space heater; Ceiling fans; Wall/window AC unit(s)
- Interior features: High ceilings; Split bedroom layout; Fireplace
- Laundry & utility: Washer; Dryer; Utility room — 16 x 16
Neighborhood map
What this means for you Summary
Snapshot
- This is a 3-bed/1.0-bath single-family listed at $100k.
Deal economics
- At list price, monthly cash flow is $554 ($7k/yr) — positive.
- The deal already cash-flows at list — no discount required.
- Meets the 1% rule at list price ($2k rent vs $100k).
- Recommended offer: $97k (3.0% below list) — sets the bar for market timing.
- Cap rate 12.9% vs local median 2.6% in Monticello — top-decile yield for the area; either an underpriced asset or a hidden risk that comps aren't pricing in. Stress-test before assuming the spread holds.
Location & tenants
- Location reads 72/100 on livability (#356 in FL) — a middle-class / working-renter tenant base. Strengths: crime A+, cost of living A+, health & safety A+; Watch: amenities D-, commute F, employment D-.
- Jefferson (rural): math 28% / reading 30% proficiency, ranked #71 of 73 in FL (top 97%) — low school quality limits family demand, transient renter base, plan for 1-2y turnover; 74% free/reduced lunch — lower-income household profile, screen leases tightly.
- Zoned schools: Jefferson Schools K-12 (math 32% / reading 32%, 715 students, 58% FRL) — zoned schools average 58% FRL vs 74% district-wide (16 pts lower); this property's tenant base skews higher-income than the district average.
- Market conditions: 65 active listings in the ZIP; 64 units permitted in Jefferson County in 2024 (0 in 5+ unit buildings).
Forward outlook
- Local home prices are declining (-3.0%/yr); year-one equity from $691 of loan paydown is wiped out by about $3k of value loss. Plan a longer hold.
- Jefferson County population projected at -34% by 2050 — secular population decline; favor cash flow + early exit over multi-decade hold.
- At projected returns (-3.0% appreciation + 3.0% rent growth), your $28k cash investment doubles in ~6 years — after that, you're playing with house money.
Negotiation context
- It's been on market 33 days — a 3% lower offer ($97k) is reasonable based on typical stale-listing flexibility.
- Current owner paid $30k; list at $100k implies a 233% gain — meaningful room to come down on a strong offer.
Risks & watch-outs
- Watch-outs: built in 1900 — expect roof / HVAC / electrical / plumbing capex.
- Climate carrying-cost: severe wind risk, 99% chance of damaging wind over 30y; moderate wildfire risk; extreme-heat days projected 7→19/yr by 2055 (HVAC capex compounding) — expect insurance premiums to compound above CPI over the hold.
Questions for the listing agent
- It's been on market 33 days. Have you received any prior offers? Is the seller open to a 3% concession, seller financing, or rate buy-down credit?
- Built in 1900 — when were the roof, HVAC, electrical panel, plumbing, and water heater last replaced?
- Is there a deadline driving the sale (1031 exchange, divorce, estate, relocation)? That informs how much negotiation room exists.
- Schools are D-rated, which usually means shorter tenancies and higher turnover. Who's the typical renter profile here, and what's been the actual vacancy rate?
- What's the average days-on-market for RENTAL listings here right now (not sales)? A rising rental-DOM trend means longer vacancies and softer asking-rent achievability than the comps imply.
- What's the recent tenant-quality profile in this submarket — average credit score on applications, eviction rate, late-payment / NSF rate, and stable-employment percentage? A property-management company in the area should have these aggregated.
- How much new for-sale + rental construction is in the pipeline within 1–3 miles? Heavy new supply typically softens prices + rents 12–24 months out; constrained supply supports both.
Investment metrics
- 1% rule
- 1.59% ✓
- Cap rate
- 12.94%
- Cash-on-cash
- 23.75%
- DSCR
- 2.06
- GRM
- 5.2
CMA / ARV
- ARV (on-the-fly)
- $295,176
- Comps found
- 9
Show comp detail 9 sales within ~0.75 mi
| Address | Dist | Beds/Ba | Sqft | Sold | Price | $/sf | Match |
|---|---|---|---|---|---|---|---|
| 480 W Washington St | 0.34mi | 3/2.0 | 1,985 (-1%) | 8mo | $360,000 | $181 | 72 |
| 300 Cedar St | 0.53mi | 3/2.0 | 2,044 (+2%) | 5mo | $263,000 | $129 | 64 |
| 685 E Washington St | 0.19mi | 4/2.0 (+1) | 1,812 (-10%) | 3mo | $266,000 | $147 | 64 |
| 375 Maple St | 0.07mi | 3/2.0 | 1,716 (-14%) | 7mo | $168,100 | $98 | 63 |
| 950 E Pearl St | 0.44mi | 3/1.5 | 1,855 (-8%) | 3mo | $300,000 | $162 | 62 |
| 575 W Madison St | 0.48mi | 3/1.5 | 1,834 (-9%) | 2mo | $277,500 | $151 | 60 |
| 395 W Palmer Mill Rd | 0.26mi | 3/1.5 | 1,772 (-12%) | 10mo | $315,000 | $178 | 58 |
| 265 W Seminole Ave | 0.47mi | 2/1.0 (-1) | 1,741 (-13%) | 2mo | $180,000 | $103 | 49 |
| 955 E Pearl St | 0.44mi | 4/2.0 (+1) | 2,152 (+7%) | 12mo | $110,000 | $51 | 48 |
Match score weights: distance 35% · size 25% · config 20% · recency 20%. Top-matched comps best support the ARV.
Projected returns pro-forma
-3.0% appreciation · 3.0% rent growth · sell at horizon
- IRR
- 16.9%
- Equity multiple
- 1.68×
- Total profit
- $19,122
- Equity at exit
- $14,910
- IRR
- 25.5%
- Equity multiple
- 3.22×
- Total profit
- $62,226
- Equity at exit
- $8,646
Cash invested: $28,000 (down + closing). Projections, not guarantees.
Landlord ↔ Tenant lean methodology
- Overall (STATE)
- 87 Strongly Landlord-Friendly
- State Florida
- 87 Strongly Landlord-Friendly · R+3
- County
- — inherits STATE
- City
- — inherits STATE
ZIP-level market 32344
- Home prices YoY
- -18.6%
- Active inventory
- 65
- Price-to-rent
- 5.2×
Monthly cashflow live
- Estimated rent
- $1,591 medium interval (Pro) →
- Mortgage (P&I)
- −$524
- Tax from tax record
- −$137 /mo · $1,638/yr
- Insurance
- −$42
- HOA
- −$0
- Vacancy / Maint / Mgmt
- −$334
- Net cashflow
- $554
Break-even live
Sensitivity live
| Price | -10% $611 | -5% $582 | +0% $554 | +5% $526 | +10% $498 |
|---|---|---|---|---|---|
| Rent | -10% $428 | -5% $491 | +0% $554 | +5% $617 | +10% $680 |
| Rate | -1.0pp $605 | -0.5pp $580 | base $554 | +0.5pp $528 | +1.0pp $502 |
UW: 25.0% down · 7.5% · 30yr · 1.5% tax · 5.0% vac · 8.0% maint · 8.0% mgmt
Financing live
Cash to close
- Down payment
- $25,000
- Closing costs
- $3,000
- Reserves months
- —
- Total cash needed
- —
Loan-product check · same deal, 3 products live
Conventional
25% down · 7.5% · 30yr
- Down + closing
- —
- Monthly P&I
- —
- Monthly cashflow
- —
- DSCR
- —
- Eligible?
- —
Personal DTI + credit; lowest rate.
DSCR
20% down · 8.5% · 30yr
- Down + closing
- —
- Monthly P&I
- —
- Monthly cashflow
- —
- DSCR
- —
- Eligible?
- —
No personal income docs; deal must DSCR.
Hard money
10% down · 12.0% · 12mo
- Down + closing
- —
- Monthly P&I
- —
- Monthly cashflow
- —
- DSCR
- —
- Eligible?
- —
Short-term bridge; refi at stabilization.
Listing history 19 events
-
2026-06-21days on market $100,000 Active 33 DOM
-
2026-06-18days on market $100,000 Active 30 DOM
-
2026-06-17days on market $100,000 Active 29 DOM
-
2026-06-16days on market $100,000 Active 28 DOM
-
2026-06-15days on market $100,000 Active 27 DOM
-
2026-06-14days on market $100,000 Active 25 DOM
-
2026-06-13days on market $100,000 Active 24 DOM
-
2026-06-10days on market $100,000 Active 22 DOM
-
2026-06-09days on market $100,000 Active 21 DOM
-
2026-06-08days on market $100,000 Active 20 DOM
-
2026-06-07days on market $100,000 Active 19 DOM
-
2026-06-03days on market $100,000 Active 15 DOM
-
2026-06-02days on market $100,000 Active 14 DOM
-
2026-06-01days on market $100,000 Active 13 DOM
-
2026-05-31days on market $100,000 Active 12 DOM
-
2026-05-30days on market $100,000 Active 11 DOM
-
2026-05-19$100,000 Active
-
1993-04-01soldstatus $30,000
-
1993-03-23soldstatus $30,000
ⓘ Source: listings_history table (triggers on properties + properties_extension) + one-shot
backfill from property_details.listing_events for pre-trigger history.
Tax reassessment forecast FL · Resets to sale price
- Current annual tax
- $1,638 · $137/mo
- Projected year-2 tax
- $1,638 · $137/mo
- Expected delta
- $0/yr ($0/mo · 0.0%)
ⓘ Screening estimate from a state-policy table — verify with the county assessor before closing.
Climate risk First Street
- Flood 1/10 Low FEMA zone X (unshaded) · 0% chance over 30 yrs
- Wildfire 5/10 Major
- Heat 8/10 Severe 7 d/yr ≥107°F today · 19 d/yr by 30 yrs out
- Wind 9/10 Extreme 99% chance of damaging wind over 30 yrs
- Air quality 4/10 Moderate 7 unhealthy d/yr today · 7 by 30 yrs out
Nearby sold comps map
Loading sold comps map…
Walkable amenities ~0.75 mi
Loading nearby amenities…
Taxation est. · year 1
- Rental income
- $19,090
- − Mortgage interest
- −$5,602
- − Property taxes
- −$1,638
- − Insurance
- −$500
- − Repairs & maintenance
- −$1,527
- − Management
- −$1,527
- − Depreciation
- −$2,909
- Taxable income
- $5,387
- Est. tax owed @ 24.0%
- −$1,293
- After-tax cash flow
- $5,357/yr
For passive investors: Depreciation is non-cash, so a rental often shows a tax loss while cash-flowing — sheltering income. Rental losses are passive: they offset passive income freely, and up to $25,000/yr can offset ordinary (W-2) income if you actively participate and your MAGI is under $100k (phasing out to $0 by $150k); unused losses carry forward. On sale, claimed depreciation is recaptured at up to 25%, and gains may owe capital-gains tax (a 1031 exchange can defer both). Figures are a year-1 estimate at your 24.0% rate — not tax advice; consult a CPA.
Schools (NCES district)
- District
- Jefferson
- NCES district ID
- 1200990
- Math proficiency
- 28% ▼ -10.00%
- Reading proficiency
- 30% ▼ -3.00%
- Median HH income
- $43,356
- Composite
- 24.74/100
- National rank
- #7605
- State rank
- #71 of 73 in FL
Livability — Monticello
- Score
- 72/100
- State rank
- #356
- US rank
- #6199
Category grades
Schools grade is shown separately in the Schools card above.
Census & demographics
- Census place
- Monticello, FL
- Population (ZIP)
- 12,879
Population outlook (Jefferson County) Hauer SSP2
- Today (2025)
- 12,681 people
- By 2030
- 11,811 · -6.9%
- By 2040
- 9,968 · -21.4%
- By 2050
- 8,319 · -34.4%
- By 2075
- 5,406 · -57.4%
- By 2100
- 3,278 · -74.2%
Race, ethnicity, and origin ACS 2023
- Neighborhood character
- Diverse neighborhood (Simpson 0.56)
- Race & ethnicity
- White 59% Black 30% Hispanic / Latino 5% Two or more races 5%
- Hispanic origin (detail)
- Mexican 3%
- Common ancestry
- Slovak 2% Lithuanian 1% Portuguese 1%
- Foreign-born
- 3% · Canada
- Languages at home
- 95% English-only · Spanish 3% Tagalog/Filipino 1%
Political lean MEDSL · Jefferson
- 2024 margin
- R (+18.6) · D 40.3% · R 58.9%
- 2008→2024 swing
- -22.3pp toward R · 2008: 3.7pp · 2024: -18.6pp
- All cycles
- 2024: R+18.6 2020: R+6.9 2016: R+5.1 2012: D+1.8 2008: D+3.7
Not yet ingested
- Civics
- —
Market trends
- HPI YoY
- ▼ -41.71%
- Current HPI
- 182.5741
- Rent YoY
- —
- Metro
- —
- State GDP YoY
- ▲ 3.28%
- F500 in state
- 36
Industry mix (Fortune 500 HQ in FL)
| Industry | F500 HQs | Revenue |
|---|---|---|
| Industrial Technology | 2 | $29B |
|
||
| Insurance | 2 | $17B |
|
||
| Retail | 1 | $60B |
|
||
| Technology Distribution | 1 | $58B |
|
||
| Homebuilding | 1 | $35B |
|
||
| Technology Manufacturing | 1 | $35B |
|
||
Price history
+233.3% since first listed3 events — show timeline
- 2026-05-19 Listed $100,000 CATRS
- 1993-04-01 Sold (Public Records) $30,000 Public Records
- 1993-03-23 Sold (Public Records) $30,000 Public Records
Property tax history
+9.4%/yrLatest (2025): $1,638 · +1.8% YoY. Source: county tax records.
Cash-flow waterfall
monthlySold comps — $/sqft
last 12 mo · ≤1 miLoading sold comps…