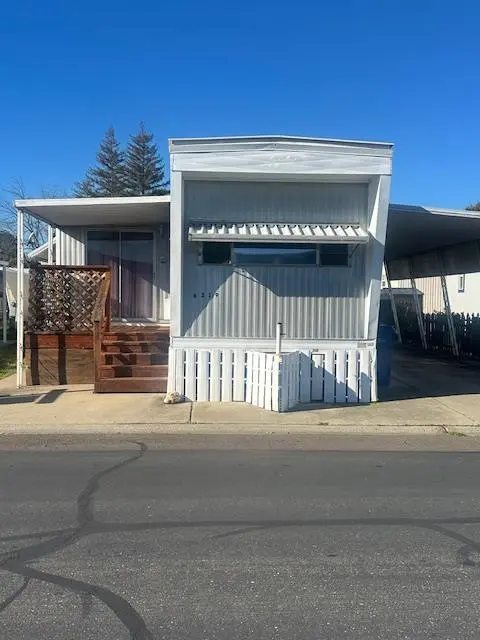
6219 Calgary Ave #90 · Carmichael, CA
Flood risk 7/10 · Major
- FEMA flood zone
- X (unshaded)
- Chance of flooding over 30 yrs
- 0.96%
- Est. flood insurance / yr
- $507 – $1,088
Fire risk 1/10 · Minimal
- Est. fire insurance / yr
- $659 – $1,223
Heat risk 7/10 · Major
- Hot days now (above 102°F)
- 6 days/yr
- Hot days in 30 yrs
- 13 days/yr
Wind risk 1/10 · Minimal
- Chance of severe wind over 30 yrs
- —
Air-quality risk 10/10 · Severe
- Unhealthy air days now
- 34 days/yr
- Unhealthy air days in 30 yrs
- 36 days/yr
Risk factors via First Street. Map © Google.
Why this score? — see what drove the C- grade
The composite is a weighted blend of 9 inputs, each scored 0–100. Each bar is that input's sub-score; the figure is the points it added to the 100-point composite (weight × sub-score).
- Cash flow +15.0/30.0
- ARV discount +15.0/15.0
- 1% rule +5.0/10.0
- DSCR +5.0/10.0
- Livability +3.2/5.0
- Schools +3.1/10.0
- Condition / age +2.5/5.0
- Rent growth +2.2/5.0
- Appreciation +0.0/10.0
$24,900
🖨 Deal sheet (PDF) 📄 Offer letter ✓ Due diligence
Listing remarks
Charming well maintained mobile home with expanded living room, flooring approx 4 yrs old, gas cooktop, custom backsplash, updated tub, water heater approx 1 year and covered redwood porch. Nestled in a serene setting located in a desireable 55+ adult community, offering a blend of nature and convenience. This peaceful oasis is tucked away from the hustle and bustle, yet remains close to everything you need! Community features amenities including community garden, fruit trees, dog park, RV storage, clubhouse with planned activities, on-site laundry facilities, bar-b-que patio and horseshoe pits. Surrounded by Arcade and Cripple Creeks and conveniently located near I-80, close to movie the
Key facts
- Gas cooktop
- Custom backsplash
- Updated tub
Tags
Neighborhood map
What this means for you Summary
Snapshot
- This is a 1-bed/1.0-bath manufactured listed at $25k.
Deal economics
- At list price, monthly cash flow is $944 ($11k/yr) — positive.
- The deal already cash-flows at list — no discount required.
- Meets the 1% rule at list price ($1k rent vs $25k).
- Recommended offer: $22k (12.0% below list) — sets the bar for market timing.
- Cap rate 55.0% vs local median 2.6% in Carmichael — top-decile yield for the area; either an underpriced asset or a hidden risk that comps aren't pricing in. Stress-test before assuming the spread holds.
Location & tenants
- Location reads 63/100 on livability (#471 in CA) — a middle-class / working-renter tenant base. Strengths: amenities A-, housing B+, employment B; Watch: crime F, commute F, cost of living F.
- Twin Rivers Unified (suburban): math 29% / reading 37% proficiency, ranked #970 of 1,400 in CA (top 69%) — families likely to look elsewhere, expect single-tenant / working-renter base with shorter leases; 76% free/reduced lunch — lower-income household profile, screen leases tightly.
- Zoned schools: Pioneer Elementary (639 students, 89% FRL); Foothill High (1,251 students, 91% FRL).
- Market conditions: Rents soft (-1.1%/yr); 83 active listings in the ZIP; 13 comparable units currently listed for rent nearby; rentals leasing fast (median 4d on market — plan ~1-2 weeks tenant-placement turnaround); 6,825 units permitted in Sacramento County in 2024 (1,752 in 5+ unit buildings).
Forward outlook
- Local home prices are declining (-3.0%/yr); year-one equity from $172 of loan paydown is wiped out by about $747 of value loss. Plan a longer hold.
- Sacramento County population projected at +17% by 2050 — long-run rental-demand tailwind backs the buy-and-hold thesis.
- At projected returns (-3.0% appreciation + 0.0% rent growth), your $7k cash investment doubles in ~1 year — after that, you're playing with house money.
Negotiation context
- It's been on market 144 days — a 12% lower offer ($22k) is reasonable based on typical stale-listing flexibility.
Risks & watch-outs
- Watch-outs: flood insurance adds $66/mo.
- Climate carrying-cost: major flood risk; extreme-heat days projected 6→13/yr by 2055 (HVAC capex compounding) — expect insurance premiums to compound above CPI over the hold.
Questions for the listing agent
- It's been on market 144 days. Have you received any prior offers? Is the seller open to a 12% concession, seller financing, or rate buy-down credit?
- Built in 1964 — when were the roof, HVAC, electrical panel, plumbing, and water heater last replaced?
- What's the actual annual flood-insurance premium (NFIP or private), and is the property in a SFHA with mandatory coverage?
- Why hasn't it sold? Are there any deal-killer items the seller is aware of (foundation, flood, title, zoning, code violations)?
- Is there a deadline driving the sale (1031 exchange, divorce, estate, relocation)? That informs how much negotiation room exists.
- Crime grade is F in this area — have there been break-ins, vandalism, or insurance claims at this property in the last 3 years? What carrier currently insures it and at what premium?
- What's the average days-on-market for RENTAL listings here right now (not sales)? A rising rental-DOM trend means longer vacancies and softer asking-rent achievability than the comps imply.
- What's the recent tenant-quality profile in this submarket — average credit score on applications, eviction rate, late-payment / NSF rate, and stable-employment percentage? A property-management company in the area should have these aggregated.
- How much new for-sale + rental construction is in the pipeline within 1–3 miles? Heavy new supply typically softens prices + rents 12–24 months out; constrained supply supports both.
Investment metrics
- 1% rule
- 6.01% ✓
- Cap rate
- 54.97%
- Cash-on-cash
- 173.84%
- DSCR
- 8.74
- GRM
- 1.4
CMA / ARV
- ARV (median comp)
- $31,021
- List price
- $24,900
- Delta
- -19.73%
- Verdict
- UNDERPRICED
- Comps
- 2 within 1.0 mi
Show comp detail 3 sales within ~0.75 mi
| Address | Dist | Beds/Ba | Sqft | Sold | Price | $/sf | Match |
|---|---|---|---|---|---|---|---|
| 5935 Auburn Blvd #4 | 0.31mi | 2/1.0 (+1) | 500 (0%) | 5mo | $32,500 | $65 | 77 |
| 5935 Auburn Blvd #36 | 0.28mi | 1/1.0 | 520 (+4%) | 8mo | $30,000 | $58 | 74 |
| 5935 Auburn Blvd #141 | 0.36mi | 1/1.0 | 500 (0%) | 22mo | $52,000 | $104 | 65 |
Match score weights: distance 35% · size 25% · config 20% · recency 20%. Top-matched comps best support the ARV.
Projected returns pro-forma
-3.0% appreciation · 0.0% rent growth · sell at horizon
- IRR
- —
- Equity multiple
- 8.42×
- Total profit
- $51,740
- Equity at exit
- $3,713
- IRR
- —
- Equity multiple
- 16.17×
- Total profit
- $105,750
- Equity at exit
- $2,153
Cash invested: $6,972 (down + closing). Projections, not guarantees.
Landlord ↔ Tenant lean methodology
- Overall (STATE)
- 18 Strongly Tenant-Friendly
- State California
- 18 Strongly Tenant-Friendly · D+13
- County
- — inherits STATE
- City
- — inherits STATE
ZIP-level market 95841
- Rents YoY
- -1.1%
- Active inventory
- 83
- Price-to-rent
- 1.4×
Monthly cashflow live
- Estimated rent
- $1,496 high interval (Pro) →
- Mortgage (P&I)
- −$131
- Tax est. 1.5%
- −$31 /mo · $374/yr
- Insurance
- −$10
- Flood insurance flood zone
- −$66 /mo · $798/yr
- HOA
- −$0
- Vacancy / Maint / Mgmt
- −$314
- Net cashflow
- $944
Break-even live
Sensitivity live
| Price | -10% $961 | -5% $952 | +0% $944 | +5% $935 | +10% $926 |
|---|---|---|---|---|---|
| Rent | -10% $825 | -5% $884 | +0% $944 | +5% $1,003 | +10% $1,062 |
| Rate | -1.0pp $956 | -0.5pp $950 | base $944 | +0.5pp $937 | +1.0pp $931 |
UW: 25.0% down · 7.5% · 30yr · 1.5% tax · 5.0% vac · 8.0% maint · 8.0% mgmt
Financing live
Cash to close
- Down payment
- $6,225
- Closing costs
- $747
- Reserves months
- —
- Total cash needed
- —
Loan-product check · same deal, 3 products live
Conventional
25% down · 7.5% · 30yr
- Down + closing
- —
- Monthly P&I
- —
- Monthly cashflow
- —
- DSCR
- —
- Eligible?
- —
Personal DTI + credit; lowest rate.
DSCR
20% down · 8.5% · 30yr
- Down + closing
- —
- Monthly P&I
- —
- Monthly cashflow
- —
- DSCR
- —
- Eligible?
- —
No personal income docs; deal must DSCR.
Hard money
10% down · 12.0% · 12mo
- Down + closing
- —
- Monthly P&I
- —
- Monthly cashflow
- —
- DSCR
- —
- Eligible?
- —
Short-term bridge; refi at stabilization.
Rent comps 13 comps
| Address | Beds | Baths | Sqft | Rent | $/sqft | DOM | Units | Dist |
|---|---|---|---|---|---|---|---|---|
| 5979 Devecchi Ave Citrus Heights, CA | 1.0–2.0 | 1.0–2.0 | 775 | $1,581 | $2.04 | 3d | 15 | 0.23mi |
| 6430 Verner Ave Sacramento, CA | 1.0–2.0 | 1.0–2.0 | 705 | $1,415 | $2.01 | 25d | 1 | 0.25mi |
| 6011 Shadow Ln Citrus Heights, CA | 1.0–2.0 | 1.0–2.0 | 779 | $1,714 | $2.20 | 3d | 15 | 0.46mi |
| 5501 Keoncrest Cir Unit 1 Sacramento, CA | 2.0 | 1.0 | 750 | $1,300 | $1.73 | 3d | 1 | 0.67mi |
| 6546 Auburn Blvd Citrus Heights, CA | 2.0 | 1.0 | 624 | $1,624 | $2.60 | 5d | 10 | 1.11mi |
| 5425 Garfield Ave Sacramento, CA | 1.0–2.0 | 1.0–2.0 | 787 | $1,299 | $1.65 | 22d | 5 | 1.15mi |
| 5500 Foothill Garden Ct Sacramento, CA | 1.0 | 1.0 | 750 | $1,472 | $1.96 | 3d | 2 | 1.18mi |
| 5322 Hemlock St Sacramento, CA | 1.0–2.0 | 1.0 | 800 | $1,375 | $1.72 | 3d | 2 | 1.18mi |
| 5244 Hackberry Ln Sacramento, CA | 2.0 | 1.0 | 712 | $1,712 | $2.41 | 45d | 1 | 1.24mi |
| 5226 Hemlock St #35 Sacramento, CA | 1.0 | 1.0 | 682 | $1,650 | $2.42 | 25d | 1 | 1.34mi |
| 5755 Callie Ln Sacramento, CA | 1.0–2.0 | 1.0–2.0 | 723 | $1,600 | $2.21 | 4d | 13 | 1.39mi |
| 6650 Crosswoods Cir Citrus Heights, CA | 1.0 | 1.0 | 465 | $1,575 | $3.39 | 3d | 6 | 1.40mi |
| 5341 Walnut Ave Sacramento, CA | 1.0–2.0 | 1.0 | 750 | $1,495 | $1.99 | 3d | 6 | 1.43mi |
Listing history 12 events
-
2026-06-17days on market $24,900 Active 144 DOM
-
2026-06-16days on market $24,900 Active 143 DOM
-
2026-06-15days on market $24,900 Active 142 DOM
-
2026-06-13days on market $24,900 Active 140 DOM
-
2026-06-13days on market $24,900 Active 139 DOM
-
2026-06-09days on market $24,900 Active 136 DOM
-
2026-06-08days on market $24,900 Active 135 DOM
-
2026-06-07days on market $24,900 Active 134 DOM
-
2026-06-03days on market $24,900 Active 130 DOM
-
2026-06-02days on market $24,900 Active 129 DOM
-
2026-06-01days on market $24,900 Active 128 DOM
-
2026-05-31days on market $24,900 Active 127 DOM
ⓘ Source: listings_history table (triggers on properties + properties_extension) + one-shot
backfill from property_details.listing_events for pre-trigger history.
Climate risk First Street
- Flood 7/10 Severe FEMA zone X (unshaded) · 96% chance over 30 yrs
- Wildfire 1/10 Low
- Heat 7/10 Severe 6 d/yr ≥102°F today · 13 d/yr by 30 yrs out
- Wind 1/10 Low
- Air quality 10/10 Extreme 34 unhealthy d/yr today · 36 by 30 yrs out
Nearby sold comps map
Loading sold comps map…
Walkable amenities ~0.75 mi
Loading nearby amenities…
Taxation est. · year 1
- Rental income
- $17,956
- − Mortgage interest
- −$1,395
- − Property taxes
- −$374
- − Insurance
- −$922
- − Repairs & maintenance
- −$1,436
- − Management
- −$1,436
- − Depreciation
- −$724
- Taxable income
- $11,669
- Est. tax owed @ 24.0%
- −$2,800
- After-tax cash flow
- $8,523/yr
For passive investors: Depreciation is non-cash, so a rental often shows a tax loss while cash-flowing — sheltering income. Rental losses are passive: they offset passive income freely, and up to $25,000/yr can offset ordinary (W-2) income if you actively participate and your MAGI is under $100k (phasing out to $0 by $150k); unused losses carry forward. On sale, claimed depreciation is recaptured at up to 25%, and gains may owe capital-gains tax (a 1031 exchange can defer both). Figures are a year-1 estimate at your 24.0% rate — not tax advice; consult a CPA.
Schools (NCES district)
- District
- Twin Rivers Unified
- NCES district ID
- 0601332
- Math proficiency
- 29% ▲ 2.00%
- Reading proficiency
- 37% ▲ 2.00%
- Median HH income
- $42,481
- Composite
- 30.67/100
- National rank
- #11437
- State rank
- #970 of 1400 in CA
Livability — Carmichael
- Score
- 63/100
- State rank
- #471
- US rank
- #15996
Category grades
Schools grade is shown separately in the Schools card above.
Census & demographics
- Census place
- Carmichael, CA
- County
- Sacramento County · 1,539,646 people
- City population
- 61,440
- Metro
- Sacramento-Roseville-Folsom, CA
- Population (ZIP)
- 20,500
- Household income
- $61,054
- Rent vs Own
- Severe rent burden
- 1353.0
Population outlook (Sacramento County) Hauer SSP2
- Today (2025)
- 1,660,763 people
- By 2030
- 1,732,990 · +4.3%
- By 2040
- 1,855,755 · +11.7%
- By 2050
- 1,941,335 · +16.9%
- By 2075
- 2,046,162 · +23.2%
- By 2100
- 1,961,444 · +18.1%
Race, ethnicity, and origin ACS 2023
- Neighborhood character
- Diverse neighborhood (Simpson 0.59)
- Race & ethnicity
- White 61% Hispanic / Latino 17% Two or more races 13% Black 9% Asian 6%
- Hispanic origin (detail)
- Mexican 13%
- Common ancestry
- Subsaharan African 5% Scotch-Irish 4% Lithuanian 2%
- Foreign-born
- 24% · Canada, China, Vietnam
- Languages at home
- 70% English-only · Russian/Polish/Slavic 11% Spanish 7% Other Indo-European 5%
Political lean MEDSL · Sacramento
- 2024 margin
- D (+19.7) · D 58.1% · R 38.4% · Other 3.5%
- 2008→2024 swing
- +0.7pp no change · 2008: 19.0pp · 2024: 19.7pp
- All cycles
- 2024: D+19.7 2020: D+25.3 2016: D+23.7 2012: D+16.3 2008: D+19.0
Not yet ingested
- Civics
- —
Market trends
- HPI YoY
- ▼ -227.82%
- Current HPI
- 369.8991
- Rent YoY
- ▼ -1.08%
- Metro
- Sacramento-Roseville-Folsom, CA
- State GDP YoY
- ▲ 3.21%
- F500 in state
- 116
Industry mix (Fortune 500 HQ in CA)
| Industry | F500 HQs | Revenue |
|---|---|---|
| Technology | 27 | $1,492B |
|
||
| Financial Services | 3 | $174B |
|
||
| Retail | 3 | $44B |
|
||
| Insurance | 3 | $26B |
|
||
| Media / Entertainment | 2 | $115B |
|
||
| Pharmaceuticals / Biotech | 2 | $62B |
|
||
Cash-flow waterfall
monthlySold comps — $/sqft
last 12 mo · ≤1 miLoading sold comps…