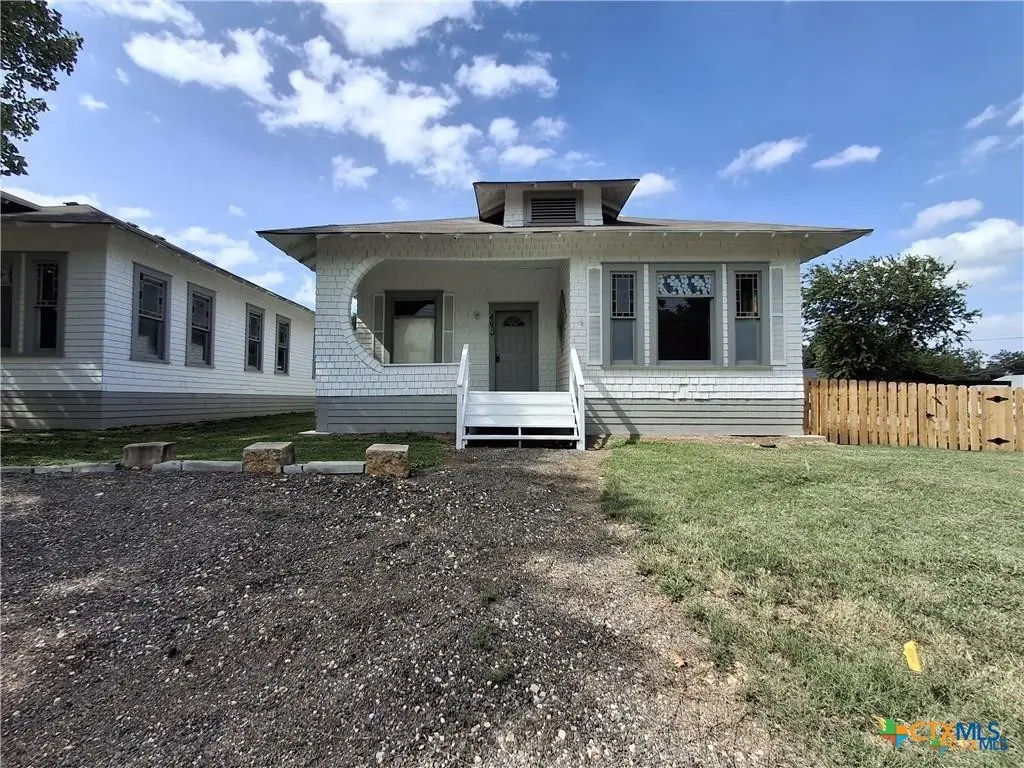
498 E Avenue R · Belton, TX
Flood risk 1/10 · Minimal
- FEMA flood zone
- X (unshaded)
- Chance of flooding over 30 yrs
- 0.0%
- Est. flood insurance / yr
- $507 – $1,088
Fire risk 5/10 · Moderate
- Est. fire insurance / yr
- $1,222 – $2,270
Heat risk 8/10 · Major
- Hot days now (above 108°F)
- 7 days/yr
- Hot days in 30 yrs
- 24 days/yr
Wind risk 6/10 · Moderate
- Chance of severe wind over 30 yrs
- 71.0%
Air-quality risk 1/10 · Minimal
- Unhealthy air days now
- 0 days/yr
- Unhealthy air days in 30 yrs
- 0 days/yr
Risk factors via First Street. Map © Google.
Why this score? — see what drove the C- grade
The composite is a weighted blend of 9 inputs, each scored 0–100. Each bar is that input's sub-score; the figure is the points it added to the 100-point composite (weight × sub-score).
- Cash flow +15.9/30.0
- ARV discount +15.0/15.0
- 1% rule +6.0/10.0
- DSCR +4.9/10.0
- Schools +3.8/10.0
- Livability +3.4/5.0
- Rent growth +2.8/5.0
- Condition / age +2.0/5.0
- Appreciation +0.0/10.0
$125,000
🖨 Deal sheet (PDF) 📄 Offer letter ✓ Due diligence
Listing remarks
Reposted for MLS data Sheet
Key facts
- 5,837 sq ft lot
- Parking
- Built 2022
Neighborhood map
What this means for you Summary
Snapshot
- This is a 2-bed/1.5-bath single-family listed at $125k. Condition is rated fair.
Deal economics
- At list price, monthly cash flow is $60 ($725/yr) — positive.
- The deal already cash-flows at list — no discount required.
- Meets the 1% rule at list price ($1k rent vs $125k).
- Cap rate 6.9% vs local median 3.6% in Belton — top-decile yield for the area; either an underpriced asset or a hidden risk that comps aren't pricing in. Stress-test before assuming the spread holds.
Location & tenants
- Location reads 68/100 on livability (#462 in TX) — a middle-class / working-renter tenant base. Strengths: cost of living A+, housing A+, crime A-; Watch: employment C-, amenities F, commute F.
- Belton ISD (suburban): math 39% / reading 46% proficiency, ranked #285 of 826 in TX (top 34%) — families likely to look elsewhere, expect single-tenant / working-renter base with shorter leases.
- Zoned schools: Miller Heights El (math 27% / reading 27%, grade F, #2,791 of 4,322 statewide, top 68%, 317 students, 82% FRL); Lake Belton Middle (math 47% / reading 52%, grade C, #356 of 1,662 statewide, top 23%, 826 students, 30% FRL); Belton H S (math 39% / reading 46%, grade F, #721 of 1,632 statewide, top 45%, 1,941 students, 46% FRL).
- Market conditions: Rents rising (+1.3%/yr); 750 active listings in the ZIP; 36 comparable units currently listed for rent nearby; rentals lingering (median 46d on market — plan ~5-8 weeks vacancy on turnover, expect pricing pressure); 53% of comp listings sitting > 30 days — soft ceiling on asking rent; solid renter incomes; 3,222 units permitted in Bell County in 2024 (246 in 5+ unit buildings).
Forward outlook
- Local home prices are declining (-3.0%/yr); year-one equity from $864 of loan paydown is wiped out by about $4k of value loss. Plan a longer hold.
- Bell County population projected at +21% by 2050 — long-run rental-demand tailwind backs the buy-and-hold thesis.
Negotiation context
- Only 0 days on market — expect competitive offers; lowballing is unlikely to land.
- 6 sale attempts since 2y ago with the ask held roughly flat each time — persistent listings suggest the price (not the market) is what's stuck; bring a comps-based counter.
Risks & watch-outs
- Watch-outs: property tax is 3.1% of price.
- Climate carrying-cost: major wind risk, 71% chance of damaging wind over 30y; moderate wildfire risk; extreme-heat days projected 7→24/yr by 2055 (HVAC capex compounding) — expect insurance premiums to compound above CPI over the hold.
Questions for the listing agent
- Have any recent inspections been done? Can we get a copy of the seller's disclosures and any deferred-maintenance estimates?
- Property tax is high relative to price — has the assessment been appealed recently, and will the sale trigger a re-assessment?
- Is there a deadline driving the sale (1031 exchange, divorce, estate, relocation)? That informs how much negotiation room exists.
- Schools are D-rated, which usually means shorter tenancies and higher turnover. Who's the typical renter profile here, and what's been the actual vacancy rate?
- What's the average days-on-market for RENTAL listings here right now (not sales)? A rising rental-DOM trend means longer vacancies and softer asking-rent achievability than the comps imply.
- What's the recent tenant-quality profile in this submarket — average credit score on applications, eviction rate, late-payment / NSF rate, and stable-employment percentage? A property-management company in the area should have these aggregated.
- How much new for-sale + rental construction is in the pipeline within 1–3 miles? Heavy new supply typically softens prices + rents 12–24 months out; constrained supply supports both.
Investment metrics
- 1% rule
- 1.10% ✓
- Cap rate
- 6.87%
- Cash-on-cash
- 2.07%
- DSCR
- 1.09
- GRM
- 7.6
CMA / ARV
- ARV (on-the-fly)
- $175,808
- Comps found
- 12
Show comp detail 12 sales within ~0.75 mi
| Address | Dist | Beds/Ba | Sqft | Sold | Price | $/sf | Match |
|---|---|---|---|---|---|---|---|
| 603 Holland Rd | 0.22mi | 2/1.0 | 960 (-10%) | 1mo | $170,000 | $177 | 69 |
| 1610 Oleta St | 0.28mi | 3/1.5 (+1) | 999 (-7%) | 8mo | $151,400 | $152 | 64 |
| 1129 Lindsey Cir | 0.58mi | 3/1.5 (+1) | 1,065 (-1%) | 5mo | $175,000 | $164 | 63 |
| 1009 E Avenue O | 0.49mi | 3/1.5 (+1) | 1,004 (-6%) | 3mo | $165,000 | $164 | 59 |
| 120 W Avenue J | 0.59mi | 1/1.0 (-1) | 1,110 (+4%) | 4mo | $125,000 | $113 | 56 |
| 414 E Avenue P | 0.16mi | 3/1.0 (+1) | 1,215 (+13%) | 14mo | $160,000 | $132 | 52 |
| 1160 Lindsey Cir | 0.54mi | 3/1.5 (+1) | 988 (-8%) | 6mo | $160,000 | $162 | 52 |
| 303 W Avenue I Ave | 0.70mi | 3/2.0 (+1) | 1,114 (+4%) | 4mo | $205,000 | $184 | 51 |
| 1415 Shady Ln | 0.65mi | 3/1.5 (+1) | 984 (-8%) | 2mo | $157,000 | $160 | 49 |
| 1104 Renee Spur | 0.54mi | 2/1.0 | 962 (-10%) | 15mo | $169,900 | $177 | 43 |
| 1402 Sharon Rd | 0.65mi | 3/2.0 (+1) | 1,211 (+13%) | 4mo | $270,000 | $223 | 38 |
| 1407 Magnolia St | 0.67mi | 3/1.0 (+1) | 960 (-10%) | 8mo | $163,134 | $170 | 38 |
Match score weights: distance 35% · size 25% · config 20% · recency 20%. Top-matched comps best support the ARV.
Projected returns pro-forma
-3.0% appreciation · 1.29% rent growth · sell at horizon
- IRR
- -15.2%
- Equity multiple
- 0.47×
- Total profit
- $-18,612
- Equity at exit
- $18,638
- IRR
- -10.3%
- Equity multiple
- 0.43×
- Total profit
- $-19,987
- Equity at exit
- $10,808
Cash invested: $35,000 (down + closing). Projections, not guarantees.
Landlord ↔ Tenant lean methodology
- Overall (STATE)
- 87 Strongly Landlord-Friendly
- State Texas
- 87 Strongly Landlord-Friendly · R+5
- County
- — inherits STATE
- City
- — inherits STATE
ZIP-level market 76513
- Rents YoY
- 1.3%
- Active inventory
- 750
- Price-to-rent
- 7.6×
Monthly cashflow live
- Estimated rent
- $1,376 high interval (Pro) →
- Mortgage (P&I)
- −$656
- Tax from tax record
- −$319 /mo · $3,824/yr
- Insurance
- −$52
- HOA
- −$0
- Vacancy / Maint / Mgmt
- −$289
- Net cashflow
- $60
Break-even live
Sensitivity live
| Price | -10% $131 | -5% $96 | +0% $60 | +5% $25 | +10% $-10 |
|---|---|---|---|---|---|
| Rent | -10% $-48 | -5% $6 | +0% $60 | +5% $115 | +10% $169 |
| Rate | -1.0pp $123 | -0.5pp $92 | base $60 | +0.5pp $28 | +1.0pp $-5 |
UW: 25.0% down · 7.5% · 30yr · 1.5% tax · 5.0% vac · 8.0% maint · 8.0% mgmt
Financing live
Cash to close
- Down payment
- $31,250
- Closing costs
- $3,750
- Reserves months
- —
- Total cash needed
- —
Loan-product check · same deal, 3 products live
Conventional
25% down · 7.5% · 30yr
- Down + closing
- —
- Monthly P&I
- —
- Monthly cashflow
- —
- DSCR
- —
- Eligible?
- —
Personal DTI + credit; lowest rate.
DSCR
20% down · 8.5% · 30yr
- Down + closing
- —
- Monthly P&I
- —
- Monthly cashflow
- —
- DSCR
- —
- Eligible?
- —
No personal income docs; deal must DSCR.
Hard money
10% down · 12.0% · 12mo
- Down + closing
- —
- Monthly P&I
- —
- Monthly cashflow
- —
- DSCR
- —
- Eligible?
- —
Short-term bridge; refi at stabilization.
Rent comps 36 comps
| Address | Beds | Baths | Sqft | Rent | $/sqft | DOM | Units | Dist |
|---|---|---|---|---|---|---|---|---|
| 1948 Royal Loop Belton, TX | 3.0 | 2.5 | 1486 | $1,495 | $1.01 | 45d | 1 | 0.44mi |
| 1614 Kelly Dr Belton, TX | 2.0 | 1.0 | 750 | $995 | $1.33 | 45d | 1 | 0.44mi |
| 1608 Kelly Dr Belton, TX | 2.0 | 2.0 | 825 | $950 | $1.15 | 15d | 1 | 0.45mi |
| 901 Carla Kay Dr Unit B Belton, TX | 3.0 | 2.5 | 1459 | $1,360 | $0.93 | 45d | 1 | 0.52mi |
| 1614 Shady Ln Belton, TX | 3.0 | 2.0 | 1486 | $1,500 | $1.01 | 45d | 1 | 0.61mi |
| 1400 Magnolia St Belton, TX | 3.0 | 1.5 | 1330 | $1,500 | $1.13 | 25d | 1 | 0.61mi |
| 1851 Connell St Belton, TX | 3.0 | 2.0 | 1344 | $1,550 | $1.15 | 45d | 1 | 0.62mi |
| 332 Arnold Dr Unit B Belton, TX | 2.0 | 2.0 | 1060 | $1,425 | $1.34 | 45d | 1 | 0.66mi |
| 1903 Connell St Belton, TX | 3.0 | 2.0 | 1293 | $1,342 | $1.04 | 15d | 10 | 0.68mi |
| 1572 Brady Way Belton, TX | 3.0 | 2.0 | 1203 | $1,295 | $1.08 | 22d | 1 | 0.69mi |
| 725 Laila Ln Belton, TX | 3.0 | 2.0 | 1207 | $1,345 | $1.11 | 15d | 1 | 0.70mi |
| 1013 Kerr Ct Belton, TX | 3.0 | 2.0 | 1293 | $1,290 | $1.00 | 25d | 1 | 0.71mi |
| 1539 Chance Ct Belton, TX | 3.0 | 2.0 | 1207 | $1,345 | $1.11 | 45d | 1 | 0.71mi |
| 912 Mason Dr Belton, TX | 3.0 | 2.0 | 1293 | $1,395 | $1.08 | 45d | 1 | 0.72mi |
| 912 Mason Dr Belton, TX | 3.0 | 2.0 | 1293 | $1,395 | $1.08 | 15d | 1 | 0.72mi |
| 1004 Kerr Ct Belton, TX | 3.0 | 2.0 | 1293 | $1,395 | $1.08 | 45d | 1 | 0.72mi |
| 1012 Kerr Ct Belton, TX | 3.0 | 2.0 | 1293 | $1,395 | $1.08 | 45d | 1 | 0.73mi |
| 1032 Mason Dr Belton, TX | 3.0 | 2.0 | 1293 | $1,395 | $1.08 | 25d | 1 | 0.75mi |
| 829 Laila Ln Belton, TX | 3.0 | 2.0 | 1338 | $1,345 | $1.01 | 25d | 1 | 0.76mi |
| 1032 Edwards Dr Belton, TX | 3.0 | 2.0 | 1293 | $1,395 | $1.08 | 25d | 1 | 0.76mi |
| 1044 Edwards Dr Belton, TX | 3.0 | 2.0 | 1293 | $1,290 | $1.00 | 25d | 1 | 0.81mi |
| 945 Laila Ln Belton, TX | 3.0 | 2.0 | 1338 | $1,345 | $1.01 | 45d | 1 | 0.83mi |
| 1538 Kal Ct Belton, TX | 3.0 | 2.0 | 1338 | $1,345 | $1.01 | 45d | 1 | 0.84mi |
| 1560 Kal Ct Belton, TX | 3.0 | 2.0 | 1338 | $1,345 | $1.01 | 22d | 1 | 0.84mi |
| 1013 Laila Ln Belton, TX | 3.0 | 2.0 | 1338 | $1,240 | $0.93 | 25d | 1 | 0.85mi |
| 1003 Laurel Dr Belton, TX | 1.0 | 1.0 | 904 | $1,295 | $1.43 | 25d | 1 | 0.87mi |
| 1011 Laurel Dr Belton, TX | 1.0 | 1.0 | 904 | $1,295 | $1.43 | 45d | 1 | 0.88mi |
| 1221 Jasmine Dr Belton, TX | 1.0–2.0 | 1.0–2.0 | 1057 | $1,450 | $1.37 | 15d | 4 | 0.94mi |
| 1044 Hibiscus Dr Belton, TX | 2.0 | 2.0 | 1210 | $1,450 | $1.20 | 45d | 1 | 0.95mi |
| 1057 Hibiscus Dr Belton, TX | 2.0 | 2.0 | 1210 | $1,450 | $1.20 | 45d | 1 | 0.97mi |
| 1124 W Avenue O Belton, TX | 1.0–2.0 | 1.0–2.0 | 853 | $1,375 | $1.61 | 15d | 14 | 0.98mi |
| 1075 Hibiscus Dr Belton, TX | 2.0 | 2.0 | 1210 | $1,450 | $1.20 | 45d | 1 | 1.00mi |
| 298 West Avenue A Unit A Belton, TX | 1.0 | 1.0 | 700 | $536 | $0.77 | 45d | 1 | 1.15mi |
| 302 Kegley St Belton, TX | 2.0 | 2.0 | 1350 | $1,500 | $1.11 | 25d | 1 | 1.24mi |
| 300 W 1st Ave Apt 222 Belton, TX | 2.0 | 1.0 | 800 | $925 | $1.16 | 45d | 1 | 1.26mi |
| 415 E 4th Ave Belton, TX | 2.0 | 1.0 | 1148 | $1,200 | $1.05 | 45d | 1 | 1.37mi |
Listing history 22 events
-
2026-05-13historical
-
2026-05-13$125,000
-
2025-10-14status Pending
-
2025-10-14historical
-
2025-10-02historical Active Under Contract
-
2025-09-22price $119,900
-
2025-07-11price $145,000
-
2025-06-06$150,000 Active
-
2025-04-03historical
-
2025-01-23price $145,000
-
2025-01-07price $150,000
-
2024-12-23status Active
-
2024-12-23price $155,000
-
2024-11-30historical Active Under Contract
-
2024-11-29status Active
-
2024-11-28historical
-
2024-10-17historical Active Under Contract
-
2024-08-19status Active
-
2024-08-19price $115,000
-
2024-08-08historical Active Under Contract
-
2024-07-26$125,000 Active
-
2024-05-03soldstatus
ⓘ Source: listings_history table (triggers on properties + properties_extension) + one-shot
backfill from property_details.listing_events for pre-trigger history.
Tax reassessment forecast TX · Resets to sale price
- Current annual tax
- $3,824 · $319/mo
- Projected year-2 tax
- $3,824 · $319/mo
- Expected delta
- $0/yr ($0/mo · 0.0%)
ⓘ Screening estimate from a state-policy table — verify with the county assessor before closing.
Climate risk First Street
- Flood 1/10 Low FEMA zone X (unshaded) · 0% chance over 30 yrs
- Wildfire 5/10 Major
- Heat 8/10 Severe 7 d/yr ≥108°F today · 24 d/yr by 30 yrs out
- Wind 6/10 Major 71% chance of damaging wind over 30 yrs
- Air quality 1/10 Low 0 unhealthy d/yr today · 0 by 30 yrs out
Nearby sold comps map
Loading sold comps map…
Walkable amenities ~0.75 mi
Loading nearby amenities…
Taxation est. · year 1
- Rental income
- $16,508
- − Mortgage interest
- −$7,002
- − Property taxes
- −$3,824
- − Insurance
- −$625
- − Repairs & maintenance
- −$1,321
- − Management
- −$1,321
- − Depreciation
- −$3,636
- Taxable loss
- −$1,221
- Est. tax savings @ 24.0%
- +$293
- After-tax cash flow
- $1,019/yr
For passive investors: Depreciation is non-cash, so a rental often shows a tax loss while cash-flowing — sheltering income. Rental losses are passive: they offset passive income freely, and up to $25,000/yr can offset ordinary (W-2) income if you actively participate and your MAGI is under $100k (phasing out to $0 by $150k); unused losses carry forward. On sale, claimed depreciation is recaptured at up to 25%, and gains may owe capital-gains tax (a 1031 exchange can defer both). Figures are a year-1 estimate at your 24.0% rate — not tax advice; consult a CPA.
Condition & rehab AI · 1 photo
This single-family home requires significant exterior repairs and maintenance, including painting and roof replacement, to improve its condition and value.
Repairs flagged
- Major exterior siding — Significant wear and tear
- Major roof — Appears aged and possibly damaged
Value-add opportunities
- Both paint exterior and roof — Enhances curb appeal and structural integrity
- Both replace exterior siding — Improves aesthetics and durability
- Both repair roof — Ensures structural integrity and reduces maintenance costs
Renovation cost estimate screening
| Repair item | Severity | Est. cost |
|---|---|---|
| exterior siding · Significant wear and tear | Major | $15,000–50,000 |
| roof · Appears aged and possibly damaged | Major | $15,000–50,000 |
| Total estimated repair cost · 2 items | $30,000–100,000 |
Value-add ROI direction
- Both paint exterior and roof — Enhances curb appeal and structural integrity ↑
- Both replace exterior siding — Improves aesthetics and durability ↑
- Both repair roof — Ensures structural integrity and reduces maintenance costs ↑
ⓘ Cost ranges are severity-bucket heuristics (US national rule-of-thumb). Get contractor quotes + a written scope before underwriting a rehab budget.
Schools (NCES district)
- District
- Belton ISD
- NCES district ID
- 4809860
- Math proficiency
- 39% ▼ -14.00%
- Reading proficiency
- 46% ▼ -4.00%
- Median HH income
- $61,239
- Composite
- 37.62/100
- National rank
- #4378
- State rank
- #285 of 826 in TX
Livability — Belton
- Score
- 68/100
- State rank
- #462
- US rank
- #9300
Category grades
Schools grade is shown separately in the Schools card above.
Census & demographics
- Census place
- Belton, TX
- County
- Bell County · 345,090 people
- City population
- 45,928
- Metro
- Killeen-Temple, TX
- Population (ZIP)
- 45,928
- Household income
- $80,661
- Rent vs Own
- Severe rent burden
- 1198.0
Population outlook (Bell County) Hauer SSP2
- Today (2025)
- 371,114 people
- By 2030
- 389,104 · +4.8%
- By 2040
- 420,592 · +13.3%
- By 2050
- 447,779 · +20.7%
- By 2075
- 499,130 · +34.5%
- By 2100
- 505,680 · +36.3%
Race, ethnicity, and origin ACS 2023
- Neighborhood character
- Majority White (62%)
- Race & ethnicity
- White 62% Hispanic / Latino 24% Two or more races 14% Black 6% Asian 2%
- Hispanic origin (detail)
- Mexican 19% Puerto Rican 1%
- Common ancestry
- Italian 3% Slovak 2% Lithuanian 2%
- Foreign-born
- 9% · Canada, Vietnam
- Languages at home
- 83% English-only · Spanish 13% Korean 1% Other Indo-European 1%
Political lean MEDSL · Bell
- 2024 margin
- R (+16.2) · D 41.3% · R 57.6% · Other 1.1%
- 2008→2024 swing
- -6.5pp toward R · 2008: -9.8pp · 2024: -16.2pp
- All cycles
- 2024: R+16.2 2020: R+8.5 2016: R+15.1 2012: R+16.4 2008: R+9.8
Not yet ingested
- Civics
- —
Market trends
- HPI YoY
- ▼ -105.10%
- Current HPI
- 183.6715
- Rent YoY
- ▲ 1.29%
- Metro
- Killeen-Temple, TX
- State GDP YoY
- ▲ 3.95%
- F500 in state
- 110
Industry mix (Fortune 500 HQ in TX)
| Industry | F500 HQs | Revenue |
|---|---|---|
| Energy | 16 | $1,198B |
|
||
| Technology | 5 | $198B |
|
||
| Engineering / Construction | 4 | $72B |
|
||
| Energy Services | 3 | $60B |
|
||
| Utilities | 3 | $41B |
|
||
| Healthcare | 2 | $330B |
|
||
Price history
+0.0% since first listed22 events — show timeline
- 2026-05-13 Listed $125,000 CTXMLS
- 2026-05-13 Listing Removed — CTXMLS
- 2025-10-14 Pending — CTXMLS
- 2025-10-14 Listing Removed — CTXMLS
- 2025-10-02 Contingent — CTXMLS
- 2025-09-22 Price Changed $119,900 CTXMLS
- 2025-07-11 Price Changed $145,000 CTXMLS
- 2025-06-06 Listed $150,000 CTXMLS
- 2025-04-03 Listing Removed — CTXMLS
- 2025-01-23 Price Changed $145,000 CTXMLS
- 2025-01-07 Price Changed $150,000 CTXMLS
- 2024-12-23 Relisted — CTXMLS
- 2024-12-23 Price Changed $155,000 CTXMLS
- 2024-11-30 Contingent — CTXMLS
- 2024-11-29 Relisted — CTXMLS
- 2024-11-28 Listing Removed — CTXMLS
- 2024-10-17 Contingent — CTXMLS
- 2024-08-19 Relisted — CTXMLS
- 2024-08-19 Price Changed $115,000 CTXMLS
- 2024-08-08 Contingent — CTXMLS
- 2024-07-26 Listed $125,000 CTXMLS
- 2024-05-03 Sold (Public Records) — Public Records
Property tax history
+4.1%/yrLatest (2025): $3,824 · +4.1% YoY. Source: county tax records.
Cash-flow waterfall
monthlySold comps — $/sqft
last 12 mo · ≤1 miLoading sold comps…